Publisher’s version / Version de l'éditeur: Composite Interfaces, 8, 5, pp. 345-353, 2001-10-01
READ THESE TERMS AND CONDITIONS CAREFULLY BEFORE USING THIS WEBSITE.
https://nrc-publications.canada.ca/eng/copyright
Vous avez des questions? Nous pouvons vous aider. Pour communiquer directement avec un auteur, consultez la
première page de la revue dans laquelle son article a été publié afin de trouver ses coordonnées. Si vous n’arrivez pas à les repérer, communiquez avec nous à [email protected].
Questions? Contact the NRC Publications Archive team at
[email protected]. If you wish to email the authors directly, please see the first page of the publication for their contact information.
Archives des publications du CNRC
This publication could be one of several versions: author’s original, accepted manuscript or the publisher’s version. / La version de cette publication peut être l’une des suivantes : la version prépublication de l’auteur, la version acceptée du manuscrit ou la version de l’éditeur.
For the publisher’s version, please access the DOI link below./ Pour consulter la version de l’éditeur, utilisez le lien DOI ci-dessous.
https://doi.org/10.1163/156855401753255431
Access and use of this website and the material on it are subject to the Terms and Conditions set forth at
Pressure-volume-temperature relations of a poly-e-caprolactam and its nanocomposite
Simha, R.; Utracki, L. A.; Garcia-Rejon, A.
https://publications-cnrc.canada.ca/fra/droits
L’accès à ce site Web et l’utilisation de son contenu sont assujettis aux conditions présentées dans le site LISEZ CES CONDITIONS ATTENTIVEMENT AVANT D’UTILISER CE SITE WEB.
NRC Publications Record / Notice d'Archives des publications de CNRC:
https://nrc-publications.canada.ca/eng/view/object/?id=172023ef-6d30-47ac-9a18-e2c9c47ece5e https://publications-cnrc.canada.ca/fra/voir/objet/?id=172023ef-6d30-47ac-9a18-e2c9c47ece5e
Pressure-Volume-Temperature Relations of a
Poly-
ε-caprolactam and its
Nanocomposite.
Published in: Composite Interfaces, 8, 345-353 (2001).R. Simha*
1, L. A. Utracki
2and A. Garcia-Rejon
2,
1
Dept. Macromolecular Science and Engineering, Case Western Reserve University, Cleveland, Ohio 44106-7202, USA; 2National Research Council Canada, Industrial Materials Institute, 75 de Mortagne, Boucherville, QC, Canada, J4B 6Y4;
Pressure-Volume-Temperature Relations of a
Poly-
ε-caprolactam and its Nanocomposite.
By: R. Simha, L. A. Utracki and A. Garcia-Rejon
Abstract
The equation of state of a poly-ε-caprolactam melt, PA-6, of molar mass Mn = 22 kg/mol was investigated
in a Gnomix apparatus (Gnomix Inc., Boulder, Colorado) between 300 and 560 degrees K, and pressures up to 150 MPa. Corresponding measurements were performed with addition of 1.6 weight percent of montmorillonite exfoliated particles. Reductions in specific volume of about 1.0 and 1.4%, respectively at 10 and 150 MPa, are observed. For the melt excellent agreement between experiment and the results from lattice-hole theory is found for both systems. Addition of the nanoparticles reduced the hole (free volume) fraction by 14%. Evidently, the hole fraction is a sensitive indicator of structural changes. It is noteworthy that such a small quantity of added nanoparticles increases the tensile strength by about 14% and modulus by 26%, at a cost of reduction in the elongation at break by about 25%.
For a treatment of the PNC, and as an approximation, our earlier model of a particulate composite was adopted. To calculate the binary interaction parameters it was assumed that: (1) the clay particles are in form of flat disks, 100 nm diameter and 1 nm thick; (2) the hard core segments of polymer and of solid occupy the same lattice volume, i.e., v11* = v22*; (3) the energetic interactions of polymer with solid are given by the geometric average between the two self-interactions. These assumptions lead to the following results (“11” represents polymer-polymer, “22” represents clay-clay and “12” represents polymer-clay interactions):
* * * 11 12 22 * * * 11 12 22 32.09 ; 313.54 3, 063 ( / ) 24.89 ; 33.53 24.89 ( / ) and kJ mol v v and v mL mol ε = ε = ε = = = = -
Introduction
There are several general motivations for the study of the pressure-volume-temperature (PVT) properties of a condensed system. First, these are pertinent for the processing of such materials. Second, by means of an adequate theory, they provide an insight into intermolecular attractions and repulsions, as we have learned from van der Waals. Third, PVT properties may be viewed as a precursor to or correlator of flow properties. Finally, in the present instance, it is important to establish the effect of the additive on all these properties. Our concern here are the first, second and the last aspect. The third topic is to be a future subject.
We investigate the PVT relations of two systems. One is a melt of poly-ε-caprolactam (PA-6), the other a corresponding nanocomposite, containing 1.6 wt. % of montmorillonite (MMT) exfoliated particles. The polymer’s molar mass is 22 kg/mol. The range of temperatures and pressures was 300-560 degrees K, and pressures up to 150 MPa respectively. For the melt, of interest here, the minimum temperature is about 500K. Changes of the physical properties and resulting information about interactions between the two constituents are the main concern of this work.
Experimental
Both, the PA-6 and, based on it, a polymeric nanocomposite (PNC) containing 2 wt% of intercalated MMT were supplied by Ube Industries Ltd. Prior to testing the material was dried at least for 48 hrs at 80oC.
To study the PVT behavior a Gnomix apparatus was employed, following the standard procedure described in the operation manual. Since the instrument measures only the incremental changes of the specific volume as a function of P and T, first an absolute value of the specific volume at ambient condition was measured with accuracy of ∆V ≤ ± 0.001 mL/g.
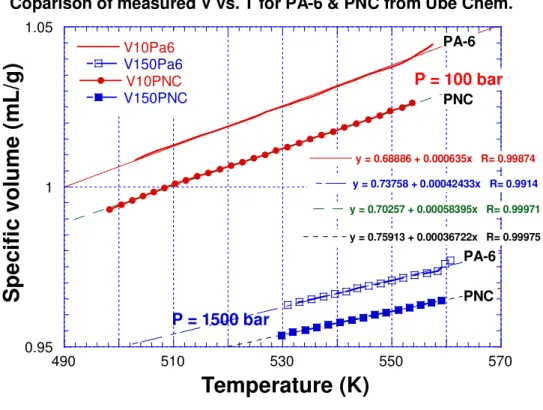
Figure 1 displays two isobars at 10 and 150 MPa for the two systems. Reductions in volume of 1.4 and 1% respectively are observed.
Theory: Single Constituent
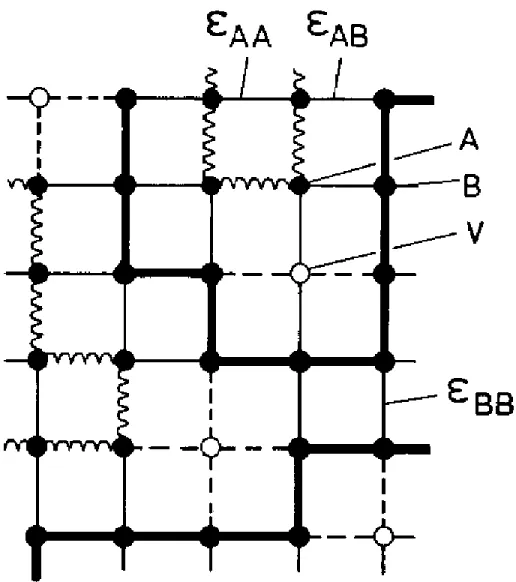
The basis for our considerations is lattice-hole theory [1]. As seen in Fig. 2, it describes an amorphous assembly of chain molecules by lattice sites each occupied by chain segments. In addition, to simulate molecular disorder, there is a fraction h of vacancies, which may be viewed as a particular type of free volume quantity. The configurational thermodynamic properties, such as the PVT (eos) relations, or the cohesive energy density, are then characterized by three quantities, i.e., the maximum attraction, ε*, between a pair of chain segments, the corresponding segmental repulsion volume, v*, and the number 3c of volume dependent, external degrees of freedom. In terms of these quantities and the number s of segments per chain, characteristic pressure, temperature and volume parameters can be defined, viz.
P* = qzε*/(sv*); T* = qzε*/Rc; V* = v*/Ms (1)
with Ms the molar segmental mass, qz = s(z-2) + 2, the number of interchain contacts in a lattice of coordination number z = 12, and R the gas constant. We then scale the variables of state, P, T, V in terms of these. Moreover, it turns out that these reduced variables define a universal, reduced P~−T~−V~ surface. In other words, they generate master isotherms and isobars. Provided the theory is quantitatively successful, a superposition of experimental and theoretical lines will yield the scaling parameters and thus the characteristic quantities defined in eq. 1.
To accomplish this, a reduced free energy function F~ has to be obtained. The theory [1] yields this function, as:
F =F [V ,T ,h(V ,T )] (2)
We note that the variables in eq. 2 contain, in addition to the usual volume and temperature, the hole fraction h, which in turn must vary with V~ and T~. This variation is obtained by minimizing the free energy at a specified volume and temperature, i.e.,
0 , ) / ~ (∂F ∂h ~v T~= (3)
T V F
P~=−(∂~/∂~) ~ (4)
The solution of eq. (3) then yields the hole fraction h, and its substitution into eq. (4) yields the equation of state. The explicit relation is [1]:
T Q yQ T V P~~/~=(1−η)−1+2 2(1.011 2 −1.2045)/~ (4’)
with y = 1-h; Q = 1/(yV~);η = 2-1/6yQ1/3. The minimization condition, eq. (3), yields the second relation: ] ~ 6 / ) 409 . 2 033 . 3 ( ) 1 /( ) 3 / 1 [( 3c η− −η −yQ2 Q2 − T +(1−s)−sn[(1− y)/y]=0 (3’)
A further assumption for long chains has been usually added, namely 3c / s→ . Equations (3’) 1 and (4’) have been applied to over 50 polymer and copolymer melts, and the scaling parameters, eq. 1, have been tabulated [2]. The evaluation of experimental data in terms of these equations proceeds by available statistical programs.
Simplifications of these equations in the limit of P~ →0, that is atmospheric pressure, have been available for the V~ - T~relation as well as for the hole fraction h [3,4]. For finite P~, the expressions are complex and temperature and pressure derivatives appear in implicit form [5]. A simplification of the general relations (3’) and (4’) has been recently obtained. That is, explicit polynomial interpolation expressions for their numerical solutions and for the h-function have been formulated [6].
The computations carried out for the present communication were performed using MicroMath
Scientist™ commercial software. The least-squares fitting minimized the differences between the
experimental data and the theory directly expressed by eqs. (3’) and (4’).
Theory: The Composite System
An extension of the theory to mixtures is needed. Obviously, as a prerequisite, a clear definition of the system is required. We can visualize a mixture of three constituents, namely pure polymer, pure inorganic particles, and particles with attached polymer chains. The required compositional
information is not available, and all we have to deal with is the total clay content. In order to proceed, we turn to a version of the theory of mixtures applied earlier to the thermal expansivity and bulk modulus of particulate composites [7, 8]. The aim there was to study the influence of the relative adhesion strength on the macroscopic properties, and the prediction of correlations between these properties. In the present instance we are able to evaluate the pressure experiments to obtain characteristic interaction parameters, as is to be shown below.
Considering the PNC system as a two-component mixture under random mixing assumptions, the scaled eqs. (3’) and (4’) retain their formal validity [9]. The interaction parameters ε* and v* now become compositional averages over 11, 22 and 12 interactions [9]. The site fractions X1 and X2 = 1 – X1 can be defined in terms of the mole fractions x1 and x2, thus:
) /( 1 1 2 2 1 1 1 q zX q zX q zX X = + (5)
Then the averages <ε*> and <v*> are related to the individual interactions as follows:
2 2 1 11 11 2 1 2 12 12 2 22 2 4 p * p p p * v* X v X X v X ; p , ε ε ∗ ε∗ ∗ ε∗ 〈 〉〈 〉 = + + = (6)
We note that the two powers of p reflect the assumed 6-12 pair potential. Equation (6) indicates the possibility of obtaining attractive and repulsive cross-interactions, once corresponding information for the separate constituents and the left hand side (l.h.s.) are known.
In essence then this device of simulating the PNC system yields effective cross-interactions as some averages of actual contacts and attached chains.
Applications
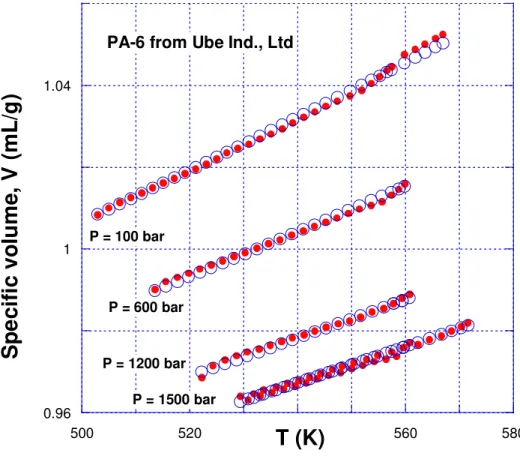
Figure 3 illustrates the application of eqs. (3’) and (4’) to our eos measurements of the PA-6 polymer. A close agreement theory with experiment is seen. The error statistics of the analysis yields the results shown in Table 1.
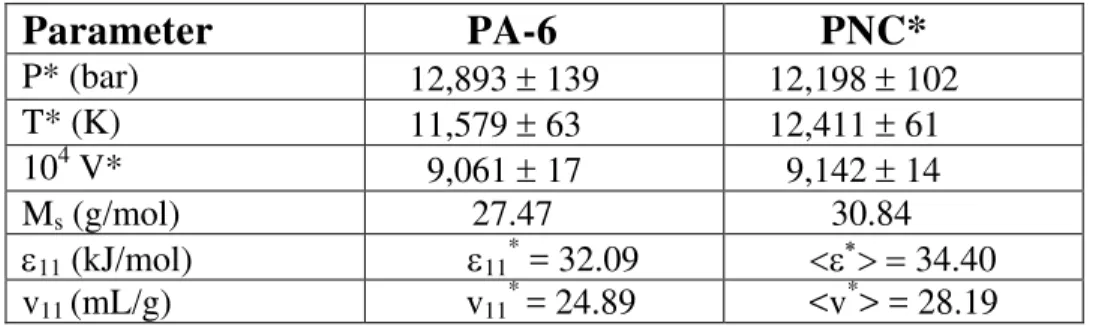
The second column of Table 2 lists the resulting P*, V*, T*, and the molar mass of the segment, calculated from the relation:
that follows from the definitions, eq. 1.
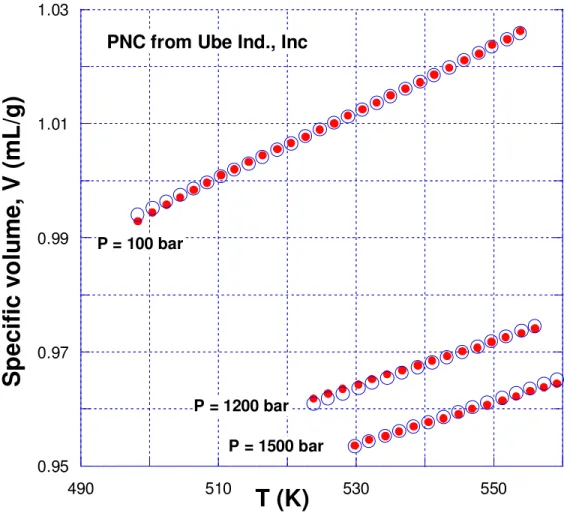
Next comes the analysis of the PNC. Figure 4 shows the results at 3 pressures, with the open circles indicating theory. Again, the close agreement is noted. As for PA-6, the statistics of fitting are shown in Table1.
Table 2 exhibits the average scaling parameters. We observe in particular the increase in T*, and thus the reduction in the scaled effective temperature for the nanocomposite. Moreover there is an expected increase of the effective, average attraction as well as of the segmental repulsion.
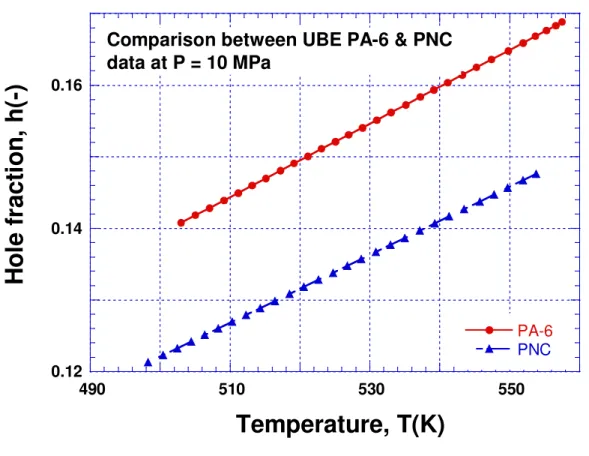
Next, it is of interest to compare the hole fractions. Figure 5 illustrates a considerable free volume reduction by the addition of nanoparticles. This quantity is a sensitive indicator of structural changes. We do note increases in modulus by 26% and tensile strength by 14%.
To proceed further along the lines suggested by eq. (6), to obtain particle-particle [22] and particle-polymer [12] interactions, the particle geometry must be defined and accommodated on the lattice that already has been adopted for the polymer. We model a clay platelet as a cylinder of diameter d and height h equal to 100 and 1 nm respectively. Its “molecular” mass, M, with a density, ρ = 2.5 g/mL, equals:
M = NAρπd2h/4 = 6.022 × 1023 × 2.5 × 103 × 3.14 × (104/4) × 10-27 = 11.824 kg/mol.
The particle “molecular” volume Vp = M/ρ equals therefore 4.73 × 10⁶ ml/mol. This volume is next decomposed into s2 segments each of a certain hard core volume to be accommodated on a lattice site.
In the lattice model of a mixture, the hard core volumes of the constituents should not differ too much, and we shall specify actual equality. Thus for the assumed 6-12 potential the factor 21/6 relates the positions of potential minimum and onset of repulsion. Hence we have (from Table 1)
∗ hard
v = MsV*/21/2 = 17.60 mL/mol. The chain length of PA-6, s1 = 22,000/27.47 = 801, and that of clay, s2 =Vρ /v∗hard = 2.6873×10⁵. With these numbers and the inorganic clay content of 1.6 wt%, the mole fractions equal x1 = (98.4/22)/(98.4/22 + 1.6/11,824) = 0.999970, x2 = 3.0 × 10⁻⁵ and the site fractions are X1 = zq1s1/(zq1s1 + zq2s2) = 0.9899545, X2 = 0.0100455.
Returning now to the two eqs. (6), there appear two experimentally determinable quantities,
* *
11 and v11
ε and 4 unknowns, namely the two 22 and two 12 interaction parameters. However, we have earlier specified the equality: v = 11∗ v . As to the attractions, we resort to Berthelot’s ∗22
geometric mean rule, i.e.:
2 / 1 22 11 12 ( ) ∗ ∗ ∗ = ε ε ε (7)
thus reducing the problem to the two unknowns ε and 22∗ v . The solutions of eqs. 6 then are: 12∗
∗ 11
ε = 32.09 kJ/mol; ∗ 11
v = v = 24.89 ml/mol; 22∗ ε = 3064 kJ/mol; 22∗ ε = 313.5 kJ/mol; and 12∗ v = 12∗
33.53 ml/mol.
Conclusions
1. The Simha-Somcynsky lattice-hole theory provides good description of the PVT behavior of PA-6 as well as its clay-reinforced nanocomposite (PNC). The correlation coefficient squared, r2 exceeds 0.999 999, with a standard deviation of data, σ < 0.001 mL/g.
2. Addition of 1.6 wt% or 0.64 vol% of exfoliated clay to PA-6 causes a large reduction of the free volume function h by 14%. This disproportionately large effect suggests that, consistent with reported earlier observations, PA-6 chains are adsorbed on the solid surface. The first few adsorbed layers are immobilized and this loss of mobility translates in our model into a free volume loss. The effect is simulated by a large adhesion ratio ε12∗ /ε11∗.
3. The large specific surface area of exfoliated clay determines matrix mobility and thus, it is reasonable to assume, influences PNC performance. In this manner the free volume connection makes PVT measurements and their evaluation a key for understanding and predicting PNC behavior.
4. The derived values of the interaction parameters are consistent with expected relative magnitudes. For example, the solid-solid interaction parameter, ε22* , is about 100 times larger than the liquid-liquid interaction parameter, ε11*. This is also about the ratio of surface energies.
5. Even assuming identity of the interacting volumes, v11* =v*22, the computed value of the 12 interaction volume, v12* ≅1.4v11* , indicates significant increase. This is again consistent with an immobilizing
Table 1. Statistical errors of fitting the experimental PVT data of PA-6 and its PNC to eqs. (3’) and (4’)
Parameter
PA-6
PNC
Correlation coefficient squared, r2 0.999 999 4 0.999 999 8 Standard deviation of data, σ 0.00070 0.00041 Coefficient of determination, CD 0.999 085 0.999 734
Table 2. Numerical values of the characteristic parameters in eqs. (1) and (1’) for the base PA-6 resin and its PNC
Parameter
PA-6
PNC*
P* (bar) 12,893 ± 139 12,198 ± 102 T* (K) 11,579 ± 63 12,411 ± 61 104 V* 9,061 ± 17 9,142 ± 14 Ms (g/mol) 27.47 30.84 ε11 (kJ/mol) ε11* = 32.09 <ε∗> = 34.40 v11 (mL/g) v11*= 24.89 <v*> = 28.19 * Values shown represent averages; see l.h.s. of eq. (6).References
1. R. Simha and T. Somcynsky, Macromolecules, 2, 342 (1969).
2. P. A. Rodgers, J. Appl. Polym. Sci., 48, 1061 (1993).
3. R. Simha and P. S. Wilson, Macromolecules, 6, 908 (1973).
4. R. Simha, Macromolecules, 10, 1025 (1977).
5. R. K. Jain and R. Simha, ibid., 24, 464 (1989).
6. L. A. Utracki and R. Simha, Macromol. Chem. Phys., Molecul. Theory Simul., 10, 17 (2001).
7. R. Simha, R. K. Jain and S. C. Jain, Polym. Composites, 15, 3 (1987).
8. E. Papazoglou, R. Simha, R. and F.H.J. Maurer, Rheol. Acta, 28, 302 (1989).
Figure Legends
Fig. 1: Isobars of Polymer PA-6 and Nanocomposite PNC at 10 and 150 MPa.
Fig. 2: Lattice Model of Chain Molecular Melt for two constituents (A and B) with Vacancies (V). The binary energetic interactions are indicated.
Fig. 3: Comparison of experimental (solid circles) and theoretical (open circles) isobars of PA-6 at indicated pressures.
Fig. 4: Comparison of experimental (solid circles) and theoretical (open circles) isobars of PA-6-based PNC at indicated pressures.
Figures
0.95 1 1.05
490 510 530 550 570
Coparison of measured V vs. T for PA-6 & PNC from Ube Chem.
V10Pa6 V150Pa6 V10PNC V150PNC y = 0.68886 + 0.000635x R= 0.99874 y = 0.73758 + 0.00042433x R= 0.9914 y = 0.70257 + 0.00058395x R= 0.99971 y = 0.75913 + 0.00036722x R= 0.99975
S
p
e
c
ifi
c
v
o
lu
m
e
(m
L
/g
)
Temperature (K)
P = 100 bar P = 1500 bar PA-6 PA-6 PNC PNCFig. 1: Isobars of Polymer PA-6 and Nanocomposite PNC at 10 and 150 MPa. The experimental specific volumes of these melts approximately linearly increase with T.
Fig. 2: Lattice Model of Chain Molecular Melt of two polymers (A and B) with Vacancies (V). The binary energetic interactions are indicated.
0.96 1 1.04
500 520 540 560 580
PA-6 from Ube Ind., Ltd
S
p
e
ci
fi
c vo
lu
m
e
, V
(m
L
/g
)
T (K)
P = 100 bar P = 1200 bar P = 1500 bar P = 600 barFig. 3: Comparison of experimental (solid circles) and theoretical (open circles) isobars of PA-6 at indicated pressures.
0.95 0.97 0.99 1.01 1.03 490 510 530 550
PNC from Ube Ind., Inc
S
p
e
c
if
ic
v
o
lu
m
e
, V
(
m
L
/g
)
T (K)
P = 100 bar P = 1200 bar P = 1500 barFig. 4: Comparison of experimental (solid circles) and theoretical (open circles) isobars of PA-6-based PNC at indicated pressures.
0.12 0.14 0.16
490 510 530 550
Comparison between UBE PA-6 & PNC data at P = 10 MPa PA-6 PNC