https://doi.org/10.5194/acp-19-11721-2019 © Author(s) 2019. This work is distributed under the Creative Commons Attribution 4.0 License.
Anthropogenic VOCs in Abidjan, southern West Africa: from
source quantification to atmospheric impacts
Pamela Dominutti1,5, Sekou Keita2,3, Julien Bahino2,4, Aurélie Colomb1, Cathy Liousse2, Véronique Yoboué4, Corinne Galy-Lacaux2, Eleanor Morris5, Laëtitia Bouvier1, Stéphane Sauvage6, and Agnès Borbon1
1Université Clermont Auvergne, CNRS, Laboratoire de Météorologie Physique (LaMP), 63000 Clermont-Ferrand, France 2Laboratoire d’Aérologie, Université Paul Sabatier Toulouse 3, CNRS, Toulouse, France
3Université Péléforo Gon Coulibaly, Korhogo, Côte d’Ivoire
4Laboratoire de Physique de l’Atmosphère (LAPA), Université Felix Houphouët-Boigny, Abidjan, Côte d’Ivoire 5Wolfson Atmospheric Chemistry Laboratories, Department of Chemistry, University of York, Heslington,
York, YO10 5DD, UK
6IMT Lille Douai, Sciences de l’Atmosphère et Génie de l’Environnement (SAGE), Douai, France
Correspondence: Pamela Dominutti (pamela.dominutti@york.ac.uk) and Agnès Borbon (agnes.borbon@uca.fr) Received: 3 December 2018 – Discussion started: 21 December 2018
Revised: 8 August 2019 – Accepted: 16 August 2019 – Published: 24 September 2019
Abstract. Several field campaigns were conducted in the framework of the Dynamics-Aerosol-Chemistry-Cloud In-teractions in West Africa (DACCIWA) project to measure a broad range of atmospheric constituents. Here we present the analysis of an unprecedented and comprehensive dataset in-tegrating up to 56 volatile organic compounds (VOCs) from ambient sites and emission sources. VOCs were collected on multi-sorbent tubes in the coastal city of Abidjan, Côte d’Ivoire, in winter and summer 2016 and later analysed by gas chromatography coupled with flame ionization and mass spectrometer detectors (GC-FID and GC-MS) at the labora-tory.
The comparison between VOC emission source profiles and ambient profiles suggests the substantial impact of two-stroke motorized two-wheel vehicles and domestic fires on the composition of Abidjan’s atmosphere. However, despite high VOC concentrations near-source, moderate ambient levels were observed (by factors of 10 to 4000 lower), sim-ilar to the concentrations observed in northern mid-latitude urban areas. Besides photochemistry, the reported high wind speeds seem to be an essential factor that regulates air pollu-tion levels in Abidjan.
Emission ratios (1VOC/1CO) were established based on real-world measurements achieved for a selected number of representative combustion sources. Maximum measured molar mass emissions were observed from two-wheel
vehi-cles, surpassing other regional sources by 2 orders of mag-nitude. Local practices like waste burning also make a sig-nificant contribution to VOC emissions, higher than those from light-duty vehicles by 1.5 to 8 orders of magnitude. These sources also largely govern the VOC’s atmospheric impacts in terms of OH reactivity, secondary organic aerosol formation (SOAP), and photochemical ozone creation poten-tial (POCP). While the contribution of aromatics dominates the atmospheric impact, our measurements reveal the sys-tematic presence of anthropogenic terpenoids in all residen-tial combustion sectors. Finally, emission factors were used to retrieve and quantify VOC emissions from the main an-thropogenic source sectors at the national level. Our detailed estimation of VOC emissions suggests that the road trans-port sector is the dominant source in Côte d’Ivoire, emit-ting around 1200 Gg yr−1 of gas-phase VOCs. These new estimates are 100 and 160 times larger than global inven-tory estimations from MACCity or EDGAR (v4.3.2), respec-tively. Additionally, the residential sector is largely underes-timated in the global emission inventories, by factors of 13 to 43. Considering only Côte d’Ivoire, these new estimates for VOCs are 3 to 6 times higher than the whole of Europe. Given the significant underestimation of VOC emissions from the transport and residential sectors in Côte d’Ivoire, there is an urgent need to build more realistic and region-specific emission inventories for the entire West African
re-gion. This might be true not only for VOCs, but also for all atmospheric pollutants. The lack of waste burning, wood fuel burning and charcoal burning, and fabrication representation in regional inventories also needs to be addressed, particu-larly in low-income areas where these types of activities are ubiquitous sources of VOC emissions.
1 Introduction
The West African region, located to the north of the Gulf of Guinea, is one of the most populated areas in Africa, with more than 300 million inhabitants in 2016 (United Nations, Department of Economic and Social Affairs, Population Di-vision, 2017). The population has increased by a factor of 5 since 1950, making West Africa the fastest growing re-gion in the world. Furthermore, future projections indicate population densities in developing countries will continue to increase. The impact in Africa will be particularly high, with projections indicating that the population of the conti-nent could represent 40 % of the world’s population by 2100 (United Nations, Department of Economic and Social Af-fairs, Population Division, 2017). The unplanned explosive growth of urban centres in the region is a significant issue, with water access, air pollution, health problems, and unreg-ulated emissions being identified as major concerns.
These emissions can produce diverse effects on atmo-spheric chemistry which are enhanced by severe photochem-ical conditions and dynamic atmospheric interactions. The atmospheric composition over West Africa is affected by air masses transported from remote sources, i.e. aerosol dust from the Sahara, biomass burning plumes, and local urban pollution (Knippertz et al., 2017; Mari et al., 2011). Observa-tions performed during the AMMA (African Monsoon Mul-tidisciplinary Analysis, West Africa, 2005–2006) campaign showed that air quality issues are predominantly related to traffic and combustion emissions (Mari et al., 2011). Res-idential emissions in southern West Africa (SWA) are at-tributed to charcoal and wood burning as they are primary sources of domestic energy, widely used for cooking and heating activities. Regional biomass burning is a significant source of carbonaceous aerosols and volatile organic com-pounds (VOCs) that can have effects on public health and cli-mate through the formation of secondary pollutants (Gilman et al., 2015; Knippertz et al., 2015b; Sommers et al., 2014).
Additionally, in most of the southern West African cities, traffic emissions are major sources of air pollution (Assamoi and Liousse, 2010). The road transport sector is largely dis-organized due to the underdevelopment of road networks and to the absence of a regulation policy for public transportation (Assamoi and Liousse, 2010). As a result, two-wheel vehi-cles are widely used in the cities for short-distance travel, re-placing public transport. Furthermore, the vehicle fleet has increased in the last year, which is characterized in most
cities by a large number of old vehicles (Keita et al., 2018). Over the next few years, African emissions from the com-bustion of fossil fuels, biofuels, and refuse are expected to increase considerably and could represent about 50 % of the global emissions of organic carbon (Knippertz et al., 2017; Liousse et al., 2014). However, emission estimates are un-certain, and detailed emission inventories are still required for a better estimation of their impacts on climate change and health over this highly sensitive region (Knippertz et al., 2017).
VOCs include a large number of species which can af-fect air quality by producing secondary pollutants such as ozone and secondary organic aerosols (Seinfeld and Pan-dis, 2006). Given the reactive nature of VOCs (Atkinson and Arey, 2003), VOC emissions need to be disaggregated by species or species groups for a better representation of their chemical features and to access their impacts on the sec-ondary formation processes. As VOCs are significant pollu-tants present in urban atmospheres, in situ VOC observations are necessary to directly assess exposure and to improve the prediction of secondary product formation.
Several field campaigns have been conducted in the last 20 years all over the world with the purpose of characteriz-ing VOC species to better understand their emission sources and fate (Bechara et al., 2010; Bon et al., 2011; Borbon et al., 2013; Brito et al., 2015; Dominutti et al., 2016; Kumar et al., 2018; Salameh et al., 2015; Wang et al., 2014; Warneke et al., 2007). In particular, VOC field observations have been intensely used as constraints for the development of reliable emission inventories (Borbon et al., 2013; Boynard et al., 2014; Gaimoz et al., 2011; Niedojadlo et al., 2007; Salameh et al., 2016b). Some of these studies pointed out significant discrepancies between inventory estimations and emission ratios derived from ambient measurements, implying some limitations in the accurate modelling of VOC impacts. For northern mid-latitude cities, discrepancies up to a factor of 10 for VOC emissions have been observed (Borbon et al., 2013; Boynard et al., 2014). Such discrepancies are expected to be even more substantial in places of the developing world with high anthropogenic pressures like Africa and South America (Huang et al., 2017). For Africa in particular, the emission inventories frequently used are those developed for global scales due to the lack of observations, which involve numer-ous uncertainties (Keita et al., 2018; Linumer-ousse et al., 2014). While global emission inventories commonly estimate the total mass of speciated VOCs, they fail in reproducing the spatial and temporal variability of VOC emission speciation. Indeed, the emission composition can change depending on the emission source, fuel quality, combustion technologies, and main regional practices (Huang et al., 2017). The use of activity data and emission factors derived from local mea-surements of region-specific sources may help to reduce the uncertainties in those emission inventories. A recent study calculated the emission factors (EFs) of different compounds and activities in southern West Africa (Keita et al., 2018). A
comparison of the emissions calculated from the EFs with those observed from the EDGARv4.3.2 (Huang et al., 2017) inventory showed a marked discrepancy (factor of 50 differ-ence) for 15 VOC species (3 alkanes, 8 aromatics, isoprene, and 3 monoterpenes) in Côte d’Ivoire. That study empha-sized the importance of considering African anthropogenic emissions at regional scales. Due to the scarcity of suitable data, the uncertainties in the observations cannot currently be assessed and more detailed studies are required to quan-tify these uncertainties. Characterization and quantification of the emissions are crucial for improving our understanding of the contributions of anthropogenic and natural sources to the atmospheric composition over southern West Africa and for assessing their impact on public health and air quality conditions.
Several intensive field campaigns in the framework of the Dynamics-Aerosol-Chemistry-Cloud-Interactions in West Africa (DACCIWA) project were conducted in 2015 and 2016 (Knippertz et al., 2015a). Here, we present the results obtained from the VOC field campaigns at differ-ent sites, including ambidiffer-ent and near-source measuremdiffer-ents, in one of the major southern West African cities: Abidjan in Côte d’Ivoire. Abidjan is the economic capital of Côte d’Ivoire, with a population of 6.5 million (in 2016), rep-resenting more than 20 % of the population of the country (United Nations, Department of Economic and Social Af-fairs, Population Division, 2017). Along with autonomous districts, Abidjan encompasses an area of 2119 km2 and is distinguished by remarkable industrialization and urbaniza-tion. In summer, West Africa is influenced by a monsoon phenomenon which is mainly driven by the surface pres-sure contrast between the relatively cold waters of the trop-ical Atlantic Ocean and the Saharan heat low (Knippertz et al., 2017). This seasonal circulation is characterized the wet (summer) and dry (winter) periods in the region. Dur-ing the dry season (November to February), most of the re-gion is dominated by dry north-easterly winds from the Sa-hara and the precipitation is confined to the coast, where the sea-breeze circulation provides humid air and produces near-surface convergence. Then, the monsoon starts its develop-ment and south-westerly moist winds begin to enter deeper into the continent, producing more clouds and precipitation between July and August. The strong pressure and temper-ature gradients between the Atlantic Ocean and the Sahara drive the strong monsoon flow northward along with south-westerlies, reaching higher latitudes up to 20◦N (Knippertz et al., 2015b).
Speciated VOCs were collected during DACCIWA using sorbent tubes and then analysed and quantified at the lab-oratory applying different gas chromatography techniques. These data provide the first constraints for the construction of a regional emission inventory and for understanding the role of anthropogenic VOC emissions in regional atmospheric chemistry.
This work aims to establish and analyse the spatial dis-tribution of VOC concentrations and VOC-speciated profiles of primary anthropogenic sources in Abidjan by performing sampling under real conditions. These sources include tradi-tional and region-specific ones, such as road transportation (gasoline and diesel emissions from different vehicles), char-coal fabrication, and burning emissions from domestic cook-ing fires, landfill waste, and hardwood fuel. This new dataset provides substantial information enabling the quantification of VOC emissions for several sources in Côte d’Ivoire. These source profiles are analysed and contrasted with those pro-vided by global emission inventories. Finally, the impact on air quality due to the use of region-specific sources is as-sessed in terms of reactivity and secondary pollutant forma-tion.
2 Materials and methods
As part of the DACCIWA project, intensive field campaigns were performed in 2015 and 2016, focusing for the first time on the most populated southern coastal region of West Africa. The DACCIWA campaign had an emphasis on atmo-spheric composition, including air pollution, health impacts, and cloud–aerosol interactions (Knippertz et al., 2015a). Here we present new results from intensive ambient mea-surements in Abidjan and an extended VOC speciation from source emission measurements. These results are part of the activities developed under the workpackage 2 (WP2) Air Pol-lution and Health, which aims to link and quantify emission sources, air pollution, and related health impacts over differ-ent urban sources in West Africa (Knippertz et al., 2015a). 2.1 Sampling
The field campaigns were conducted in Abidjan, Côte d’Ivoire, during summer and winter according to the strategic directions of the DACCIWA WP2. Two types of cartridges were deployed for VOC measurements: single-sorbent car-tridges made of Tenax TA 60–80 mesh (250 mg) or multi-sorbent cartridges made of Carbopack B (200 mg) and Car-bopack C (200 mg (carbotrap 202) purchased from Perkin Elmer). The combination of different sorbent materials al-lowed the sampling of 10 aromatics (C6–C9), 22 n-alkanes
(C5–C16), 10 monoterpenes, 7 aldehydes, isoprene, and other
oxygenated compounds. All compounds are reported in Ta-ble S1 in the Supplement. Before the sampling, cartridges were conditioned by flowing purified nitrogen, at a rate of 100 mL min−1for 5 h at 320◦C.
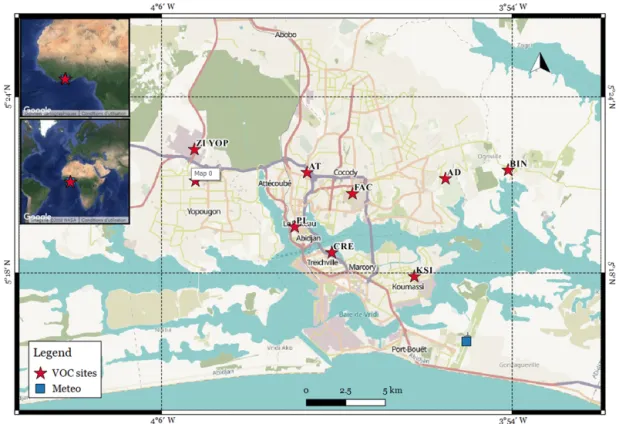
Firstly, ambient VOCs were collected to analyse their spa-tial distribution in Abidjan. Ambient measurements were performed at nine sites, which are shown in Fig. 1. The dis-tribution of the sampling locations was selected according to the primary source locations. They include urban back-ground sites and areas impacted by residential, road
trans-port, domestic fires, waste burning, and industrial activities. The characteristics and geographical location of each site are reported in Table 2. The ambient campaigns were conducted during the dry season (February 2016). Samples were col-lected every 2 d at different times of the day (from 06:00 to 20:00 LT) by using a manual pump (Accuro 2000, Dräger) at a 100 sccm (standard cubic centimetres per minute) flow rate. One single sorbent tube was exposed six times at each sampling location. In total, 3.6 L of air was collected at each site for a single 600 mL volume each time. Details on the sampling strategy are reported in Table S3.
Secondly, direct source emission measurements were per-formed to obtain VOC emission profiles from the main an-thropogenic sources in Abidjan. The sources include tra-ditional ones like road transportation, and southern West African specific ones such as domestic waste burning, char-coal fabrication, charchar-coal burning, as well as wood fuel burn-ing (Table 1). Despite part of these measurements for a lim-ited number of VOCs (15 species, including 3 alkanes, 8 aromatics, 3 terpenes, and isoprene) and particles being dis-cussed somewhere (Keita et al., 2018), we improve the VOC database extended to 56 VOC species measured in the fol-lowing source emissions.
– For road transportation, analysis of different vehicle exhaust measurements was carried out. Samples in-tegrate five road transportation sub-categories: heavy-duty diesel vehicles (HDDV, trucks, and buses – three samples on Tenax and three samples on Carbopack tubes), light-duty diesel vehicles (LDDV, diesel cars, two samples on Tenax tubes), light-duty gasoline ve-hicles (LDGV, gasoline cars, two samples on Tenax tubes), two-wheel two-stroke (TW2T, three samples on Tenax and three samples on Carbopack tubes), and two-wheel four-stroke (TW4T, three samples on Tenax and three samples on Carbopack tubes) vehicles. Differ-ences in fuel type (gasoline and diesel) and the fleet age have been considered. In African countries, two-wheel vehicles (two-stroke or four-stroke engines) frequently use a mixture of oil and gasoline derived from smug-gling, which is characterized by high pollutant emis-sions (Assamoi and Liousse, 2010).
– Regarding domestic waste burning (WB), samples were obtained (five samples on Tenax tubes) at the official do-mestic landfill site located to the east of Abidjan (AD, Fig. 1 and Table 2). The sampling was performed in-side the waste burning plume to integrate the different combustion processes involved.
– Charcoal burning (CH) and wood fuel burning (FW) are common cooking and heating practices in African urban areas. Wood fuel burning emissions were obtained by measuring the fire plume of tropical African hardwood, specifically Hevea (Hevea brasiliensis). Wood and char-coal were burned in two types of stoves traditionally
used in the southern West African region for cooking, which are made of metal and baked earth. The measure-ments included all the combustion phases (Keita et al., 2018) (four samples on Tenax and three samples on Car-bopack tubes).
– The charcoal making (CHM) profile was obtained by measuring emissions from traditional kilns that use dif-ferent types of dense wood. The kiln was covered with a layer of leaves and another one of soil of about 10 cm thickness. The smoke was sampled through holes made in the CHM kiln, which are located in the horizontal plane and provide the air circulation for the pyrolysis propagation (Keita et al., 2018) (two samples, one on Tenax and one on Carbopack tubes).
All samples were obtained in the emission plume at around 1–1.5 m from the source, except for vehicles where sam-ples were taken at the tailpipe outlet while the vehicle’s en-gine was idling. Carbon monoxide (CO) and carbon dioxide (CO2) measurements were also performed on the emission
sources together with the VOC measurements. For this, the QTRAK-7575 sensor (TSI, Keita et al., 2018) was used to measure real-time CO2 and CO gas concentrations. CO is
measured by using an electrochemical sensor with a sensitiv-ity of 0 to 500 ppm with ±3 % accuracy. CO2concentrations
are obtained by using a non-dispersive infrared detector with a sensitivity of 0 to 5000 ppm with an accuracy of ±3 %. The instrument was calibrated in the laboratory prior to each emission measurement. These concentrations were used for the estimation of EF values from different samples, which were later averaged for every source category. Details on the sampling strategy at emission are reported in Table S4. 2.2 Analytical instrumentation
Duplicate measurements were performed and analysed in two different laboratories to investigate the reproducibility of analytical techniques and to acquire a wider range of VOC species. The analysis of the Tenax TA tubes was performed at the Laboratoire de Météorologie Physique (LaMP, Clermont-Ferrand, France) using a gas chromatograph mass spectrom-eter system (GC/MS, Turbomass Clarus 600, Perkin Elmer®) coupled to automatic thermal desorption (Turbomatrix ATD). Each tube was desorbed at 270◦C for 15 min at a flow rate of 40 mL min−1 and pre-concentrated on a second trap at −30◦C containing Tenax TA. After the cryofocusing, the trap was rapidly heated to 300◦C (40◦C s−1) and the target
compounds were flushed into the GC. Due to the high loads in some samples, inlet and outlet splits of 5 and 2 mL min−1 were set up, respectively. The analytical column was a PE-5MS (5 % phenyl – 95 % PDMS, 60 m × 0.25 mm × 0.25 µm) capillary column (Perkin Elmer) and a temperature ramp was applied to guarantee the VOC separation (35◦C for 5 min, heating at 8◦C min−1to 250◦C, hold for 2 min). The mass spectrometer was operated in a total ion current (TIC) from
Figure 1. Geographical location of Abidjan, Côte d’Ivoire, and spatial distribution of ambient VOC measurements. Red stars indicate the VOC measurement sites and the blue square represents the meteorology site. More information about the ambient site is detailed in Table 2. Map: © OpenStreetMap contributors (OpenStreetMap contributors, 2015).
35 to 350 m/z amu. Chromatography parameters were opti-mized to enable good separation of 15 identified compounds by a complete run of 34 min on each cartridge. Calibration was performed by analysing conditioned cartridges doped with known masses of each compound, present in certified standard low-ppb gaseous standard, purchased from the Na-tional Physical Laboratory (NPL, UK; 4 ± 0.8 ppb). That method provided the separation and identification of 16 com-pounds, from C5 to C10 VOCs, including 8 aromatics, 3
monoterpenes, 4 alkanes, and isoprene. The limit of detection lies between 1.10 ppt (1,2,3-trimethylbenzene) and 22.6 ppt (2-methylpentane). The global uncertainty is estimated be-tween 5 % and 38 %.
Carbopack tube analysis was carried out by applying a gas chromatography-flame ionization detector (ATD-GC-FID, Perkin Elmer) system at the SAGE Department (IMT Lille Douai). The cartridges were previously thermo-desorbed at 350◦C for 15 min with a helium flow of 20 mL min−1. This method allowed the separation and identification of up to 56 compounds, from C5 to C16 VOCs, including 7
alde-hydes, 4 ketones, 10 monoterpenes, and 6 long-chain alka-nes from C12 to C16. More details on the analytical
tech-nique can be found elsewhere (Ait-Helal et al., 2014; Detour-nay et al., 2011). VOCs can be classified according to their saturation concentration, C∗, which indicates their
volatil-ity (Ait-Helal et al., 2014; Epstein et al., 2010; Robinson
et al., 2007). Here, C12–C16 alkanes are classified as VOCs
of intermediate volatility, given their C∗values are between 103µg m−3< C∗<106µg m−3(Ait-Helal et al., 2014). The detection limits lie between 1 and 13 ppt (hexadecanal) and the global uncertainty varies between 3.7 % and 32.6 %, as detailed elsewhere (Detournay et al., 2011; Keita et al., 2018).
The application of both methods allowed the compari-son of common compounds that were measured at ambient sites and sources (benzene, toluene, ethylbenzene, m + p-xylene, o-p-xylene, trimethylbenzenes, n-heptane, iso-octane, n-octane, α-pinene, β-pinene, limonene, isoprene) and the performance analysis of the analytical techniques. Further-more, the combination of different sorbent tubes and analyt-ical strategies allowed the quantification of a higher number of VOC species, and therefore, a more extensive analysis of source contributions.
2.3 Metrics and calculations
Different calculations were implemented to assess the VOC emissions and their impacts in Abidjan. Here we pro-vide the mathematical basis for each investigated parame-ter. Firstly, the EFs were computed for the whole extended VOC database (56 compounds) following the methodology described in Keita et al. (2018). EFs combined with regional
statistics were later used for the estimation of VOC emis-sions in Côte d’Ivoire for each source category. Secondly, the emission ratios (ERs) of each VOC species related to CO for all the emission sources were established. Finally, the re-ported ERs were used to evaluate the impacts on atmospheric reactivity by applying commonly used metrics.
2.3.1 Emission factors and quantification of VOC emissions
VOC emission factors were estimated from the concentra-tions measured for all the emission sources, as follows:
EF (VOC) =
1VOC
1CO+1CO2 ×MWVOC
12 ×fc×10
3, (1)
where EF (VOC) is the emission factor of the specific VOC in gram per kilogram of burned fuel (g kg−1); 1VOC = [VOC]emission− [VOC]backgroundis the VOC mixing ratio in
the emission and background air, respectively, in parts per billion by volume (ppbv), MWVOCis the molar weight of the
specific VOC (in g mol−1), 12 is the molar weight of carbon (g mol−1), and fc is the mass fraction of carbon in the fuel
analysed. The fc values used were obtained from the
liter-ature and applied to each source. The EFs for selected 15 VOCs were already published, and more details about the method can be found elsewhere (Keita et al., 2018). Here we applied the same method for the whole VOC database, including 56 compounds directly measured from the emis-sion sources. For this, VOC emisemis-sions were estimated us-ing the emission factors obtained from near-source measure-ments along with the statistical International Energy Agency (IEA) activity data, available for the different sources). Equa-tion (1) was used to compute the emission factors, consider-ing all the VOC species measured and includconsider-ing the mass fraction of each fuel (fc) obtained from the literature.
Ad-ditionally, the differences in fuel type and the fleet age have been considered, as well as the fleet distribution by calcu-lating the equivalent vehicular fleet. For the road transport sector, the equivalent fleet means were calculated consider-ing the fleet characteristics in Côte d’Ivoire, as detailed in Keita et al. (2018). These calculations were based on the in-formation given by the Direction Generale des Transports Terrestres in Côte d’Ivoire, which considered that 60 % of vehicles are old models and 77 % of the total fleet is com-posed of light-duty vehicles. Regarding two-wheel vehicles, 60 % of them are two-stroke engines, and only 40 % of the to-tal are considered recent vehicles (SIE CI, 2010). In the res-idential profile, we integrated the emissions measured from charcoal making, charcoal burning, and wood fuel burning sources, commonly observed at residential sites in Abidjan. Afterwards, the mean road transportation and residential pro-files for Côte d’Ivoire were computed and compared with two referenced global inventories, EDGAR v4.3.2 and MACCity (Granier et al., 2011; Huang et al., 2017).
2.3.2 Molar mass emission ratios
ERs were obtained by dividing each VOC mixing ratio by carbon monoxide (CO) mixing ratios as follows:
ER =[1VOC] ppbv
[1CO] ppmv. (2)
We selected CO as a combustion tracer because most VOCs and CO are co-emitted by the target sources. Furthermore, ra-tios to CO are regularly reported in the literature for biomass burning and urban emissions (Baker et al., 2008; Borbon et al., 2013; Brito et al., 2015; Gilman et al., 2015; de Gouw et al., 2017; Koss et al., 2018; Wang et al., 2014), which are useful constraints for further comparisons. Emission ratios were calculated in ppbv of VOC per parts per million by vol-ume (ppmv) of CO, which is similar to a molar ratio (mmol VOC per mol CO). Molar mass (MM) emission ratios were also computed following Gilman et al. (2015). MM is the VOC mass emitted (µg m−3) per ppmv CO, obtained from Eq. (2) and converted by using the VOC molecular weight (MW) (g mol−1) and the molar volume (24.86 L at 1 atm and 30◦C). Table S1 includes the emission ratios obtained for
each VOC and MW value used. 2.3.3 VOC–OH reactivity
The OH reactivity was estimated to evaluate the potential contribution of each measured VOC to the photochemical processing. VOC–OH reactivity represents the sink reaction of each VOC with the hydroxyl radical (OH) and is equal to VOCOH reactivity=ER × kOH×CF, (3)
where ER is the emission ratio for each VOC re-lated to CO (ppbv per ppmv), kOH is the
second-order reaction rate coefficient of VOC with the hy-droxyl radical (×10−12cm3molecule−1s−1), and CF is the conversion factor of molar concentration (2.46 × 10¹⁰molecule cm−3ppbv−1at 1 atm and 25◦C) (Gilman et al., 2015). kOH values for all VOC species were obtained
from Atkinson and Arey (2003) and the NIST Chemical Ki-netics Database (Manion et al., 2015).
2.3.4 Ozone formation potential
The oxidation of VOCs is often initiated by the reaction with the hydroxyl radical ( qOH), which in the presence of NOx
(NO+NO2) leads to the photochemical formation of O3. The
ozone formation potential represents the ability of each VOC to produce tropospheric ozone, and it was calculated as fol-lows:
VOC_ ozone formation potential = ER × POCP, (4) where the ER is the emission ratio of each VOC related to CO (ppbv of VOC per ppmv of CO) and POCP is the photochem-ical ozone creation potentials developed in previous studies
(Derwent et al., 2007; Jenkin et al., 2017). POCP values were obtained by simulating a realistic urban mass trajectory with the Master Chemical Mechanism (MCM). This model esti-mates the change in ozone production by incrementing the mass emission of each VOC (Derwent et al., 1998). POCPs for an individual VOC are estimated by quantifying the effect of a small increase in its emission on the concentration of the formed modelled ozone respective to that resulting from the same increase in the ethene emission (the POCP value for ethene is, therefore, 100). In this study, POCP values were analysed on a VOC family basis obtained from a recent study (Huang et al., 2017) or adapted from individual POCP values. 2.3.5 Secondary organic aerosol (SOA) formation
potential
The SOA formation potential represents the propensity of each VOC to form secondary organic aerosols and is equal to
SOA_ VOC formation potential = ER × SOAP, (5) where ER is the emission ratio for each measured VOC re-lated to CO (ppbv of VOC per ppmv of CO) and SOAP is a non-dimensional model-derived SOA formation potential (Derwent et al., 2010; Gilman et al., 2015). All SOAP values represent the modelled masses of organic aerosol that were formed per mass of VOC reacted on an equal mass emitted basis relative to toluene. Toluene was selected as the refer-ence compound due to its well-known emissions, and it is usually documented as a critical anthropogenic SOA precur-sor (Derwent et al., 2010).
ER, kOH, and SOAP values for each VOC and each source
are detailed in Table S1. In the absence of SOAP values for specific compounds, we estimated the values (indicated in Table S1, referred to asa) by using those of comparable com-pounds based on similar chemical properties, as suggested in the study of Gilman et al. (2015).
2.4 Ancillary data
Meteorological observations were provided by the NOAA Integrated Surface Database (ISD; https://www.ncdc.noaa. gov/isd, last access: 6 June 2018, for more details). Daily rainfall, air temperature, and wind speed and direction mea-surements were recorded at the Abidjan Felix Houphouet Boigny Airport. Figure 1 gives the geographical location of the meteorological station and ambient sampling locations.
3 Results and discussion
3.1 Local meteorological conditions
Meteorological data from Abidjan, Côte d’Ivoire, are re-ported in Fig. 2. Weekly accumulated precipitation and weekly air temperature means were analysed during 2016.
Meteorological conditions in Abidjan are also affected by the monsoon phenomenon which establishes two well-defined seasons: a wet season between March and August and a dry season from November to February. The weekly mean air temperature observed was between 24.6 and 29.4◦C, reaching a maximum during the beginning of the wet sea-son (Fig. 2). The precipitation pattern shows an increased rate during the monsoon period; however, negative anoma-lies were observed this year compared with the previous ones (Knippertz et al., 2017). Observed wind patterns during the field campaign showed a predominant contribution from the south-westerly sector with maximum speed during daytime of up to 13 m s−1. The high wind speed records reported in Abidjan are higher than those observed in other polluted urban atmospheres (Dominutti et al., 2016; Salameh et al., 2016a; Zhang et al., 2014).
3.2 VOCs in the Abidjan atmosphere
Our analysis relies on the 15 VOC species already listed in Keita et al. (2018, only for emission sources), and these were measured in both ambient air and at emission sources. The VOCs include eight aromatic hydrocarbons, three monoter-penes, three alkanes, and isoprene, which span a wide range of reactivity and represent the various types of VOCs ex-pected to be released by fossil/non-fossil fuel combustion and biogenic emissions.
3.2.1 Ambient concentrations and spatial distribution The ambient concentration sum of the 15 quantified VOCs ranged from 6.25 to 72.13 µg m−3(see size-coded pie chart, Fig. 3). Higher VOC concentrations were reported in KSI, BIN, CRE, and PL sites (Fig. 3). The predominant VOCs are toluene (4.18 ± 3.55 µg m−3), m + p-xylene (4.05 ± 3.41 µg m−3), iso-octane (2.59 ± 3.37 µg m−3), benzene (1.00 ± 0.41 µg m−3), ethylbenzene (0.93 ± 0.86 µg m−3), and limonene (0.77 ± 0.76 µg m−3). Overall, anthropogenic VOCs dominated the ambient composition by factors of 5 to 20 compared to biogenic ones. BTEX (benzene, toluene, ethylbenzene, and m + p and o-xylenes), a subgroup of aro-matic VOCs, usually makes up a significant fraction of the VOC burden in urban atmosphere (Borbon et al., 2018; Boy-nard et al., 2014; Dominutti et al., 2016). They are emit-ted by fossil fuel combustion from transport and residential sources as well as evaporation processes such as fuel stor-age and solvent uses (Borbon et al., 2018). Here their con-tribution ranged from 35 % to 76 % of the total VOC bur-den measured at the ambient sites. Therefore, the following discussion will only focus on BTEX as representative of all measured anthropogenic VOC patterns. Figure 3 shows the spatial distribution of the total VOC concentrations at each site and detailed by the BTEX composition. Firstly, a spa-tial heterogeneity of the total measured VOC concentration (total values on pie chart, Fig. 3) is depicted in the Abidjan
Figure 2. Meteorological data observed in Abidjan, Côte d’Ivoire. The figure represents (a) the weekly accumulated precipitation (in mm month−1) and weekly mean air temperature (in◦C) and (b) the wind speed (in m s−1) and direction observed (deg), during the field campaigns (2016). Data were downloaded from the National Centers for environmental information site (NCDC), NOAA, and recorded at Abidjan International Airport (see location in Fig. 1).
Figure 3. Spatial distribution of VOCs measured at ambient sites in Abidjan, size-coded by the sum of VOCs (in µg m−3) and color-coded by the relative contribution of BTEX compounds (% in mass), namely m + p-xylene (m + p-xyl), toluene (Tol), o-xylene (o-xyl), ethylbenzene (EthylB), benzene (Benz), and other VOCs. Values shown in each pie chart represent the total VOC concentration measured at the sampling point. Ambient site names and characteristics are presented in Table 2. Map: © OpenStreetMap contributors (OpenStreetMap contributors, 2015).
district. This spatial heterogeneity has been already pointed out by recent studies performed in Abidjan for other atmo-spheric pollutants (Bahino et al., 2018; Djossou et al., 2018). While a spatial heterogeneity was also observed in aerosol concentrations (Djossou et al., 2018), maximum aerosol con-centrations were reported near domestic fires (similar to KSI)
and landfill sites (AD), showing a different pattern than the one observed for the VOC concentrations. Besides the di-lution processes, the spatial distribution of total VOC con-centrations seems to be related to the proximity of emission sources, affecting ambient VOC concentrations in the dif-ferent sampling locations. For example, higher total VOC
Figure 4. Boxplot showing the VOC concentrations (µg m−3) at Abidjan ambient sites (a). The middle line in each box plot indi-cates the median (50th percentile), the lower and upper box limits represent the 25th and 75th quartiles, respectively, and the whiskers the 99 % coverage assuming the data have a normal distribution. (b) shows the mean concentrations reported in other cities world-wide, such as Abidjan – Côte d’Ivoire (this study), Paris – France (AIRPARIF, 2016), São Paulo – Brazil (Dominutti et al., 2016), Beirut – Lebanon (Salameh et al., 2014), Karachi – Pakistan (Bar-letta et al., 2002), and Welgegund – South Africa (Jaars et al., 2014).
concentrations were mainly observed in the central urban area (like KSI, CRE, and PL) where the density of emission sources increases.
Second, m + p-xylene and toluene dominate the ambient distribution of BTEX, ranging from 9 % to 27 % and 8 % to 31 % of the total VOC, respectively. BTEX composition is consistent between PL, CRE, BIN, and KSI sites with high VOC loads, while an enrichment in benzene concentrations is observed at FAC, ABO, ZYOP, AT, and AD sites (from 16 % to 30 % contribution). The BTEX composition can be affected by emissions and chemistry. The toluene-to-benzene ratio is a useful indicator of either traffic and non-traffic source or chemistry effects. On the one hand, the toluene-to-benzene at PL, CRE, BIN, and KSI sites is higher than 4, which suggests the influence of sources other than traffic like industrial sources. On the other hand, the toluene-to-benzene lies between 0.8 and 1.9 at lower VOC load sites (FAC, ABO, ZYOP, AT, and AD) (Brocco et al., 1997; Heeb et al., 2000; Muezzinoglu et al., 2001). These values are closer to the one usually observed at traffic emissions. There is no visible ef-fect of chemistry here, especially on higher aromatics like C8
aromatics with a shorter lifetime whose contribution stays al-most constant regardless of the site.
The mean ambient concentrations observed in Abidjan for alkanes and aromatics were compared with those observed
in other cities worldwide (Fig. 4). On the one hand, mean concentrations in Abidjan depicted lower values when com-pared with those measured in other cities (Fig. 4). Keita et al. (2018) pointed out the high emissions observed in Abid-jan sources. In their study, road transport and wood burning VOC emission factors spanned 2 to 100 orders of magni-tude, respectively, when compared with those from the lit-erature. Our ambient observations suggest that wind speeds have an important role in the mixing and dilution of the an-thropogenic emissions leading to low VOC concentrations in the Abidjan atmosphere. As was pointed out in the meteo-rological description, the proximity of Abidjan to the ocean and the intrusion of the sea-breeze circulation can facili-tate the dispersion processes and, consequently, the urban emissions dilution. Indeed, Deroubaix et al. (2019) analysed the regional dispersion of urban plumes from southern West African coastal cities, i.e. Abidjan, where the inland north-ward transport of anthropogenic coastal pollutants along with biomass burning emissions were observed.
On the other hand, a reasonably good agreement in the relative composition of alkanes and aromatics is observed, showing the same distribution in most cities, except for Karachi, where higher contributions of heptane and ben-zene were measured (Barletta et al., 2002). Observed con-centrations of hydrocarbons result from primary emissions, chemical processing, and dilution in the atmosphere. Dilu-tion affects equally all the compounds by decreasing abso-lute levels without altering their composition. Chemistry can be neglected because the transport time between major ur-ban sources and receptor sites is usually less than the com-pound lifetimes (here the shortest lifetime for trimethylben-zene is 4.3 h). Finally, only emissions are expected to sig-nificantly alter the hydrocarbon composition. However, the composition is the same regardless of the location. Such commonality suggests that the urban hydrocarbon compo-sition worldwide is controlled by emissions from fossil fuel combustion and, gasoline-powered vehicles in particular (see also next section). Finally, the ambient hydrocarbon distri-butions in Abidjan are noticeably similar to other northern mid-latitude megacities, suggesting that emissions from fos-sil fuel combustion for alkanes and aromatics dominate over other region-specific sources. These results are also con-sistent with previous studies comparing different databases worldwide without including an African city like Abidjan (Borbon et al., 2002; Dominutti et al., 2016; von Schnei-demesser et al., 2010). Even if emissions can be different in intensity (number of vehicles for instance), the hydrocar-bon composition seems to be similar in the different urban atmospheres.
3.2.2 Ambient composition versus emission source profiles
A comparative approach was carried out between ambi-ent and source measuremambi-ent compositions with the purpose
Figure 5. Relative concentration comparison between ambient measurements and emission source profiles of VOCs measured in Abidjan, Côte d’Ivoire. Orange- and yellow-based colours represent the contributions of alkanes, blue-based colour aromatics, and green-based colour terpenes and isoprene.
of detecting emission source fingerprints in ambient VOC profiles. Figure 5 shows the relative mass contribution of VOC profiles observed at the nine urban sites together with those obtained from the emission sources. While a notice-able variability in the contribution of emission sources is ob-served, smoother differences are depicted between the am-bient sites. This result reinforces the similar BTEX pro-files discussed in Sect. 3.2.1, where the mixing and dilution process were suggested as the main drivers in the control of ambient emissions. Trimethylbenzenes (124-TMB, 135-TMB, and 123-TMB), mainly observed in road transport emissions, display a dissimilar profile showing higher frac-tions from sources than ambient sites (Fig. 5). These differ-ences might be related to the short lifetime of these com-pounds (around 4 h), with a reaction rate ranging from 1.8 to 8.8 × 10⁻¹⁵cm3molecule−1s−1(Atkinson and Arey, 2003). Their reactivity implies a faster reaction in the atmosphere and losses of these species from the emission to the receptor. On the other hand, in most of the cases, ambient profiles showed higher contributions of alkanes, monoterpenes, and isoprene, likely associated with the contribution from dif-ferent anthropogenic and biogenic sources. The presence of terpenes and isoprene in the profile of all emission sources is notable, mainly in those associated with domestic ing processes, such as charcoal, waste, and wood fuel burn-ings (Fig. 5). The terpene emissions from biomass burning were already identified in several studies as they are com-mon species emitted by combustion processes (Gilman et al., 2015; Simpson et al., 2011). Additional studies based on African biomass emissions also reported concentrations of limonene and α-pinene higher than isoprene (Jaars et al., 2016; Saxton et al., 2007).
For the selected VOC species, aromatic compounds rep-resent the higher fraction from ambient and source profiles,
contributing 31 % to 75 % (Fig. 5). Comparing the same VOC species in emission sources versus ambient profiles, we found a similarity to the two-wheel vehicle and domestic fire profiles like wood fuel burning and charcoal burning sources. Nevertheless, the VOC ambient profiles obtained from the sites did not show a contrasted difference despite the differ-ences in the activities conducted nearby.
3.3 Molar mass of measured VOC emissions in Abidjan Here we compare the composition and magnitude of anthro-pogenic emissions as a function of molar mass emission ra-tios as described in Sect. 2.3.2, which is a readily calculated property used to quantify anthropogenic emissions (Gilman et al., 2015). For this analysis, our expanded VOC database of 56 species was considered, including 12 terpenes, VOCs of intermediate volatility (IVOCs from C12to C16n-alkanes),
ketones, and aldehyde (> C6) compounds for all sources
(Ta-bles 1 and S1). Species groups were classified according to GEIA groups (Huang et al., 2017) according to the chem-ical function of each VOC family (Table S2). In this way, molar masses were also grouped by VOC family from in-dividual values (Table S1). Since the VOCs of intermediate volatility (IVOCs) do not have a specific classification, they were integrated into the group of heavy alkanes (VOC6). Note also that the most volatile fraction of OVOC, which usually represents the major fraction, is not represented here in the VOC22 and VOC23 categories. The associated contri-bution should be analysed as the lower expected limit. Fig-ure 6 shows the contribution of VOC groups to the mea-sured molar mass and the total molar mass of each source, while Fig. 7a–d (upper panel) compared the magnitude of measured molar masses for the four leading sectors. As al-ready described in the previous section, the distribution re-ported in Fig. 6 reveals the predominance of aromatic
mo-Figure 6. Contribution of VOC reported in Table S1 to the measured molar mass of anthropogenic sources analysed in Abidjan, aggregated in VOC families (Table S2). The emission sources under analysis are heavy-duty diesel vehicles (HDDV), two-wheel two-stroke vehicles (TW2T), two-wheel four-stroke vehicles (TW4T), light-duty diesel vehicles (LDDV), light-duty gasoline vehicles (LDGV), charcoal burning (CH), wood fuel burning (FW), charcoal making (CHM), and waste burning (WB). Values in the upper panel represent the total measured molar mass (in µg cm−3ppm CO−1) of the respective anthropogenic source.
Table 1. Description of the emission sources measured and evaluated in Abidjan, Côte d’Ivoire.
Reference Sub-group Description source type
HDDV Heavy-duty diesel vehicles Diesel emissions Road transport HDDV-T Diesel trucks Diesel emissions Road transport HDDV-B Diesel buses Diesel emissions Road transport LDDV Light-duty diesel vehicles Diesel emissions Road transport LDGV Light-duty gasoline vehicles Gasoline emissions Road transport TW TW2T Two-wheel two-stroke a mixture of smuggled oil and gasoline Road transport TW4T Two-wheel four-stroke a mixture of smuggled oil and gasoline Road transport CH Charcoal Charcoal burning Residential FW Wood fuel burning Hevea brasiliensis Residential CHM Charcoal making Charcoal fabrication Residential WB Waste burning Domestic landfill burning Waste burning
lar masses (VOC13–VOC17), ranging from 26 % to 98 %. The prevalence of these compounds is predominantly ob-served in gasoline-fuelled vehicles, like gasoline light-duty (LDGV) and two-wheel (TW) vehicles and diesel light-duty vehicles (LDDV). Alkanes (VOC5 + VOC6) also comprise a noticeable molar mass fraction, dominating in two-wheel two-stroke vehicle, heavy-duty vehicle, and charcoal related sources (by 40 %, 47 % and 53 %, respectively).
A considerable IVOC contribution from the emission of heavy-duty vehicles was observed, with IVOCs dominating the VOC6 fraction by 30 % (considering that VOC6 repre-sents 47 % of the total emissions from this source).
Interestingly, and as already discussed in Sect. 3.2.2, monoterpenes (VOC11) comprised 11 %, 13 %, and 22 % contributions in wood fuel burning, heavy-duty vehicle, and waste burning sources, respectively (FW, HDDV, and WB, Figs. 6 and 7b–c). Terpenes in biomass burning sources were
already pointed out as the most significant emitted com-pounds together with furans and aromatics in chamber exper-iments (Koss et al., 2018). Nevertheless, to the extent of our knowledge, their presence in road transport or open waste burning emissions remains unexplored. Regarding OVOCs (VOC22), they were observed in a smaller fraction (less than 7 %) apart from heavy-duty vehicles, which contributes 11 % of the total measured molar mass. Previous studies have re-ported OVOCs as the main fraction in biomass burning emis-sions (Akagi et al., 2011; Gilman et al., 2015; Yokelson et al., 2013). Moreover, Sekimoto and co-workers also anal-ysed the VOC emission profiles depending on the pyroly-sis temperature, showing enrichment of terpenes and non-aromatic oxygenates under high-temperature conditions and an increase in oxygenated aromatics under low-temperature fires (Sekimoto et al., 2018). Comparing the burning-related sources such as wood fuel burning with previous studies, a
Figure 7. Contributions of VOC emission ratios to (a)–(d) the measured molar mass, (e)–(h) OH reactivity, (i)–(l) relative ozone formation potential POCP, and (m)–(p) relative SOA formation potential, aggregated in VOC families. Absolute totals for each source are shown below each pie chart in the respective units.
lower total measured molar mass was observed in our study than those obtained in the US fuels, by factors of 33 to 117 (Gilman et al., 2015). In that work, Gilman and co-workers have shown that OVOCs represent 57 % to 68 % of the total measured molar mass. A different pattern is observed in this study, likely related to the limitation of VOC species mea-surements by the sampling method deployed, which allows the collection of a limited number of aldehydes (> C6) and
other oxygenated compounds as well. Thus, our total molar mass estimation for the sources in Abidjan should be consid-ered a lower limit since additional contributions could be ex-pected from other unknown emitted VOCs, such as OVOCs, alkenes, and nitrogenated VOCs.
Four sources (TW2T, HDDV, WB, and CH) that rep-resent the leading sectors in the region (road transporta-tion, waste burning, and charcoal burning emissions) were
selected, in order to analyse the magnitude of emissions as a function of molar mass and their potential impacts related to African emissions (next section). Figure 7a–d show the relative composition and the total molar mass of the measured VOC (µg m−3) emitted per ppmv of CO. Two-wheel two-stroke vehicles (TW2T) disclosed the high-est molar mass emissions (4680 ± 512 µg m−3ppmv CO−1, Fig. 7a–d). TW2T emissions were 10 to 200 times higher than any other source here analysed, such as heavy-duty vehicle (458 ± 60 µg m−3ppmv CO−1), wood fuel burning (31.5 ± 2.50 µg m−3ppmv CO−1), charcoal burning (43.8 ± 6.37 µg m−3ppmv CO−1), and light-duty vehicle (137.5 ± 20 µg m−3ppmv CO−1) emissions (Fig. 6). While aromatics (VOC13–VOC17) seem to dominate the molar mass fraction for most sources, their contributions are dissimilar, domi-nated by benzene (VOC13) and toluene (VOC14) in
burning-Table 2. Geographical location and characteristics of ambient measurement sites in Abidjan, Côte d’Ivoire. ID Site location Longitude Latitude Activity
AT Adjame 04◦0100400W 05◦2101400N Traffic site. Site near a gbaka public trans-port station; regular traffic jams; obsolete pub-lic transport vehicles (gbaka, shared taxis and buses); human activities
AD Akouédo 03◦5601600W 05◦2101200N Landfill waste burning
Uncontrolled landfill, continuous waste burning of all types of waste
FAC Cocody 03◦5902700W 05◦2004200N Residential.
University residences; electric vehicles; new personal vehicles; use of liquefied petroleum gas (LPG) for cooking
BIN Bingerville 03◦5400700W 05◦2103000N Urban Background
Far from traffic, near to Ebrié Lagoon
CRE Treichville 04◦0001000W 05◦1804100N Green urban area, Near to Ebrié Lagoon; windy ABO Abobo 04◦0401000W 05◦2600800N Traffic + residential
Townhall, near to the big market of Abobo. Old communal taxis and minibuses in a crowded crossroad, human activities
ZI YOP Yopougon 04◦0405200W 05◦2201200N Industrial area
Heavy industries (cement plants) and light in-dustries (agro-inin-dustries, plastic and iron pro-cessing, pharmaceutical and cosmetics indus-tries); heavy goods vehicles, traffic jams KSI Koumassi 03◦5702000W 05◦1705200N Domestic fires + traffic
Residential site mainly influenced by domestic activities, fire-wood, and charcoal; old vehicles. PL Plateau 04◦0102600W 05◦1903300N Traffic/administrative
City centre, crossroad with traffic jams; light-duty vehicles, near the train station
related sources and by xylenes (VOC15) and trimethylben-zenes (VOC16) in traffic-related ones.
3.4 Implications for atmospheric reactivity
The estimation of the impact on atmospheric chemistry of measured VOC emissions is based on the three metrics de-scribed in Sect. 2.3.
3.4.1 OH reactivity of measured VOC emissions Figure 7e–h show the fractional contributions and total VOC–OH reactivity per ppmv of CO for the selected sources. The highest total reactivity is observed from the emissions of two-wheel two-stroke vehicles (TW2T, 488 ± 43 s−1ppmv CO−1), outpacing other sources by factors of 7 to 170. This disclosed difference is related to the high ERs observed for the more reactive species, like terpenes (VOC11) and C8 and C9 aromatics (VOC15 and VOC16,
respectively). Terpenes (VOC11) and aromatics (VOC13– VOC17) altogether are the dominant sink of OH, contribut-ing 47 % to 87 % of the total calculated OH reactivity. Individually, terpenes governed the OH reactivity in open waste burning emissions (76 %) and heavy-duty diesel vehi-cles (60 %) (Fig. 7f–g). When compared with other sources, a singular profile is observed for charcoal burning emis-sions where aldehydes (VOC22, 13 %) and heavier alkanes (VOC6, 28 %) have a higher contribution than in other emis-sion sources. The modest presence of alkenes in the VOC– OH fractional analysis, well-known for their high reactivity effects, is related to the limitation of the sampling method which does not allow the collection of light alkene species. We might expect a high contribution of alkenes adding to the terpene burden.
3.4.2 Ozone formation potential of measured VOC emissions
Overall, the fractional ozone formation distribution is dom-inated by aromatics (VOC13 to VOC17) in all sources, by 38 % to 63 %. Alkanes (VOC6) represent a significant con-tribution in charcoal burning, heavy-duty diesel vehicles, and two-wheel two-stroke vehicles, accounting for 45 %, 28 %, and 26 %, respectively. It is important to note the ter-pene (VOC11) contribution, coming not only from burning sources, but also from the road transportation sector (Fig. 7i– l). Aldehydes (VOC22) are well-known due to their high re-activity in the atmosphere (Atkinson and Arey, 2003; Som-mariva et al., 2011), and some of these species have shown a large impact on ozone formation and chemistry. In our estimation, we can observe the contribution of these com-pounds mainly from diesel (HDDV) and charcoal burning sources (CH). The total potential ozone was calculated for each source, showing most of the time a dominant contribu-tion from two-wheel two-stroke vehicles (80 343 POCP per ppmv CO−1), which is 13, 24, and 150 times higher than the potential impact in ozone formation derived from heavy-duty vehicles, waste burning, and charcoal burning emissions, re-spectively.
3.4.3 SOA formation potential of measured VOC emissions
Figure 7m–p show the composition and mean SOA forma-tion potentials of VOC families emitted by each selected source. As can be expected, charcoal burning has the low-est SOAP values (335 SOAP per ppmv CO−1), compared with two-wheel two-stroke vehicle, heavy-duty vehicle, and waste burning sources, whose SOAPs values are 147, 10, and 9 times greater, respectively. Globally, aromatics (VOC13– VOC17) governed the SOA formation in our estimations, by 72 % to 98 %. Interestingly, terpenes (VOC11) represented a minor contribution in the SOA formation, presenting a SOAP index lower than for aromatic species. It represents approx-imately 20 % of the SOAP for toluene (VOC14). Despite the well-known role of terpenes as SOA precursors (Ait-Helal et al., 2014), the method used here is not able to cor-rectly quantify their contributions to SOA formation. The dif-ferences between SOAP values and measured aerosol yield were already pointed out by Gilman and co-authors (Gilman et al., 2015), who performed some sensitivity tests in order to harmonize SOAP and aerosol yields. We performed the same analysis here, adjusting the SOAP terpene values to be 10 % higher. The results in total SOAP per ppmv of CO did not show considerable increases in any of the sources, ex-panding the total SOAP up to 1 %. Similar results were ob-served for fractional distribution, so that the changes in ter-pene SOAPs (VOC11) did not show any substantial change in the VOC contribution for SOA formation. These findings are in agreement with those identified in the study of Gilman
et al. (2015), suggesting an underestimation in the fractional contribution of terpenes to the potential formation of organic aerosols over the southern West African region.
3.5 Quantification of VOC emissions
Anthropogenic VOC emissions were quantified by consider-ing the complete VOC dataset, which includes the 56 com-pounds analysed, aldehydes, IVOCs and terpene species. Mean residential emissions are also integrated and compared with those from the EDGAR v4.3.2 inventory. Additionally, we incorporate the residential and road transport profiles pro-vided by the MACCity inventory (Granier et al., 2011), avail-able in the ECCAD-GEIA database (http://eccad.aeris-data. fr, last access: 28 May 2018). The main differences between both global inventories are related to the speciation level of VOC families. MACCity considers all the aromatics in the same VOC group; thus, we provide here the sum of VOC13 to VOC17 families (Table S2) to compare it with the aromat-ics group from our quantification.
Figure 8 exhibits the speciated emissions calculated for Côte d’Ivoire along with those provided by the two emis-sion inventories. Globally, the discrepancies already high-lighted in the previous analysis are exacerbated by introduc-ing the complete VOC database. Calculated residential emis-sions are greater by factors of 14 and 43 when compared with EDGAR v4.3.2 and MACCity, respectively (Fig. 8a). In terms of composition, the main differences observed are re-lated to the VOC22 group (aldehydes). This group discloses a higher contribution by a factor of 5 in the EDGAR inven-tory, accounting for 64 % of the total emission. There is also a disparity in the contribution from aromatics (sum of VOC13 to VOC17) and alkenes (VOC12), which reveals a more sub-stantial influence in the MACCity profile (58 % and 22 %, respectively) (Fig. 8a). This disparity could be related to the few VOC species that were analysed for the VOC12 group in our study. Nevertheless, aromatics dominate the fractional contribution in our calculated emissions (39 %), especially toluene (VOC14) and C8 aromatics (VOC15) (11 % and
10 %, respectively). Alkanes (> VOC6 alkanes) show a more significant contribution in the residential profile, in which IVOCs contribute 20 % of the total calculated alkanes ob-tained by our estimations.
Regarding the road transportation sector, total calculated emissions are higher than the global inventories by factors of 100 and 160 for EDGAR and MACCity, respectively (Fig. 8a). A moderate agreement is observed with speciation (Fig. 8b). Aromatics and alkanes are the main contributions for all profiles in different proportions. Our estimates report the most significant contributions in C8aromatics (VOC15),
C9 aromatics (VOC16), and toluene (VOC14), with 25 %,
14 %, and 10 % contributions, respectively (Figs. 8c and 9). In comparison, EDGAR v4.3.2 shows a contribution of 9 % for VOC15, 3.5 % for VOC16, and 13 % for VOC14 (Fig. 9). Road transport profiles also reproduce the anomalies in the
Figure 8. Comparison of VOC emission profiles for Côte d’Ivoire from the emissions estimated from the measurements of this study and the EDGAR v4.3.2 (Huang et al., 2017) and MACCity inven-tories (Granier et al., 2011). The profile analysis integrates road transportation and residential sectors based on the sector activity for 2012. (a) Absolute emissions, in Tg yr−1, (b) relative mass contri-bution, and (c) relative mass reactivity, considering 100 Tg of emis-sions weighted by the kOHreaction rate calculated for each VOC
family.
VOC12 (alkene) contribution observed in the residential sec-tor, presenting greater emissions in the global inventories. The comparison between both inventories also depicted con-siderable discrepancies of a factor of 3.
A similar profile is observed for heavier alkanes (VOC6) which present an analogous contribution between our estima-tion and EDGAR emissions (34 % and 37 %, respectively; Fig. 8b). Nevertheless, the alkane (VOC5 + VOC6) contri-bution in the MACCity profiles prevails over road transport emissions, accounting for 62 % of the total emissions.
Interestingly, terpenes and isoprene emissions can be de-noted in both sectors in the Côte d’Ivoire calculated emis-sions (VOC11 and VOC10). Despite the reduced contribu-tion of these species (9 % in residential and 4 % in road trans-port), the underestimation of them in the emissions from anthropogenic sources could have consequences for atmo-spheric chemistry. Since the reactivity is specific for each VOC, the inaccuracies in the speciation could also have im-plications for the estimation of their impacts. Specifically for terpenes (VOC11), their high contribution in the kOH
reactiv-ity can be noted, accounting for 42 % in the residential sector and 28 % in road transport sector reactivities (Fig. 8c). Even though the total OH reactivity in all profiles is rather simi-lar, the alkene fraction in this study is not well-represented, which could increase the contribution in terms of reactivity.
Figure 9 also displays the residential and road transporta-tion profiles obtained from Côte d’Ivoire, compared with EDGAR v4.3.2 profiles for Europe. Noticeably in our es-timations, road transport and residential sectors presented comparable total emissions, whereas those from the EDGAR inventory were different by a factor of 8 (86.1 versus 12.1 Gg yr−1, respectively). Similar disagreements are also observed when comparing EDGAR total emissions for Eu-rope with Côte d’Ivoire, where the former presents larger emissions (198 versus 86 and 433 versus 12 Gg yr−1, respec-tively). We highlight here the substantial differences in total emissions, outpacing those estimated for Europe by a factor of 3 for road transport and by a factor of 6 for the residential sector (433 and 198 Gg yr−1, respectively).
The lack of measurements and source profile data in Africa was previously pointed out in the development of the EDGAR inventory, which led to considering the priority of this region for future inventory improvements (Huang et al., 2017). Even though our VOC database is not extensive for all the species emitted by the sources analysed, the incorpo-ration of new VOC species reinforces the usefulness of in situmeasurements under real conditions to derive realistic emission factors and subsequent estimates of representative emission profiles.
3.6 Anthropogenic emissions of terpenes, IVOCs, and aldehydes in southern West Africa
As previously highlighted, terpenes commonly emitted by biogenic sources were observed in the emissions from an-thropogenic sources. Global emission inventories wholly ne-glect these emissions; however, they could have consider-able effects on the atmospheric chemical processing by pro-ducing secondary pollutants in the atmosphere. Figure 10a shows the fractional distribution of terpenes in several anal-ysed emission sources. The main contributions are associ-ated with the emissions from waste burning (47 %), two-wheel vehicle (20 %), wood fuel burning (17 %) and char-coal making (14 %) sources. The total annual emissions es-timated for these compounds, which represent 334 Gg yr−1
Figure 9. VOC emission profiles considering all the VOC families calculated from the measurements of our study and compared with the global EDGAR v4.3.2 inventory (Huang et al., 2017). The comparison integrates road transportation (RT) and residential (Resid) sectors in Côte d’Ivoire and Europe for the year 2012. Absolute emissions are expressed in Gg yr−1for each VOC group.
Figure 10. Total estimated emissions and relative distributions in the anthropogenic sources measured in Côte d’Ivoire for the VOC family. (a) Terpenes. (b) IVOCs. (c) Aldehydes (* for aldehyde species > C6).
and 11 % of the total emissions, cannot be neglected when compared with the emission of other well-known anthro-pogenic VOCs, i.e. C9aromatics. Evaluating the distribution
of terpene species among the emission sources permits a dif-ferent pattern to be noted (Fig. 11). While terpene emissions from road transport are mainly dominated by α-ocimene and α-terpinolene, limonene and isoprene are mainly emitted by wood-burning sources. The main wood types burned in Côte d’Ivoire are Hevea (Hevea brasiliensis) and Iroko (Milicia excelsa), which are widely used in urban domestic fires for cooking, heating, and other services (Keita et al., 2018). In our study, we only present the results obtained from He-vea, a tropical African hardwood, characterized as a species that emits monoterpenes (Bracho-Nunez et al., 2013; Wang et al., 2007). The principal monoterpene compounds natu-rally emitted by Hevea species are sabinene, limonene, and α-pinene (Bracho-Nunez et al., 2013). The isoprene emis-sions from non-isoprene emitting species were already ob-served in biomass burning studies, which indicates that
iso-prene is formed during the combustion process (Hatch et al., 2015).
As can be noted in Fig. 11, isoprene emissions are also impacted by vehicles, mainly two-wheel sources, and camphene and β-pinene emissions by heavy-duty vehicle sources. The anthropogenic sources of isoprene have been documented in urban areas, mainly associated with traffic emissions (Borbon et al., 2001; von Schneidemesser et al., 2011). However, to the best of our knowledge, no previous studies have ever analysed the presence of monoterpenes from road transportation sources. α-pinene and β-pinene emissions are dominated by charcoal burning fires, which also contribute in some fraction to the emissions of isoprene and limonene. In contrast, charcoal making emissions are dominated by γ -terpinene and isoprene. The results from biomass burning sources provided here were obtained from non-controlled experiments, which did not allow the evalu-ation of differences between the emissions from each com-bustion phase (pyrolysis, flaming, and smouldering). Further
Figure 11. Distribution of monoterpenes and isoprene in the emis-sion sources measured in Abidjan. The values represent the percent-age of each terpenoid over the total emission estimated for these species.
investigation is needed in order to develop a better under-standing of these differences and to characterize the different combustion phases.
VOCs of intermediate volatility are suspected to be effi-cient precursors of SOA (Seinfeld and Pandis, 2006, and ref-erences therein). However, as was discussed in Sect. 3.4.3, our method was not able to resolve the differences between VOC families, and most SOAP was assigned to aromatic compounds (up to 98 %). Figure 10b reports the fractional contribution and total emissions of IVOCs. Charcoal mak-ing, wood fuel burnmak-ing, heavy-duty diesel vehicles, and two-wheel vehicles represent the primary sources of these com-pounds, accounting for 58 %, 15 %, 12 %, and 11 % of the total, respectively. Despite their lower emissions compared with aromatics or terpenes, IVOCs are estimated to account for 80 Gg yr−1of emissions in Côte d’Ivoire. A recent study observed that fine particles in Abidjan are 3 times higher than the World Health Organization recommended concentrations (Djossou et al., 2018). Hence, a better understanding of the aerosol precursors and formation processes is essential for the later reduction of their concentrations in the urban atmo-sphere.
Oxygenated compounds were previously indicated as essential species in the emissions from burning sources (Gilman et al., 2015; Hatch et al., 2015; Koss et al., 2018; Wiedinmyer et al., 2014). In addition, oxygenated com-pounds like non-aromatics were dominant in the burning emission sources, including a range of functional groups, of which alcohols and carbonyls were the most abundant (Koss et al., 2018; Stockwell et al., 2015). Figure 10c shows that aldehyde emissions are mainly governed by charcoal mak-ing, two-wheel vehicle, and wood burning sources (Fig. 10c). In our study the quantified aldehydes represent only 5.5 % of the total emissions of the country (170 Gg yr−1). However, they can be essential compounds concerning reactivity and ozone formation. Hence, further analysis of oxygenated
pounds together with furans and other nitro-oxygenated com-pounds needs to be addressed in future campaigns, in order not only to improve the quantification of these compounds, but also to provide a better identification of the African trac-ers from biomass burning processes.
4 Summary and conclusions
This study reports for the first time a chemically detailed range of VOCs, including C5–C16 alkanes, monoterpenes,
alkenes, aromatics, and carbonyl compounds by using sor-bent tubes during an intensive field campaign in Abidjan, southern West Africa. We present here an original dataset in-tegrating main emission sources and ambient measurements from nine representative sites and covering the urban spatial distribution of VOCs in Abidjan. The spatial distribution and composition of VOC in ambient air in Abidjan reveals the ef-fect of local burning and traffic emissions. The highest con-centrations were observed near domestic fires, landfill waste fires, and traffic sites, in agreement with the results reported in previous studies, when gas-phase and aerosol pollutants were measured.
The calculation of emission ratios is an important met-ric to evaluate the estimates provided by global emission inventories. Emission ratios from region-specific emission sources were established here and later used for the anal-ysis of fractional molar mass contribution and the estima-tion of potential VOC OH reactivity, ozone, and secondary organic aerosol formation. The distribution of VOC emis-sions (magnitude and composition) was different for each evaluated source. Two-wheel and heavy-duty vehicle sources presented the most significant total molar mass emissions, while charcoal burning was the lowest. The sources related to burning processes, such as waste and wood burning, also presented significant contribution to VOC emissions. These sources represent common activities present in Abidjan and might contribute a large quantity of VOC emissions to the southern West African region.
Regarding VOC speciation, molar mass contributions were mostly dominated by aromatic and alkane compounds. Since few alkene species were quantified, aromatics ruled both ozone and SOA formation potential. However, the SOA metrics applied here were not able to accurately analyse the other important SOA precursors’ contribution, such as monoterpenes. Nevertheless, monoterpenes can contribute significantly to VOC OH reactivity from some sources like waste burning, and the alkane species can significantly con-tribute to the total reactivity.
In order to estimate the magnitude of VOC emissions in Côte d’Ivoire, emission factors were determined from the in situ VOC database. Road transportation and residential profiles were obtained and compared with those reported in global emission inventories (MACCity and EDGAR). Our results revealed a discrepancy of up to factors of 43 and 160