Allocation of Airspace Cutouts to Enable Procedurally
Separated Small Aircraft Operations in Terminal Areas
The MIT Faculty has made this article openly available. Please share
how this access benefits you. Your story matters.
Citation
Vascik, Parker D. and R. John Hansman. "Allocation of Airspace
Cutouts to Enable Procedurally Separated Small Aircraft Operations
in Terminal Areas." AIAA AVIATION 2020 FORUM, American Institute
of Aeronautics and Astronautics, June 2020. © 2020 American
Institute of Aeronautics and Astronautics
As Published
http://dx.doi.org/10.2514/6.2020-2905;https://
hdl.handle.net/1721.1/125990
Publisher
American Institute of Aeronautics and Astronautics
Version
Author's final manuscript
Citable link
https://hdl.handle.net/1721.1/130557
Terms of Use
Creative Commons Attribution-Noncommercial-Share Alike
ALLOCATION OF AIRSPACE CUTOUTS TO ENABLE
PROCEDURALLY SEPARATED SMALL AIRCRAFT
OPERATIONS IN TERMINAL AREAS
Parker D. Vascik and R. John Hansman
This report presents research originally published under the same title at the 20
thAIAA Aviation
Technology, Integration, and Operations Conference (conducted virtually). Citations should be
made to the original work with DOI:
https://doi.org/10.2514/6.2020-2905
Report No. ICAT-2020-08
June 2020
MIT International Center for Air Transportation (ICAT)
Department of Aeronautics & Astronautics
Massachusetts Institute of Technology
Cambridge, MA 02139 USA
1 Ph.D. Candidate, MIT, 77 Massachusetts Avenue, 33-115, Student Member, AIAA.
2 Professor of Aeronautics and Astronautics, MIT, 77 Massachusetts Avenue, 33-303, AIAA Fellow.
Allocation of Airspace Cutouts to Enable Procedurally
Separated Small Aircraft Operations in Terminal Areas
Parker D. Vascik1 and R. John Hansman2
Massachusetts Institute of Technology, Cambridge, Massachusetts, 02139
The current air traffic control (ATC) system is human-centric and voice-based. As a result, separation minima, controller workload, and radio frequency limitations may restrict the number of emerging unmanned aircraft system (UAS) or urban air mobility (UAM) operations that can occur within congested airspace. Limited ATC capacity will be especially impactful for UAS or UAM operations in proximity to large airports. One concept to reduce ATC limitations is to re-allocate airspace to develop procedurally separated corridors or regions where UAS and UAM aircraft may operate without receiving conventional ATC services. The creation of such “airspace cutouts” currently enables hundreds of daily small aircraft and helicopter operations in major U.S. cities without contributing to ATC workload. This paper develops an approach to analytically identify terminal airspace that is procedurally segregated from large aircraft operations and may be appropriate for new airspace cutouts. The magnitude of the benefit of allocating airspace in this manner is demonstrated at three major airports and in the 34 largest metropolitan areas of the United States.
I. Introduction
MERGING unmanned aircraft system (UAS) and urban air mobility (UAM) concepts, jointly referred to as advanced air mobility (AAM) by NASA, are anticipated to introduce a volume of new flight operations that is orders of magnitude beyond the number of flights currently managed by the air traffic control (ATC) system [1,2]. Without a corresponding increase in ATC capacity, the scale at which AAM could operate may be constrained by controller workload capacity limits, radio frequency saturation thresholds, and/or minimum aircraft separation requirements in the airspace where ATC services must be provided [3,4]. While the vast majority of low altitude airspace where these new users will operate does not require ATC during good weather, the largest anticipated markets for AAM are within metropolitan areas and in proximity to large airports where ATC services are required [5,6].
A promising approach to mitigate ATC restrictions for AAM scaling is the re-allocation of airspace to develop “cutout” volumes that are procedurally separated from conventional, large aircraft operations. By designing the cutout such that the minimum separation requirements are met between the boundaries of the cutout airspace and the flight of large aircraft, simultaneous and non-interfering AAM flights could occur within the cutout. Flights within the cutout would not receive ATC services or generate additional workload for air traffic controllers. The management of air traffic within the cutout could initially be handled through special flight rules and ultimately by automated systems such as NASA UAS Traffic Management (UTM) [7] or SESAR U-Space [8].
Finally, airspace cutouts have a number of characteristics that may enable their immediate implementation: existing cutouts already support general aviation flights within major U.S. cities; the potential location of cutouts aligns with initial markets for AAM; and near-term cutout implementation does not require significant new technology, policy, or workforce developments.
This paper introduces an approach to analytically identify terminal airspace that is procedurally separated from large aircraft operations and may be appropriate for airspace cutouts. The approach is demonstrated at three major airports and then applied to the airspace above the 34 largest U.S. metropolitan areas. Through these analyses, three research questions are addressed:
1. How significantly may ATC capacity constrain AAM operations?
2. How effectively may airspace cutouts mitigate ATC restrictions to AAM scaling?
3. How do separation requirements influence the effectiveness of the airspace cutout concept?
The paper is organized as follows. Section II provides background on ATC for AAM including an introduction to the concept of airspace cutouts. Section III is an overview of the methodology. Section IV presents analysis of airspace cutouts at three major U.S. airports. Section V expands the analysis of airspace cutouts to the 34 largest U.S. metropolitan areas. Finally, Section VI summarizes the findings of the paper and introduces future work.
II. Background
Enabled by miniaturized electric components and improving battery systems, the UAS industry grew over the past decade from a niche military market of highly capable, large aircraft to a current fleet of over 1.7 million aircraft in the U.S. primarily composed of vehicles weighing 55 lbs or less [9]. Borne out of an interest to leverage advancements in aircraft electrification and automation for passenger or bulk cargo payloads, the UAM industry is anticipated to conduct thousands to tens of thousands of daily flights in major metropolitan areas using 1-5 passenger aircraft [5,6]. The FAA currently provides ATC services to approximately 44,000 flight per day1 through a human-centric and
voice-based architecture where each flight communicates verbally with one or more controllers by radio. Expanding the capacity of the current ATC system is not anticipated to be a feasible approach to support scaled AAM operations due to the fundamental limits of radio communications and practical limits of controller staffing/workload [1,10,11]. The ICAO UTM framework [2], NASA UTM project [7], and SESAR U-Space concept [8] each propose the automation of controller responsibilities and aircraft-to-controller communications as long-term means to address this forthcoming ATC capacity challenge. The concept behind each of these programs is to equip AAM aircraft with new communication, navigation, and surveillance technologies that interface with an on-board autopilot, coordinate directly with other aircraft, and are networked to airspace service providers to enable safe and efficient flight, all with decreased human interaction (if any).
UTM concepts face a number of hurdles to achieve near-term, widespread deployment for AAM operations. Although forms of automated ATC have been in development for nearly 50 years (“Electronic Flight Rules” in the 1970s [12], “Free Flight” in the 1990s [13], and UTM in the 2010s), automation in ATC is currently limited to a few decision support tools for controllers and the implementation of data-link communications for clearance deliveries. The lack of adoption of ATC automation technologies may be attributed, at least in part, to issues concerning system safety, network stability, workforce resistance, and burdensome equipage costs (especially for legacy aircraft),
While UTM systems currently under development are beginning to provide initial operating capabilities for small UAS operations in low-risk areas [14], a complementary, near-term approach is desired that mitigates ATC restrictions for high-payload AAM operations and facilitates the introduction of improving UTM capabilities. The development of procedurally separated airspace cutouts is a promising candidate.
A. The Concept of Procedurally Separated Airspace Cutouts
Fig. 1 notionally displays the concept of airspace cutouts from terminal-area controlled airspace. AAM operations that occur outside terminal airspace (designated as the dashed black line in Fig. 1) under visual flight rules (VFR) are not required to receive ATC services. AAM flights that enter the terminal airspace boundary are managed by controllers and may be scale-constrained by controller workload or radio communications limitations. However, only AAM flights that pass within the red region of Fig. 1 would potentially experience a loss of separation to conventional aircraft and require active separation management (i.e., time-based separation) by controllers.
AAM flights that occur only within the blue region of Fig. 1 remain procedurally separated from conventional flight operations in that the required separation minima are never violated. The blue region therefore represents an area where one or more airspace cutouts could potentially support simultaneous and independent AAM operations.
Airspace cutouts may provide numerous advantages for the near-term integration of high-volume AAM: • cutouts enable AAM operations without additional workload or equipment for conventional ATC, • cutouts enable AAM access to some terminal-area controlled airspace co-located with areas of demand, • special operating rules, aircraft equipage requirements, and/or new UTM systems may be implemented
in cutouts as traffic levels increase and technologies mature, and
• the potential to quickly develop cutouts for VFR AAM operations based upon existing precedent.
Fig. 1 Notional opportunity for airspace cutouts (blue region) from terminal airspace.
Two concepts for airspace cutouts were considered in this study: static cutouts and dynamic cutouts.
A static cutout, such as the New York or Los Angeles special flight rules areas (SFRAs), is always active and provides procedural separation to nearby airport operations independent of their traffic flow pattern. Static cutouts are advantageous in that an AAM aircraft will always have access to the cutouts, weather permitting (cutouts may initially be limited to support VFR operations), and do not require new technologies or operational concepts to implement.
A dynamic cutout only provides procedural separation to airport operations for a specific traffic flow pattern. Conceptually, air traffic controllers activate a pre-defined set of dynamic cutouts for a given flow pattern, and then close that set of cutouts and open a different set when the airport changes flow pattern. The benefit of dynamic cutouts is they may enable AAM to access additional airspace and surface areas that are not procedurally separated from all arrival or departure procedures, especially those that are infrequently used. However, dynamic airspace allocation adds complexity as the availability of each cutout must be effectively communicated to all aircraft and controllers must have the ability to ensure the cutouts are vacated in a specified amount of time when an airport changes its flow pattern [15].
Dynamic airspace allocation has a number of precedents in the current ATC system. First, most special use airspace (SUA) is a form of dynamic airspace. SUA is dynamically activated and deactivated around the schedules of sporting events, VIP movements, military exercises, or other activities. Second, TRACON’s routinely change their sector definitions in order to maximize airspace capacity and reduce controller workload when airports shift their flow pattern [16]. Third, dynamic airspace management was proposed as an element of the Next Generation Air Transportation System as a means to adjust sector boundaries in real-time in response to weather or heavy traffic [17].
B. Current Examples of Airspace Cutouts in the U.S.
Numerous airspace cutouts currently exist in areas of dense general aviation (GA) air traffic. These cutouts provide insight into how the concept could support emerging AAM operations. Airspace cutouts of particular interest are located in New York, Los Angeles, San Diego, and San Francisco.
Fig. 2 displays two different implementations of airspace cutouts in New York. First, the Hudson River and East River SFRAs (tinted pink) are volumes of airspace that were cut out from the LaGuardia Class B surface-level (SFC) airspace to allow VFR helicopter and small aircraft operations. These SFRAs have supported over 60,000 VFR sightseeing helicopter operations per year, plus many additional thousands of GA and charter flights. Flights within the SFRAs occur through pilot self-separation and special operating rules, but without ATC services or contributions to controller workload.
Second, the blue cutout west of LaGuardia in Fig. 2 provides access to the Landmark Plaza Heliport through a corridor of uncontrolled airspace that reaches up to 1200 ft mean sea level (MSL). Unlike the two SFRAs to the east of LaGuardia, this cutout volume does not have special operating rules or requirements.
Developing airspace cutouts does not necessitate a ground-up redesign of the entire controlled airspace (as conducted by the FAA Metroplex Project in San Francisco [18]). Rather, airspace that is procedurally separated from airport operations may be identified and cut out as an incremental airspace design update.
An example of this incremental cutout design process is the FAA low altitude authorization and notification capability (LAANC) for small UAS. Fig. 3 displays the LAANC volumes defined within the surface level Class B terminal airspace for Boston Logan International Airport. The LAANC volumes are not static cutouts from the Class B airspace like the examples in Fig. 2, but rather are areas where the FAA has authorized third party airspace service providers to dynamically manage the airspace in lieu of FAA controllers.
C. Separation Minima
Separation minima limit how closely aircraft may operate to one another or obstacles. Separation minima constrain AAM operational scale by limiting the density of flights in an airspace and/or the throughput of an airport or vertiport. Aircraft separation standards are derived from the need to prevent aircraft conflicts with other aircraft or obstacles and prevent wake vortex encounters (i.e., flight through air disturbed by a previous aircraft).
Considering these goals, the amount of separation required in a given situation is dependent upon the type (i.e., class) of airspace, the mass of the aircraft, the equipage of the aircraft and controllers, the weather conditions, and the aircraft’s classification (i.e., helicopter, fixed-wing, or other).
Separation is generally fulfilled in one of three ways:
1. Radar Separation: controllers actively manage separation using radar tracking and voice communications. 2. Non-Radar Separation: controllers passively manage separation by assigning aircraft to non-interfering
routes or airspace sterilized of other aircraft.
3. Visual Separation: separation is provided by a controller having sight of both aircraft, or separation is provided by the pilot of one aircraft accepting self-separation responsibility from the other aircraft.
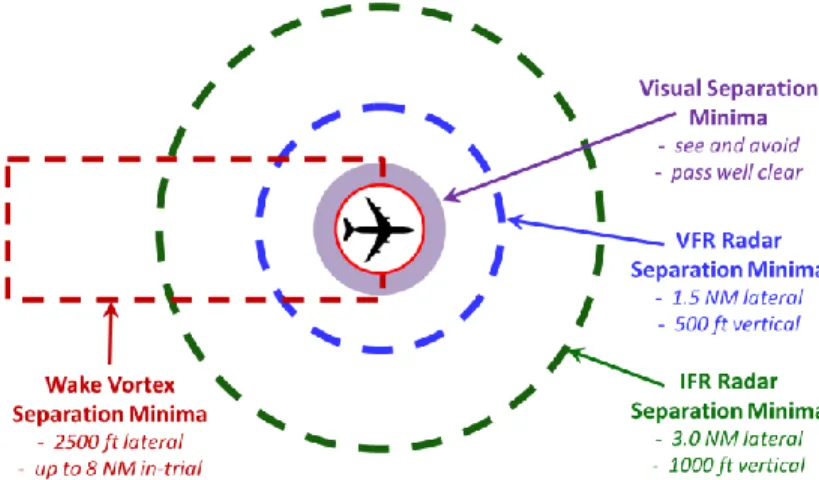
Fig. 4 presents the relationship between the various separation minima that are frequently utilized in terminal airspace. The separation required is dependent upon the weather conditions, the classification of the aircraft (helicopter vs. fixed-wing) or operator (Part 91 vs Part 1352), and the CNS capabilities of the aircraft and controller. The primary
requirements for applying each type of separation are listed in Fig. 4 and described in greater detail in chapter 6 of Ref. [18]. The analysis conducted in this paper considered the use of wake vortex, VFR radar, and instrument flight rule (IFR) radar separation minima to develop procedurally separated airspace cutouts.
2 In reference to parts of Title 14 of the Code of Federal Regulations. Fig. 3 LAANC volumes for UAS operations at
Boston Logan International Airport. Image © Google, 2019.
Fig. 2 Example airspace cutouts surrounding LaGuardia airport in New York.
Hudson River SFRA
East River SFRA
Landmark
Plaza Heliport
LaGuardia
Airport
1200’ MSL Airspace FloorSFC-level
Controlled
Airspace
500’ MSL Airspace FloorFig. 4 Separation standards that may apply to terminal-area AAM operations. D. Controller Workload
Aircraft may not operate in class B, C, or D airspace without first communicating with a controller. Controllers primarily communicate with pilots through the use of very high frequency radios where each controller uses a separate radio frequency. AAM access to vertiports and flight routes within terminal airspace may therefore be constrained either if a controller is too busy to support additional flights (i.e., their workload is saturated) or if the radio frequency is too congested for the pilot to effectively communicate with the controller (i.e., their radio frequency is congestion).
Increased controller staffing is one approach to support near-term, low-volume AAM operations. In 1960, both Midway and O’Hare airports supported roughly 135 helicopter operations per day through a dedicated helicopter controller position [19]. Similarly, the Boston Logan Airport currently opens a separate controller position when there are approximately three or more simultaneous helicopter or GA operations in its airspace.3 For ATC services at
airports that primarily support GA flights, teams of two controllers may support as many as 80 to 120 VFR operations per hour for fixed-wing aircraft, and a single controller may be capable of upwards of 100 VFR helicopter operations per hour.4 However, with AAM traffic scale anticipated to surpass thousands of metro-area operations per hour in the
2030s, increased staffing is not anticipated as a sustainable solution to ATC congestion.
While the automation of controller tasks through a UTM system is a medium to long-term means to reduce controller workload and manage scaled AAM networks in terminal areas, procedurally separated airspace cutouts are a potential near-term means to relieve controller responsibilities to provide separation, communicate with, and monitor flight operations contained within the cutouts. Cutouts, similar to those near LaGuardia in Fig. 2 may therefore support high-volume AAM operations in terminal areas without any contribution to controller workload.
III. Methodology
This paper develops an approach to analytically identify airspace that is procedurally segregated from large aircraft operations at airports; such airspace may be appropriate as a cutout for AAM flights. The approach was applied to two studies of increasing complexity. First, in Section IV static and dynamic cutout opportunities were evaluated at three major airports. Second, in Section V static cutout opportunities were evaluated for all airports in the 34 largest metropolitan areas in the US.
The first step of the approach was to statistically characterize airspace usage by large transport and regional aircraft (i.e., commercial flights with >20 passengers). It was assumed that flights by these large aircraft will not be adjusted to accommodate AAM operations. To assess airspace usage by these aircraft, radar trajectory data recorded by the FAA Airport Surface Detection Equipment Model X (ASDE-X) were evaluated from April 2015 to March 2016. Of the initial year-long data set, approximately 180 days had a full 24 hours of flight tracking records; days with incomplete radar data were excluded. “Containment boundaries” were defined to statistically represent the airspace that was flown in by 99.5 percent aircraft operations through the methodology introduced in Ref. [20].
3 Based on interviews with the Boston Logan Airport Tower Manager in 2018. 4 Based on interviews with two GA airport controllers in New England in 2019.
Various separation minima were then applied to the containment boundaries in order to identify airspace located beyond the separation minima that remained procedurally separated from the containment boundaries; this airspace was considered to be potential cutouts. Cutouts were developed for three separation minima (IFR radar, VFR radar, and wake vortex minima) to represent different degrees of procedural separation. A viable cutout was only defined where an AAM aircraft could operate within the cutout at a minimum flight altitude of 300 ft above ground level (AGL). Three-hundred ft is the Part 135 minimum regulatory cruise altitude for passenger-carrying helicopter operations in congested areas.
In Section IV, static and dynamic cutouts were identified in the terminal airspace surrounding Atlanta (ATL), San Francisco (SFO), and Boston (BOS) international airports through this statistical approach. The percentage of the surface-level terminal airspace that AAM could potentially access through the cutouts was calculated.
In Section V, the cutout identification approach was applied to the 34 largest U.S. metropolitan areas. All controlled airspace and SUA within each metropolitan area was modeled. The percent of the population and long-duration commuters (proxies for potential customer demand) that resided within an inaccessible airspace was calculated. A representative containment boundary was applied to qualifying airports (by traffic level), and airspace cutouts were identified for various separation minima. The magnitude of the increase in customer demand due to the cutouts was determined for each type of cutout; two other ATC concept of operations (ConOps) scenarios were considered in addition to airspace cutouts. Further detail on the assumptions and methodology are provided in Section V.
IV. Evaluation of Airspace Cutout Opportunities at Three Major Airports
SFO, ATL, and BOS exhibit different contextual factors anticipated to influence the feasibility of airspace cutouts from their terminal airspace. These factors include runway configuration, the proximity of flight obstructions to the airport, the proximity of the airport to populated regions, and the type of approach procedures in use.
A. Airspace Cutout Design Assumptions
Three types of airspace cutouts were modeled for each airport:
1. IFR Cutout: airspace that was ≥ 3.0 NM laterally and/or ≥ 1000 ft vertically from the containment boundaries and at least 300 ft AGL was defined as an IFR cutouts. Although aircraft cannot currently operate under IFR in an airspace cutout, this scenario was evaluated as future navigation and automation capabilities could enable IFR operations.
2. VFR Cutout: airspace that was ≥ 1.5 NM laterally and/or ≥ 500 ft vertically from the containment boundaries and at least 300 ft AGL. This airspace was procedurally separated by the VFR radar separation minima. 3. Lateral Wake Vortex Cutout: although current flights are not authorized within the VFR radar separation
minima without providing visual separation to conventional operations, a future scenario was modeled where the cutout was defined for the wake vortex lateral separation minima of ≥ 2500 ft. The vertical separation requirement was assumed to remain 500 ft with a minimum altitude of at least 300 ft AGL.
The modeling assumptions and scenarios above were intended to provide a first-pass estimate of the potential benefit of airspace cutouts for AAM. Future research should consider the sensitivity of cutouts to more complex minimum flight altitudes, obstacle separation requirements, and flight below 300 ft AGL for approach or departure.
B. Airspace Cutout Potential Near Atlanta International Airport
Fig. 5 displays a planform view of the regions surrounding ATL where static airspace cutouts could potentially be developed with the IFR, VFR, and wake vortex separation requirements. In Fig. 5, the ATL runways are indicated at the center of the diagram as black bars. Containment boundaries are indicated in purple and extend from the ends of the runways; the containment boundaries display the lateral extent of airspace used by 99.5% of transport and regional jet operations. The surface-level controlled airspace surrounding ATL is notated with a black dashed line.
The airspace that could potentially be allocated to an IFR cutout is indicated with a green tint in Fig. 5. The airspace that could be potentially allocated to a VFR cutout is tinted blue, and the airspace for the wake vortex cutout is tinted red. The area within the solid red line represents a region within 2500 ft laterally and less than 500 ft vertically of the containment boundaries where none of the cutouts could provide procedural separation. Obstacle heights from the FAA Digital Obstacle File5 and are presented as feet above airport elevation for reference.
Fig. 5 Static airspace cutout opportunity at ATL.
Due to the location of ATL eight miles south of the Atlanta city center, AAM flights may operate in the city center beyond the controlled airspace boundary without a cutout. However, airspace allocation to cutouts could provide access to the communities south of the city center that are currently within ATL’s controlled airspace.
Tinted green in Fig. 5 and quantified in Table 1, 16% of the ATL surface-level controlled airspace may be re-allocated to a static IFR cutout. More significantly, static VFR cutouts inside the blue region could enable AAM access 73% of the ATL surface-level controlled airspace. Access to the red region through a wake vortex cutout would support access to an additional 12% of the controlled airspace compared to the VFR cutouts. Table 1 summarizes the percentage of controlled airspace at all three airports that could potentially be released to AAM operations through the three cutout scenarios in a dynamic or static implementation.
Table 1. Potential impact of airspace cutouts at three airports.
The static cutout volumes presented in Fig. 5 are applicable to either of ATL’s two traffic flow patterns. Fig. 6 presents the dynamic cutout opportunities when ATL is in a west traffic flow pattern. ATL operates in a west flow pattern 64% of the year based on reports from the FAA Aviation System Performance Metrics.
Fig. 6 Dynamic airspace cutout opportunity at ATL in a west flow pattern (64% frequency).
A dynamic IFR cutout increases potential access to nearly 40% of ATL’s controlled airspace (compared to 16% in the static case) without ATC interaction. The majority of this additional benefit results from under flight of the conventional aircraft departures to the west of the airport. The benefit of dynamic VFR and wake vortex cutouts compared to static cutouts at ATL is less significant and only provides an additional 7% and 4% of access, respectively. The potential benefits from dynamic cutouts in an east flow pattern are of a similar magnitude as displayed in the second row of Table 1, however the actual location of the cutouts is changed to the east side of ATL.
C. Airspace Cutout Potential Near Boston International Airport
As a result of BOS’ location two miles east of the Boston city center, its class B airspace covers the majority of the metropolitan core. Furthermore, due to frequently changing wind patterns, BOS operates in four flow patterns that distribute arrivals and departures throughout the controlled airspace. Fig. 7 displays cutout opportunities for BOS in northwest flow, the most frequent pattern.
Fig. 7 Dynamic airspace cutout opportunity at BOS in northwest flow (37% frequency).
Despite a larger dispersion of arriving and departing flights at BOS compared to ATL, dynamic IFR and VFR cutouts for the northwest flow pattern may support AAM access to as much as 50% and 89% of the BOS surface-level controlled airspace without ATC interaction, respectively. However, the large number of surface obstacles protruding
into the airspace west of the airport in Fig. 7 may challenge the feasibility of AAM flight within the cutouts. Obstacles in the region routinely reach up to 700 ft AGL. Due to obstacle separation criteria, AAM aircraft may not be able to access the city center at a cruising altitude of 300 ft AGL as modeled, especially under IFR.
Another complicating aspect for the airspace cutout concept at BOS is the frequency with which the airport changes flow pattern. It is not uncommon for the airport to operate in all four flow patterns over the course of a single day. The crossing runways at BOS result in substantially different cutout locations between the flow patterns. Fig. 8 displays the change in cutout design for three other flow patterns at BOS (obstacle plotting removed for clarity).
Southwest Flow – 28% annual usage Southeast Flow – 17% annual usage
Northeast Flow – 18% annual usage
Fig. 8 Airspace cutout opportunities at BOS for three additional traffic flow patterns.
Potential AAM access through IFR static cutouts in Boston is 13% of the class B airspace. Potential IFR dynamic cutout access is much larger at 57% of the airspace as shown in Table 1. The low access provided by static IFR cutouts is largely due to separation issues to flights in BOS’ northeast flow pattern. This is an example where the dynamic cutout concept can enable AAM access to much of the city when the airport is not in the northeast configuration. The frequency of runway flow pattern change at BOS also demonstrates the necessity of accurate weather prediction in order to anticipate which dynamic cutouts may be available. Research into runway flow pattern prediction by Murca & Hansman [21] are initial efforts towards supporting such a capability. In terms of VFR operations, static cutouts may provide access to over 75% of the surface-level controlled airspace which is greater than the benefit in Atlanta.
D. Airspace Cutout Potential Near San Francisco International Airport
SFO is located 11 miles south of downtown San Francisco and its surface-level controlled airspace does not affect AAM operations in the city center. Cutout opportunities around SFO are displayed in Fig. 9 for the airport’s primary flow pattern which is active 83% of the time. SFO exhibited the most stable runway flow pattern of the three airports and the least difference between the benefits of static or dynamic cutouts.
In Fig. 9, a large volume of controlled airspace west of the airport is available for an IFR cutout. This area also remains separated in the other SFO flow configurations. Interestingly, the SFO airspace was redesigned in late 2018 (the redesign was not considered in Fig. 9) to re-allocate much of controlled airspace west of the airport in the IFR cutout as Class E airspace.
Fig. 9 Airspace cutout opportunity at SFO in a low wind, west flow pattern (83% frequency).
E. Sensitivity of Cutout Development to Conventional Aircraft Flight Dispersion
The dispersion of conventional aircraft on approach and departure procedures impacts the airspace available for cutouts. Departure procedures display greater dispersion (i.e., containment boundary width) than arrival operations; this trend is displayed on the left of Fig. 10. Furthermore, dispersion varies significantly between the three airports as shown on the right of Fig. 10. The floor altitudes of the boundaries are more closely correlated between the airports except for departures at BOS where the floor altitude rises more slowly than at the other airports.
Lateral Width of Containment Boundaries Floor Altitude (AGL) of Containment Boundaries Fig. 10 Comparison of 99.5th percentile containment boundaries for large commercial aircraft flights.
Factors that may reduce the dispersion of conventional flights at an airport include the use of performance based navigation, the use of simultaneous operations on parallel runways, and a higher percentage of large transport aircraft in the fleet mix of the conventional operators. Although this study assumed that large aircraft operations will not be adjusted to support the integration of AAM, Fig 11 displays how the potential for airspace cutouts would be impacted at BOS if the containment boundaries were defined to contain 95% of large aircraft flights rather than 99.5%.
While the lateral extent of the departure containment boundaries is substantially reduced in Fig 11, the more significant influence on airspace cutout potential is the increase in the containment floor altitude for departures (i.e., the climb-out gradient). The heightened containment floor altitude results in an increase in the size of potential IFR cutouts from 50% to 72%.
99.5th Percentile Containment of Conventional Ops. 95th Percentile Containment of Conventional Ops. Fig 11. Comparison of airspace cutout opportunities for different probabilities of interaction with
conventional aircraft at BOS in a northwest flow pattern.
V. Evaluation of Procedurally Separated Airspace Cutouts to Support AAM in Major U.S. Cities
This section refines the approach demonstrated in Section IV to evaluate mission coverage (i.e., the portion of a region’s population that AAM could access without ATC interaction) in the 34 largest U.S. metropolitan areas. The results provide a first-order estimation of the severity of the ATC constraint on AAM operations in each city.
The potential for cutouts was evaluated with respect to all airports in each metropolitan area, rather than just the primary airport as conducted in Section IV. Access for AAM to other airspace constructs including special use airspace (SUA) and controlled airspace at low-traffic GA airports was also assessed. Furthermore, rather than quantifying the potential benefit of cutouts based upon the percentage of controlled airspace that was released, the benefit was quantified by the increase in access to potential customers. This was motivated by the assumption that a cutout over open water or rural areas was not as valuable from a market perspective as a cutout over a city center.
The results of this analysis:
1. assessed the effectiveness of airspace cutouts and other airspace access strategies to reduce ATC limits for AAM,
2. evaluated city-to-city variation in mission coverage, and
A. Metropolitan Area Selection
Initial markets for AAM services are anticipated to be located in metropolitan areas with large populations [5,6,22]. This study therefore considered all Metropolitan Statistical Areas (MSAs) in the United States with populations larger than two million as potential early adopter markets for AAM. An MSA is a geographic region with a densely populated core city(s) that have close economic ties and worker mobility to and from the surrounding communities [23]. Based on U.S. Census Bureau estimates for 2018 MSA populations, 34 MSAs were identified in the U.S. with populations over two million individuals. Fig. 12 displays each MSA.
Fig. 12 Metropolitan statistical areas in the U.S. with over two million inhabitants. B. Modeling ATC Constructs in each MSA
1. Controlled Airspace and Special Use Airspace
Surface-level controlled airspace and SUA were modeled in each MSA; these airspace constructs are areas where AAM operations may be restricted by limited ATC capacity. The left sub-figure of Fig. 13 displays the controlled airspace and SUA in the Seattle-Tacoma region.
Controlled airspace volumes were modeled based on geometries from the FAA 28 Day National Airspace System Resource6. It was anticipated that AAM access to controlled airspace would vary depending upon the current amount
of air traffic and congestion in the airspace. Therefore, for the purposes of this analysis, controlled airspace was categorized into two groups based on the traffic volume that its central airport supported. Airports that supported either >20,000 annual commercial operations, >75,000 total annual operations, or permanent military operations were termed “high-traffic” airports for this analysis. Airports that did not support air traffic meeting these criteria were termed “low-traffic” airports.
SUA protects aviation or surface activities of a unique nature. SUA modeled in this analysis include prohibited airspace, restricted airspace, temporary flight restrictions (TFRs), military operating areas, warning areas, alert areas, and special conservation areas. Of these SUA, TFRs most commonly appeared within the MSAs. The majority of the TFRs were positioned around large, open-air stadiums, and were generally active for less than 50 hours per year. However, TFRs around baseball stadiums were active for as many as 400 hours per year. Stadium TFR volumes were modeled based the dimensions delineated by the FAA notice to airmen FDC 7/4319 7. The other types of SUA were
modeled with geometric data collected from FAA VFR aeronautical charts.
6 Federal Aviation Administration. “28 Day National Airspace System Resource,” accessed July 1, 2018 from
www.faa.gov/air_traffic/flight_info/aeronav/aero_data/NASR_Subscription/
7 Federal Aviation Administration. “Notice to Airmen FDC 7/4319,” accessed July 1, 2018 at
Controlled Airspace and SUA Arrival/Departure Operations Fig. 13 ATC constructs modeled in the Seattle-Tacoma MSA.
2. Approach and Departure Operations at High-Traffic Airports
Models of airspace usage by aircraft arrivals and departures were developed for high-traffic airports in each MSA. ASDE-X radar data was not available at every airport in each MSA, therefore simplified, representative containment boundaries were developed as the average of the boundaries from the Boston, Atlanta, and San Francisco international airports. The containment boundaries were defined based on the airspace extent used by 99.5% of large aircraft flights.
The representative containment boundaries were applied to every high-traffic airport in the study assuming straight-in arrivals and straight-out departures. When runway utilization data was available, only runways use >5% of the year were considered. IFR and VFR separation minima were applied to the containment boundaries to represent required separation of AAM flights from conventional airport arrival and departure operations.
Fig. 14 displays the representative 99.5th percentile containment boundaries for arrival and departure operations to
San Diego International Airport in its primary runway flow configuration. Note that no separation minima offset was applied to the boundaries in Fig. 14. The departure containment boundary is larger than that of the arrivals due to greater average flight dispersion during departures. However, the arrival containment boundary has a lower containment floor altitude than the departures. The right sub-figure of Fig. 13 displays the representative containment boundaries for evaluated airports in the Seattle-Tacoma MSA.
C. Potential AAM Demand in each MSA
Potential demand for AAM services was spatially modeled in each MSA through three different approaches: 1. Population density was assumed as a proxy of demand for point-to-point demand (e.g., an air taxi mission) 2. Census tracts into which long-duration commuters (individuals travelling >60 minutes, each way) commute
were assumed to be demanded workplace locations for a commuting mission.
3. Census tracts from which long-duration commuters commuted were assumed to be demanded residential locations for a commuting mission.
Population density was modeled by regridding the 2010 U.S. Census block-level population data into a regular 0.1 nautical mile grid over the MSA (to provide a consistent, fine-grained measurement of population). The population was assumed to be distributed evenly within a given census block during the re-gridding process.
The Census Transportation Planning Product (CTPP) was used to identify long duration commuters. The CTPP bases commuter estimates on data from the 2012-2016 5-year American Community Survey (ACS). Further detail on how each of these demand types are modeled may be found in Chapter 9 of Ref [18].
D. ATC ConOps Scenarios
AAM mission coverage was evaluated for five “ATC ConOps scenarios” that represented various implementations of airspace cutouts and other airspace integration strategies concerning SUA and low-traffic airport airspace. Comparison between the scenarios provides insight into the sensitivity of mission coverage to each strategy and informs their potential effectiveness to relieve the ATC constraint. Table 2 summarizes the scenarios.
Table 2 ATC ConOps scenarios for the mission coverage analysis.
ATC ConOps Scenario Description
1
Fully segregated from SUA and terminal airspace
AAM flight is excluded from all SUA and terminal-area controlled airspace (i.e., class B, C or D airspace). This scenario is the current-day baseline condition for mission coverage; (manned) AAM vehicles could currently operate in this manner under VFR without any ATC interaction (i.e., unconstrained by ATC).
2 Access to SUA AAM is excluded from any controlled airspace but may enter any type of SUA.
3
Access to controlled airspace at low-traffic
airports
AAM is excluded from controlled airspace at high-traffic airports and any type of SUA. AAM may enter controlled airspace at low-traffic airports.
4 Access to static VFR cutouts
AAM may enter controlled airspace at high-traffic airports through the use of procedurally segregated VFR cutouts. AAM may not enter SUA or airspace at low-traffic airports.
5 Scenarios 2-4 combined
AAM may access SUA, controlled airspace at low-traffic airports, and static VFR cutouts.
E. Results
AAM mission coverage was calculated for each type of demand (i.e., population density and long-duration commuters) under each ATC ConOps scenario in every MSA. Access to demand was considered to be unrestricted by ATC if the aircraft could fly at a minimum of 300 ft AGL without entering one of the active ATC constructs for the given ATC ConOps scenario.
1. Sensitivity of AAM Mission Coverage to Differences Between the MSAs
Table 3 summarizes the population accessibility, workplace accessibility, and two types of residence accessibility for each MSA when AAM is excluded from all controlled airspace and SUA (i.e., a fully segregated ATC ConOps). Entries of “N/A” indicate cases where no census tracts within the MSA supported at least 500 long-duration commuters (a minimum threshold set to designate long-duration commuter workplaces and communities).
Table 3. Mission coverage when AAM is excluded from SUA and controlled airspace (fully segregated).
There is a large variation in mission coverage between the MSAs in Table 3. The first column indicates that if AAM aircraft do not interact with ATC (i.e., avoid controlled airspace and SUA altogether) then as little as 24% of an MSA’s population (in Las Vegas) or as high as 85% of the population (in Indianapolis) may be accessible.
Fig. 15 displays how the various types of SUA and controlled airspace influence mission coverage in Indianapolis and Las Vegas. The population in the Indianapolis MSA is sprawling and only impacted by a single controlled airspace and SUA. Furthermore, the Indianapolis airport is located seven miles from the downtown area in a largely industrial region with little population; the influence of its controlled airspace on population access is therefore minimized.
In comparison, the entirety of the population of Las Vegas is concentrated near the downtown area. A large class B airspace as well as two class D airspace volumes overlay the majority of Las Vegas and are responsible for the highly restricted mission coverage.
Metropolitan Area Total Population Long-Duration Commuter Workplaces Long-Duration Commuter Residences Induced Commuter Residences Indianapolis, IN 85% 81% 93% 95% Charlotte, NC 81% 30% N/A 97% Sacramento, CA 79% 54% 100% 94% Pittsburgh, PA 77% 10% 100% 85% Austin, TX 77% 38% 89% 88% Cincinnati, OH 76% 46% 100% 93% Kansas City, MO 76% 38% 100% 100% Tampa, FL 75% 37% 85% 89% St. Louis, MO 75% 35% 100% 91% Detroit, MI 74% 64% 99% 82% Atlanta, GA 72% 37% 83% 81% Cleveland, OH 70% 25% N/A 100% Portland, OR 70% 68% 89% 75% Philadelphia, PA 67% 60% 58% 66% Orlando, FL 67% 33% 89% 67% Chicago, IL 66% 24% 82% 68% Riverside, CA 66% 35% 71% 65% Denver, CO 64% 22% 73% 72% Baltimore, MD 64% 38% 82% 74% Houston, TX 62% 48% 71% 64% Boston, MA 61% 15% 71% 62% Columbus, OH 60% 15% 100% 91% Minneapolis, MN 59% 21% 100% 92% Phoenix, AZ 59% 26% 85% 66% Seattle, WA 58% 35% 76% 69% Dallas, TX 56% 19% 77% 75%
New York City, NY 55% 40% 49% 55%
San Antonio, TX 54% 65% 100% 74% San Diego, CA 53% 30% 88% 61% San Francisco, CA 48% 24% 71% 46% Los Angeles, CA 44% 31% 54% 44% Miami, FL 43% 18% 36% 47% Washington, DC 34% 6% 58% 37%
Las Vegas, NV 24% 0% N/A 21%
Fig. 15 Comparison of MSAs with population access least and most impacted by ATC when AAM is fully segregated (i.e., excluded from all SUA and controlled airspace).
Fig. 16 visually summarizes the mission coverage data from Table 3 in terms of the total population, long-duration commuter workplace, and long-duration commuter residence demand metrics. The data presented in Fig. 16 is also for a fully segregated ATC ConOps scenario.
Average mission coverage is highest for induced and existing the long-duration commuter communities (census tracts where greater than 250 people travel 60 or more minutes to work). This is the result of long-duration commuter communities primarily being spread along the periphery of the city center rather than clumped together in downtown areas. The geographic spreading of the communities makes them less likely to simultaneously be restricted due to an overlying airspace construct.
Opposite this trend, the commuter workplaces exhibit a lower accessibility than either the commuter residences or the general population. This results from workplaces tending to be clustered in a single region (such as in a city center or industrial park) where an airspace construct could preclude access to a larger percentage of workplaces simultaneously. Furthermore, workplaces are often clustered in proximity to airports, perhaps due to industrial zoning.
The disparity of mission coverage between different MSAs as well as between different demand types suggests that ATC impacts on AAM operations will vary substantially from market to market.
While Fig. 16 displayed how ATC may impact AAM scaling for different demand types and MSAs under the fully segregated ATC ConOps scenario (i.e., the baseline condition for current operations), the figure did not provide insight into the potential value of airspace cutouts or other integration strategies. Fig. 17 presents the variation in mission coverage among the MSAs under four ATC ConOps scenarios. The first grouping of bars in Fig. 17 corresponds to
Fig. 16 Comparison of the mission coverage metrics for the 34 MSAs under a fully segregated ATC ConOps scenario.
those in Fig. 16, except that the long-duration commuter residences are separated into induced and current demand as described in Ref [18]. The ATC scenario concerning AAM access to controlled airspace at low-traffic airports was not shown for brevity, but it had a similar impact on mission coverage as the access to SUA integration strategy.
Commuter workplace mission coverage is lower than the other metrics across all four ATC ConOps scenarios. Both types of commuter residence mission coverage were greater than the other metrics in all four scenarios. Access to SUA significantly changed the distribution of workplace coverage among the MSAs. Access to static VFR cutouts appears to reduce variation and increase average mission coverage for the other three demand metrics. The next section will provide a more detailed discussion of the sensitivity of mission coverage to the different ATC ConOps scenarios.
Fig. 17 Variation in the mission coverage metrics for the 34 MSAs under four ATC ConOps scenarios. 2. Sensitivity of AAM Mission Coverage to ATC ConOps
Fig. 18 displays how the percent of the population that is accessible to AAM in the MSAs varies in response to the five ATC ConOps scenarios. Table 4 provides the population accessibility data for each MSA from which Fig. 18 was generated; similar tables for workplace and commuter accessibility may be found in Ref. [18].
Fig. 18 Population coverage for 34 MSAs in five ATC ConOps scenarios.
The first bar of Fig. 18 indicates that the median population coverage for fully segregated AAM operations in the MSAs is 65%. This suggests that VFR AAM services could currently access 65% of the population in a typical MSA without ATC interaction or any ATC restrictions.
The second bar displays population coverage if AAM were authorized to fly in SUA. Providing access to SUA increases the median population accessibility by 5% compared to the fully segregated scenario. However, exclusion from controlled airspace continues to impede AAM operations to 30% of the median MSA’s population. Access to SUA had a more substantial impact on workplace coverage as shown in Fig. 17.
The third bar of Fig. 18 displays the population coverage benefits of AAM access to controlled airspace at low-traffic airports. Five cities, including Philadelphia, Pittsburgh, and Boston, experienced an increase in population coverage of 10% or more through this strategy. However, the general affect across the MSAs is less with a median increase in population coverage of 4% compared to the fully segregated scenario.
The fourth bar displays the influence of AAM access to VFR airspace cutouts from controlled airspace at high-traffic airports. Under this strategy, cutouts were generated where VFR radar separation was met to 99.5% of conventional aircraft operations in any flow pattern of high-traffic airports. VFR cutouts of this type may increase the median population coverage in the MSAs to 80%. VFR cutouts provided the most significant increase in population coverage among the individuals airspace access strategies considered. Furthermore, VFR cutouts were the only strategy to increase population coverage for the MSAs in the bottom quartile.
The fifth bar of Fig. 18 displays the potential population coverage in an ATC scenario were the three integration strategies are applied simultaneously. The result of this scenario is an increase in median population coverage from 65% (in the fully segregated case) to 92%. Furthermore, the interquartile range and spread of the lower quartile are substantially reduced indicating the simultaneous application of the three strategies provides higher consistency of population coverage across the MSAs. The change in population coverage is also larger than the sum of the changes for each strategy implemented independently indicating that the strategies are complementary to one another.
3. Comparison of Mission Demand in Each MSA
The previous sections evaluated AAM mission coverage in the 34 MSAs based upon the percentage of their total population, long-duration commuter workplaces, or long-duration commuter residences that could be accessed by AAM aircraft under various ATC ConOps scenarios. While comparing mission coverage percentages provided a common baseline to evaluate differences between the MSAs, the total addressable market is related to the total number of individuals AAM could access in an area.
Table 5 displays the eight MSAs with the largest number of individuals that could be accessed by AAM flights without ATC interaction when AAM may fly in SUA but is excluded from all controlled airspace (including at low-traffic airports). Interestingly, New York City, Los Angeles, and Dallas were MSAs within the bottom quartile of mission coverage by the percentage of their population that could be accessed. However, these three MSAs appear in the top quartile of mission coverage by total number of individuals that may be accessed.
For example, Los Angeles was the 4th lowest MSA by the percentage of its population that could be accessed
without ATC interaction under this ConOps scenario (with a 54% mission coverage), but it was the third largest population that could be accessed in terms of the number of individuals. Even though a larger percentage of Los Angeles’ population could not be accessed by AAM without ATC interaction, the comparatively larger size of the MSA’s population (the second largest of all the MSAs) resulted in the remaining accessible market being larger than most other areas.
Table 5. MSAs with the greatest number of accessible individuals when AAM aircraft have access to SUA but are excluded from all controlled airspace.
Testing a different ATC ConOps scenario, Table 6 displays the MSAs with the largest accessible population when AAM may operate within SUA, controlled airspace at low-traffic airports, and VFR cutouts without ATC restrictions. This scenario is the most aggressive case for AAM integration and results in the highest mission coverage.
Once again, all MSAs in Table 6 have large total populations. Seven of the eight cities with the largest accessible populations remain the same to those from Table 5, although their order is modified. Los Angeles, which was especially constrained by controlled airspace, could potentially access an additional 3.3 million individuals through this airspace integration scenario. In comparison, Chicago only experienced an increase of 1.4 million individuals as the MSA was less impacted by ATC restrictions.
Table 6. MSAs with the largest number of accessible individuals when AAM may operate in SUA, controlled airspace at low-traffic airports, and VFR cutouts.
New York City 11.1 New York City 535,000 New York City 887,000 Chicago 7.3 Chicago 249,000 Chicago 344,000 Los Angeles 6.9 Los Angeles 221,000 Washington, DC 298,000 Boston 4.9 San Francisco 179,000 Los Angeles 242,000 Philadelphia 4.2 Atlanta 112,000 Boston 221,000 Atlanta 4.0 Washington, DC 105,000 Atlanta 207,000 Dallas 3.8 Houston 100,000 San Francisco 179,000 Houston 3.8 Philadelphia 83,000 Houston 166,000
Air Taxi Mission
Accessible Population (millions) Accessible Workplaces Accessible Residences Commuter Mission - Commuters Travelling > 60 min each way
The takeaway from Table 5 and Table 6 is that although smaller cities were found to generally present fewer ATC constraints for AAM access to their populations, larger cities provide a greater demand opportunity. In other words, the market with the largest number of individuals that could potentially be accessed by AAM (i.e., the largest serviceable addressable market) is most strongly driven by the total population of an MSA (i.e. the largest total addressable market) irrespective of the ATC constraints in the region and the ATC ConOps scenario applied.
VI. Conclusion
This paper evaluated the potential for airspace cutouts to support high-volume AAM operations within controlled-airspace. The principal of the cutout concept is to re-allocate volumes of controlled airspace that are procedurally segregated from transport aircraft operations for use by AAM flights. AAM flights may occur in these volumes (initially under VFR only) without limitations from controller workload, radio communications, or separation to conventional operations.
The potential benefits of developing airspace cutouts were first evaluated at three major airports. The development of static airspace cutouts that provide VFR radar separation to 99.5% of conventional arrivals and departures were shown to release approximately 75% of the surface-level controlled airspace to AAM operations at these airports. The deployment of dynamic cutouts, which are turned on or off based upon airport flow configuration, provided additional benefits at Atlanta and Boston. Static airspace cutouts developed with IFR separation minima provided few benefits at Atlanta and Boston, but enabled access to nearly 50% of surface-level controlled airspace at SFO.
Potential benefits from airspace cutouts and two other ATC integration strategies were developed for in the 34 largest U.S. metropolitan areas. On average, 65% of a city’s population was found to be currently accessible to VFR AAM operations without ATC interaction. However, only 34% long-duration commuter workplace locations could be accessed by AAM in the median U.S. city without potential limitations from ATC.
Two strategies showed promise to relieve a significant proportion of ATC interactions for VFR operations. First, providing access to special use airspace, and especially temporary flight restrictions for sporting events, increased commuter workplace access to 54% for the median U.S. city. Second, the development of VFR airspace cutouts was the most effective strategy evaluated in this paper increasing population access to 80% in the median city (a 15 percentage point increase). Through the combination of special use airspace access, airspace cutouts, and access to airspace at low-traffic, general aviation airports, 92% of the population and 84% of the long duration commuter workplaces in the median U.S. city could be accessed by VFR AAM without ATC restrictions.
Based upon these findings, the development of procedurally separated airspace cutouts is a promising approach to mitigate ATC restrictions on near-term AAM implementation and scaling. Future work is necessary to refine the models and assumptions presented in this paper, conduct more detailed analysis in cities where AAM will be initially implemented, and develop the concept of operations and systems safety studies necessary for the design and operation of airspace cutouts.
Acknowledgments
This material is based upon work supported by the National Aeronautics and Space Administration under contract NNL13AA08B.
References
[1] Mueller, E. R., Kopardekar, P. H., and Goodrich, K. H., “Enabling Airspace Integration for High-Density On-Demand Mobility Operations,” 17th AIAA Aviation Technology, Integration, and Operations
Conference, Denver, CO: AIAA, 2017, pp. 1–24, doi: 10.2514/6.2017-3086.
[2] ICAO, “UTM – A Common Framework with Core Boundaries for Global Harmonization,” 2019. [3] Vascik, P. D., Balakrishnan, H., and Hansman, R. J., “Assessment of Air Traffic Control for Urban Air
Mobility and Unmanned Systems,” 8th International Conference on Research in Air Transportation, Castelldefels, Barcelona, Spain: ICRAT, 2018.
[4] Thipphavong, D. P., Apaza, R., Barmore, B., Battiste, V., Belcastro, C. M., Burian, B., Dao, Q., Feary, M., Go, S., Goodrich, K. H., Homola, J., Idris, H. R., Kopardekar, P. H., Lachter, J. B., Neogi, N. A., Ng, H. K., Oseguera-Lohr, R. M., Patterson, M. D., and Verma, S. A., “Urban Air Mobility Airspace Integration Concepts and Considerations,” 2018 Aviation Technology, Integration, and Operations Conference, Atlanta,
GA: AIAA, 2018, doi: 10.2514/6.2018-3676.
[5] Booz Allen Hamilton, “Urban Air Mobility (UAM) Market Study,” 2018. [6] Crown Consulting, I., “Urban Air Mobility (UAM) Market Study,” 2018.
[7] Kopardekar, P., Rios, J., Prevot, T., Johnson, M., Jung, J., and Iii, J. E. R., “Unmanned Aircraft System Traffic Management (UTM) Concept of Operations,” 16th AIAA Aviation Technology, Integration, and
Operations Conference, Washington, DC: AIAA, 2016, pp. 1–16, doi: 10.2514/6.2016-3292.
[8] European Union Aviation Safety Agency, “Opinion No 01/2020: High-level regulatory framework for the U-space,” 2020.
[9] Schaufele, R. D. J., and Lukacs, M., “FAA Aerospace Forecast: Fiscal Years 2019-2039,” 2019. [10] Vascik, P. D., and Hansman, R. J., “Scaling Constraints for Urban Air Mobility Operations: Air Traffic
Control, Ground Infrastructure, and Noise,” 18th AIAA Aviation Technology, Integration, and Operations
Conference, Atlanta, GA: AIAA, 2018, doi: 10.2514/6.2018-3849.
[11] National Academies of Sciences, Engineering, and Medicine, Advancing Aerial Mobility: A National
Blueprint (2020), Washington, D.C.: The National Academies Press, 2020, doi: 10.17226/25646.
[12] Andrews, J. W., and Hollister, W. M., Electronic Flight Rules: An Alternative Separation Assurance
Concept, Lexington, MA: 1980.
[13] Menon, P. K., Sweriduk, G. D., and Sridhar, B., “Optimal Strategies for Free-Flight Air Traffic Conflict Resolution,” Journal of Guidance, Control, and Dynamics, vol. 22, 1999, pp. 202–211, doi: 10.2514/2.4384. [14] FAA, “UAS Data Exchange (LAANC)” Available:
https://www.faa.gov/uas/programs_partnerships/data_exchange/.
[15] Vascik, P. D., “Systems-Level Analysis of On Demand Mobility for Aviation,” Masters Thesis, Massachusetts Institute of Technology, 2017.
[16] Boston Virtual ARTCC, “BVA Boston Consolidated TRACON Standard Operating Procedures,” 2018. [17] Kulkarni, S., Ganesan, R., and Sherry, L., “Dynamic Airspace Configuration Using Approximate Dynamic
Programming,” Transportation Research Record, 2012, pp. 31–37, doi: 10.3141/2266-04. [18] Vascik, P. D., “Systems Analysis of Urban Air Mobility Operational Scaling,” Ph.D. Dissertation,
Massachusetts Institute of Technology, 2019.
[19] Fitzek, R. A., “Lessons Gained in Helicopter Air Traffic Control from Federal Aviation Agency Activities,”
Journal of the Royal Aeronautical Society, vol. 66, 1962, pp. 499–502, doi:
https://doi.org/10.1017/S0368393100077166.
[20] Vascik, P. D., and Hansman, R. J., “Assessing Integration Between Emerging and Conventional Operations in Urban Airspace,” 19th AIAA Aviation Technology, Integration, and Operations Conference, Dallas, TX: AIAA, 2019, pp. 1–24, doi: https://doi.org/10.2514/6.2019-3125.
[21] Murca, M. C. R., and Hansman, R. J., “Identification, Characterization, and Prediction of Traffic Flow Patterns in Multi-Airport Systems,” IEEE Transactions on Intelligent Transportation Systems, 2018, doi: 10.1109/TITS.2018.2833452.
[22] Holden, J., and Goel, N., Fast-Forwarding to a Future of On-Demand Urban Air Transportation, San Francisco, CA: Uber Technologies, Inc., 2016.
[23] U.S. Census Bureau, “Metropolotian and Micropolitian Statistical Areas - About” Available: www.census.gov/programs-surveys/metro-micro/about.html.