HAL Id: hal-01713779
https://hal.archives-ouvertes.fr/hal-01713779
Submitted on 26 May 2020
HAL is a multi-disciplinary open access
archive for the deposit and dissemination of sci-entific research documents, whether they are pub-lished or not. The documents may come from teaching and research institutions in France or abroad, or from public or private research centers.
L’archive ouverte pluridisciplinaire HAL, est destinée au dépôt et à la diffusion de documents scientifiques de niveau recherche, publiés ou non, émanant des établissements d’enseignement et de recherche français ou étrangers, des laboratoires publics ou privés.
Copyright
Modeling and optimization of lipid accumulation by
Yarrowia lipolytica from glucose under nitrogen
depletion conditions
Carlos Robles Rodriguez, Rafael Munoz Tamayo, Carine Bideaux, Nathalie
Gorret, Stéphane Guillouet, Carole Molina-Jouve, Gilles Roux, Cesar Arturo
Aceves-Lara
To cite this version:
Carlos Robles Rodriguez, Rafael Munoz Tamayo, Carine Bideaux, Nathalie Gorret, Stéphane Guil-louet, et al.. Modeling and optimization of lipid accumulation by Yarrowia lipolytica from glucose under nitrogen depletion conditions. Biotechnology and Bioengineering, Wiley, 2018, 115 (5), pp.1-15. �10.1002/bit.26537�. �hal-01713779�
Version postprint
A
c
c
e
p
te
d
P
r
e
p
r
in
t
Biofuels and Environmental Biotechnology Biotechnology and Bioengineering DOI 10.1002/bit.26537Modeling and optimization of lipid accumulation by Yarrowia lipolytica from glucose under nitrogen depletion conditions†
Running Title: Modeling and optimization of lipid accumulation by Yarowia lipolytica Carlos Eduardo Robles-Rodríguez1, Rafael Muñoz-Tamayo1,a, Carine Bideaux1,
Nathalie Gorret1, Stéphane E. Guillouet1, Carole Molina-Jouve1, Gilles Roux2,
César Arturo Aceves-Lara1*
1LISBP, Université de Toulouse, CNRS, INRA, INSA, Toulouse, France
2 LAAS-CNRS, Université de Toulouse, CNRS, UPS, Toulouse, France
*Corresponding author address: Biosystems and Process Engineering Laboratory (LISBP), UMR-CNRS 5504, UMR–INRA 792, Département de Génie Biochimique et Alimentaire, Institut National des Sciences Appliquées, 135 Avenue de Rangueil, 31077 Toulouse Cedex, France. Phone: (33) 5 62 25 01 40. Fax: (33) 5 61 55 94 00. E-mail address: aceves@insa-toulouse.fr
a Present address: UMR Modélisation Systémique Appliquée aux Ruminants, INRA,
AgroParisTech, Université Paris-Saclay, 75005, Paris, France
†This article has been accepted for publication and undergone full peer review but has not been through
the copyediting, typesetting, pagination and proofreading process, which may lead to differences between this version and the Version of Record. Please cite this article as doi: [10.1002/bit.26537]
Version postprint
A
c
c
e
p
te
d
P
r
e
p
r
in
t
ABSTRACTOleaginous yeasts have been seen as a feasible alternative to produce the precursors of biodiesel due to their capacity to accumulate lipids as triacylglycerol having profiles with high content of unsaturated fatty acids. The yeast Yarrowia lipolytica is a promising microorganism that can produce lipids under nitrogen depletion conditions and excess of the carbon source. However, under these conditions, this yeast also produces citric acid (overflow metabolism) decreasing lipid productivity. This work presents two mathematical models for lipid production by
Yarrowia lipolytica from glucose. The first model is based on Monod and inhibition kinetics,
and the second one is based on the Droop quota model approach, which is extended to yeast. The two models showed good agreements with the experimental data used for calibration and validation. The quota based model presented a better description of the dynamics of nitrogen and glucose dynamics leading to a good managing of N/C ratio, which makes this model interesting for control purposes. Then, quota model was used to evaluate, by means of simulation, a scenario for optimizing lipid productivity and lipid content. For that, a control strategy was designed by approximating the flow rates of glucose and nitrogen with piecewise linear functions. Simulation results achieved a productivity of 0.95 g.L-1.h-1 and a lipid content
fraction of 0.23 g.g-1, which indicate a promising alternative for the optimization of lipids
production. This article is protected by copyright. All rights reserved
Keywords: Biodiesel; Droop Model; Nitrogen quota; Unstructured modeling; Yarrowia
Version postprint
A
c
c
e
p
te
d
P
r
e
p
r
in
t
HIGHLITGHS• Two mathematical models for lipid production by Yarrowia lipolytica are developed. • The Droop model for microalgae is extended for yeast.
• The models are calibrated and validated with independent data sets.
• Multi objective optimization of lipid accumulation is studied with the quota model. • A simple control strategy for critical quota is promising to optimize lipid productivity.
Version postprint
A
c
c
e
p
te
d
P
r
e
p
r
in
t
Graphical AbstractThis work presents two mathematical models of the metabolism of Yarrowia lipolytica. The first model is based on Monod and inhibition kinetics, and the second one is based on the Droop quota model approach. The quota based model was used for maximizing lipid productivity and lipid content in simulation.
Version postprint
A
c
c
e
p
te
d
P
r
e
p
r
in
t
1. INTRODUCTIONThe use of microbial lipids as precursors of biodiesel production has outraised in the last years as an attractive and sustainable alternative (Papanikolaou and Aggelis, 2009). These lipids are produced by oleaginous microorganisms up to 20% of their dry weight (Ratledge, 2004). An interesting oleaginous microorganism is the yeast Yarrowia lipolytica. This yeast is able to use several substrates such as: glucose, fructose, lactose, sucrose, whey, glycerol, fatty acids, molasses, glucose/glycerol, glucose/stearin and glycerol/stearin (Nicaud et al., 2002; Papanikolaou and Aggelis, 2002; Papanikolaou and Aggelis, 2003a; Papanikolaou and Aggelis, 2011a; Rakicka et al., 2015). Yarrowia lipolytica has been identified as a potential candidate for the synthesis of biodiesel due to its production of high quantity of triacylglycerols (TAG) (>90% with respect to its total accumulation) with a rich fatty acid profile in linoleic acid (C18:2) (56%), oleic acid (C18:1) (28%), and palmitic acid (C16:0) (11%) (Beopoulos et
al., 2009; Papanikolaou and Aggelis, 2011b). Furthermore, this yeast is the only oleaginous
yeast with a complete sequenced genome (Barth and Gaillardin, 1997), making it a suitable candidate for genetic and metabolic engineering aiming the production of large amounts of lipids with specific fatty acids composition (Nicaud 2012). When Yarrowia lipolytica grows in nitrogen depletion conditions with substrates as glucose, ethanol, and starch hydrolysates; citric acid is secreted in significant amounts (Papanikolaou et al., 2006). This issue hampers the optimization of the carbon flux into lipids. The outbreak of lipid accumulation follows the exhaustion of a nutrient in the medium, mainly nitrogen (Papanikolaou and Aggelis, 2011a). This exhaustion reduces cell growth, but increases lipid content. The main challenge of this trade-off relationship is thus focused on increasing lipid content while maintaining an adequate cell growth through the manipulation of nitrogen fluxes (Yoo et al., 2014).
Version postprint
A
c
c
e
p
te
d
P
r
e
p
r
in
t
yeasts and fungus in different conditions and substrates (Economou et al., 2011; Fakas et al., 2009; Meeuwse et al., 2011; Meeuwse et al., 2012; Ykema et al., 1986). For example, the model developed by (Economou et al., 2011) for the fungus Mortierella isabellina, assumes that high substrate concentration inhibits microbial growth and that high nitrogen concentration decreases lipid concentration. Meeuwse et al., (2012) reported a model for the fungus
Umbelopsis isabellina in three phases: exponential growth phase, lipid accumulation phase,
and lipid turnover phase. This was accomplished by the definition of certain fixed times to switch phases. Models with a particular interest on Yarrowia lipolytica have considered the mechanisms of lipid accumulation (Papanikolaou and Aggelis, 2002; Papanikolaou and Aggelis, 2003b), and citric acid production (Arzumanov et al., 2000; Papanikolaou and Aggelis, 2003a), separately. All these models represented acceptably the dynamics of growth and accumulated lipids concentration from fat substrates. However, there is only one existing model for the concomitant production of lipids and citric acid (Papanikolaou et al., 2006), which fails to predict lipid accumulation since it was applied for the production of structural lipids (membrane lipids). Other modeling approaches have considered variant yields, such as the model proposed by Droop (Droop, 1968), where biomass production depended on a variable cell quota defined as the fraction of internal nutrient per unit of biomass (Lemesle and Mailleret, 2008). These models have only been presented for microalgae on: autotrophic (Mairet et al., 2011), heterotrophic (Abdollahi and Dubljevic, 2012; De la Hoz Siegler et al., 2011; Surisetty et al., 2010b), and mixotrophic (Adesanya et al., 2014; Yoo et al., 2014) conditions. Nevertheless, lipid accumulation in those models for microalgae was also triggered by the depletion of nitrogen, and thus this similarity between microalgae and yeast is encouraging to propose new models based on quota definitions. In this context, this paper proposes a quota based model for yeast in order to expose its efficiency on modeling and optimization problems. The present paper is organized as follows: Section 2 describes the
Version postprint
A
c
c
e
p
te
d
P
r
e
p
r
in
t
experimental data used in this study, and it details the developed mathematical models. Section 3 presents the calibration and the validation of the models, and it proposes the optimization of lipid accumulation by finding the optimal input flow rates. Finally, conclusions are drawn in section 4.2. MATERIALS AND METHODS 2.1. Strain and medium
Three independent experiments (culture A, B and C) were performed with the strain
Yarrowia lipolytica W29 obtained from the Microbiology and Molecular genetics laboratory
(Paris-Grignon, France). The optimal growth conditions of this yeast are: 28 °C and pH of 5.6 (Faure, 2002).
The strain was maintained at −80°C in yeast extract peptone dextrose (YPD) medium (10 g.L-1 yeast extract, 10 g.L-1 peptone and 10 g.L-1 glucose) supplemented with 30% (v/v)
glycerol. For each culture, one glycerol stock was streaked on a Petri dish (YPD agar medium containing 10 g.L−1 agar) and incubated at 30°C for 48 h. Pre-cultivations were carried out first
in a 5 mL tube of YPD medium at 30°C for 16 h inoculated with one colony from Petri dish. Then, two successive steps of 16 h pre-cultures were carried out in baffled-shake flasks inoculated with a 10 % (v/v) ratio with increasing culture volumes and containing mineral medium with the following composition: K2HPO4: 3 g.L-1; (NH4)2SO4: 3 g.L-1; NaH2PO4,H2O:
3 g.L-1; MgSO4,7H2O: 1 g.L-1; ZnSO4,7H2O: 0.04 g.L-1; FeSO4,7H2O: 0.0163 g.L-1;
MnSO4,H2O: 0.0038 g.L-1; CoCl2,6H2O: 0.0005 g.L-1; CuSO4,5H2O: 0.0009 g.L-1;
Na2MoSO4,2H2O: 0.00006 g.L-1; CaCl2,2H2O: 0.023 g.L-1; H3BO3: 0.003 g.L-1; and 10 mL of
vitamins solution (Ochoa-Estopier, 2012). The reactor, which contained the same composition of mineral medium without (NH4)2SO4, was inoculated with a 10% (v/v) ratio.
Version postprint
A
c
c
e
p
te
d
P
r
e
p
r
in
t
The data from the three independent experiments were determined with the same protocols. Yeast concentration was quantified by spectrophotometry at 600 nm in a spectrophotometer HITACHI U-1100. For dry cell weight, culture samples (5–10 mL) were harvested by filtration on a 0.45 µm membrane (Sartorius) and dried at 200 mm Hg and 60 °C during 48 h until a constant weight was achieved. Determination of alcohols, organic acids, and sugar concentrations from supernatants was performed by HPLC using a column Aminex HPX-87H (300 mm*7.8 mm) with the following conditions: Temperature of 50 °C, with 5 mM H2SO4 as
eluent (flow rate of 0.5 mL.min-1) and dual detection (refractometer and UV at 210 nm).
Compounds were identified and quantified with respect to standards. An ammonium ion electrode (PH/ISE meter model 710A + Ammonia Gas Sensing Electrode Model 95-12, Orion Research Inc. Boston USA) was used to quantify the residual ammonia concentration in the culture medium. The quantification of lipids was carried out as described by Browse et al. (1986) 20 mg of lyophilized cells were added to 1 mL of methanol solution containing 25 ml.L-1 of sulfuric acid (95%) and internal standard (C9:0). The mix in sealed tubes was placed in a 80°C bath for 90 minutes. After cooling, 450µL hexane and 1.5 mL water were added and vortexed. The lipidic phase was then sampled and the composition was analyzed by Gas Chromatography as mentioned in Cescut et al., (2011).
2.3. Experimental data
Culture A (Figure 1 a) is a fed-batch reported by Cescut, (2009) where Yarrowia lipolytica was grown in a 20 L bioreactor (Biostat E. Braun, Melsungen, Germany). The dissolved oxygen was maintained above 20% of saturation by modulating the stirring rate and/or the air flow rate in order to avoid oxygen limitation. Inoculation volume was of 800 mL. Operating conditions were fixed and controlled to a temperature of 28°C and a pH value of 5.5 regulated by addition of a 10 M NH3 solution (growth phase) or 5 M KOH solution (after nitrogen
Version postprint
A
c
c
e
p
te
d
P
r
e
p
r
in
t
bioreactors parameters (e.g. Temperature, pO2, pH, agitation) were measured online and acquired by custom made software. The flow rates of nitrogen (NIN, ammonia 5 M) and carbon (S , glucose 730 g.LIN -1) sources varied continuously (Figure 1 a) to induce differentlevels of nitrogen limitation.
Culture B (Figure 1 b) corresponds to a sequential batch culture under nitrogen starvation. This was obtained from a 5 L stirred tank bioreactor (Biostat B. Braun Biotech International, Sartorius AG, Germany) with the acquisition software MFCS/win 2.1®. The inoculation
volume was 300 mL. The dissolved oxygen was maintained above 20% of saturation. The working volume of the reactor was 3 L, where the operating conditions were set to a controlled temperature of 28°C and a pH value of 5.6 regulated by a 5 M KOH solution. The initial medium contained 100 g.L -1 of glucose and 4.14 g.L -1 of (NH4)2SO4 . The carbon source
(glucose) was fed by two pulses at 35 h and 55 h (Figure 1 b). The first half of this culture was used for model calibration and the second half for model validation.
Culture C (Figure 1 c) is a sequential batch culture under nitrogen starvation, where the carbon source (glucose) was fed by one pulse at 19.3 h (Figure 1 c). The initial medium contained 6.6 g.L-1 of (NH4)2SO4 and 100 g.L -1 of glucose. The reactor and operating
conditions were the same as the reported for culture B.
2.4. Model assumptions
Our models assume that the metabolism and cell growth of Yarrowia lipolytica are driven by the uptake of two extracellular nutrients: carbon (i.e. glucose) and nitrogen (i.e. ammonia). Figure 2 displays the different physiological states occurring in the cell. These phenomena have as first priority the production of functional biomass (catalytically active biomass), which has an elementary composition of CH1.744O0.451N0.132 (Ochoa-Estopier, 2012). Under intracellular
Version postprint
A
c
c
e
p
te
d
P
r
e
p
r
in
t
citric acid is produced and excreted (Papanikolaou et al., 2006 ; Ochoa-Estopier and Guillouet, 2014). This production is the result of overflow metabolism leading to by-product formation (Amribt et al., 2013; Santos et al., 2012). These by-products are often inhibitory or competing products (i.e. citric acid) that could decrease the production of the target metabolite (TAGs in our case). Sugars can also have an inhibitory effect and it was thus considered as suggested by Economou et al. (2011). The dynamics of Yarrowia lipolytica metabolism under discontinued operation can be described by balance equations considering the concentrations (g.L-1) of
Glucose (S), Nitrogen (N), Functional biomass (Xf ), Lipid biomass (XL), Citric Acid (CIT), and volume (V, expressed in L) undertaking homogenous well-mixed conditions with non-limited oxygen requirements. It is noteworthy that the functional biomass contains a part of lipids, which are components of the membrane. These lipids are called structural lipids XLS and
are intrinsic to the functional biomass in a constant fraction γ equivalent to 0.06 gXL.gXf-1,
(Robles-Rodriguez et al., 2017). This definition allows to accounting for a separate term of accumulated lipids XLA. For simplicity and consistency with experimental data, only Total
lipids (XL = XLS +XLAwithXLS =γ.X f) are described in the mass balances.
IN f S CIT CIT S LIP LIP S X S IN F V S X Y Y Y V f S S dt d IN − + + − = / / / 1 1 1 . µ π π (1) IN f N N IN F V N X V f N N dt d = IN −ρ − . (2) IN f f f F V X X X dt d − = .µ (3)
(
)
IN L f LIP L F V X X X dt d = π +γ µ − . (4) IN f CIT F V CIT X CIT dt d = − .π
(5) Sample IN F F dt dV = − (6)Version postprint
A
c
c
e
p
te
d
P
r
e
p
r
in
t
S and IN N (g.LIN-1) hold for the input concentration of glucose and nitrogen, respectively.
The term F (L.hIN -1) considers the inputs to the reactor which is mathematically defined as the
sum of the input flow rate of glucose IN S f and nitrogen IN N f as IN IN N S IN f f F = + . The volume equation (6) includes a term FSample to take into account sampling volumes. The terms YX/S,
S LIP
Y / , and YCIT/S are the yield coefficients (g.g-1) for functional biomass, lipids, and citric acid production with respect to glucose, respectively. Growth rate, lipid production rate, and the citric acid production rate, are represented by µ ,
π
LIP, and πCIT respectively, whereas the nitrogen uptake rate is ρN. For consistency with experimental data, total Biomass concentration (XT) is accounted as the sum of the functional biomass (without the structural lipid part) and lipid biomass as,(
)
Lf
T X X
X = 1−γ + (7) Growth rate μ was defined to take into account the dependency of yeast growth on carbon and nitrogen sources. The impact of nitrogen on growth and lipid accumulation is further detailed. This nitrogen effect has been studied on yeast and fungus by kinetic models (Economou et al., 2011; Papanikolaou et al., 2006; Ykema et al., 1986), and in microalgae by the definition of intracellular quotas as in the Droop model (Droop, 1968; Mairet et al., 2011). In this context, two macroscopic models are here developed based on equations (1 – 7).
2.6. Unstructured Model
The unstructured model assumes that external nitrogen is taken up directly for the production of biomass. Therefore, in the growth rate (μ), the uptake of carbon and nitrogen is described by a double substrate limitation with sugar inhibition as,
Version postprint
A
c
c
e
p
te
d
P
r
e
p
r
in
t
where KS,1, and K are the saturation constants for glucose and nitrogen, respectively, N µmax is the specific maximum growth rate, and kI,1 is the glucose inhibition constant. In addition,
the nitrogen uptake rate (ρN) is considered to be proportional to growth rate,
N X N Y / 1 µ ρ = (9) where YX/N is the yield coefficient for functional biomass production with respect to nitrogen.
The specific lipid accumulation rate πLIP was assumed to follow Andrew’s equation for glucose. Nitrogen depletion was considered by an inhibition constant (k1) ensuring that lipid accumulation is low at high concentrations of nitrogen as developed by (Economou et al., 2011). Moreover, an inhibition by citric acid was added to include a competition with the production of citric acid.
+ + + + = CIT k k N k k k S S K S I S LIP LIP 2 2 1 1 2 , 2 2 , max π π (10)
The term πLIP is the maximum lipid production rate. KS,2, kI,2, and k2 represent the saturation and inhibition constants for glucose, and the inhibition constant due to citric acid concentration, respectively.
Citric acid production occurs as overflow metabolism under nitrogen starvation or limitation conditions and excess of carbon substrate (i.e. glucose). This implies a decrease on the production rate of functional biomass (μ) and a stabilization of lipid production rate (
π
LIP). Therefore, it can be assumed that when the Glucose Uptake Rate for lipids and biomass ( GUR ) decreases to a minimum point X Of , cells switch to overflow metabolism. US LIP LIP S X X Y Y GUR / / 1 1 π µ + = (11)
Version postprint
A
c
c
e
p
te
d
P
r
e
p
r
in
t
Hence, glucose uptake rate and the saturation point Of can be used to deduce an indicator U( Ind ) of overflow metabolism (Amribt et al., 2013). U ≤ > = U X U X U Of GUR Of GUR Ind , 1 , 0 (12)
The indicator Ind is defined as Boolean for which U IndU =1 assumes overflow. Citric acid production rate (πCIT) is therefore described by this indicator as,
(
)
+ + + = CIT k k k S S K S Ind I S U CIT CIT 3 3 3 , 2 3 , max π π (13) Additionally, the citric acid production rate also considers an inhibition due to citric acid. The maximum citric acid production rate is indicated by πCITmax, whereas the saturation and inhibition constants for glucose, and the inhibition constant for citric acid are KS,3, kI,3, and k3, respectively.
2.7. Intracellular Quota Model
In this work, it is assumed that the Droop model (Droop, 1968) used for microalgae on heterotrophic conditions can also be applied for yeasts. The main characteristic of this model is the inclusion of variable yield coefficients called quotas. In this way, the Droop model provides regulation where the internal quota of a limiting substrate drives the production of functional biomass (Mairet et al., 2011).
Microbial growth is modulated by the internal nitrogen quota q (Droop, 1968), defined by N N N N q q dt d =
ρ
−µ
(14)Version postprint
A
c
c
e
p
te
d
P
r
e
p
r
in
t
+ + − = 1 , 2 1 , 0 * 1 I S N K S S k S q Q µ µ (15) where Q is the minimum nitrogen quota at which cell growth is possible, and0 µ* is the theoretical maximum growth rate. The nitrogen uptake rate ρN is given by + = N K N N N N . max ρ ρ (16) where K is the nitrogen saturation constant, and N max
N
ρ is the maximum nitrogen uptake rate. The lipid accumulation rate,
π
LIP, was also described by Andrew’s equation for glucose. An inhibitory effect on citric acid was also included as in (10). Moreover, it is assumed that lipid production decreases as the lipid content reaches its theoretical maximum (De la Hoz Siegler et al., 2011; Surisetty et al., 2010a; Yoo et al., 2014). + − + + = CIT k k X X k S S K S T L I S LIP LIP 2 2 2 , 2 2 , max 1 1 . α π π (17) The termα represents the maximum lipid content, which is 0.36 gL.gXT-1 for Yarrowia
lipolytica W29 (Beopoulos et al., 2009; Ratledge and Wynn, 2002). The overflow to produce
citric acid is the result of an excessive substrate supply. In this context, the carbon uptake for lipids and functional biomass must encounter a saturation point. It is known that lipid accumulation in yeast depends on the N/C ratio of the inflow rate of nitrogen and carbon (Beopoulos et al., 2009; Cescut, 2009; Ochoa-Estopier and Guillouet, 2014; Sitepu et al., 2014; Ykema et al., 1986). The critical values for the N/C ratio at which citric acid is produced concomitantly with lipids have been reported at 0.021 molN.Cmol−1 (Ochoa-Estopier and
Guillouet, 2014) for D-stat experiments, and identified at 0.077 molN.Cmol−1
(Robles-Rodriguez et al., 2017) after model identification. In addition to the input flow rates, some studies have focused on the changes of the consumption rate of the N/C ratio, which is related to the intracellular change of N/C. Based on these ideas, it is straightforward to think that there
Version postprint
A
c
c
e
p
te
d
P
r
e
p
r
in
t
exists a critical quota (qN*), where the process shifts towards citric acid overflow. Therefore,it is possible to assume that citric acid is produced when qN is lower than a critical value qN*.
In order to keep consistency with the formulation of (13), a Boolean indicator (IndQ) is also proposed as, ≤ > = * , 1 * , 0 N N N N Q q q q q Ind (18)
Therefore, citric acid production occurs when qN ≤qN *. Citric acid production rate, πCIT , was then taken as in (13) in which the Boolean indicator Ind was replaced by U IndQ,
(
)
+ + + = CIT k k k S S K S Ind I S Q CIT CIT 3 3 3 , 2 3 , max . . π π (19) The difference to the unstructured model relies on the manner of computing the indicator.Summarizing, the unstructured model describes 6 state variables whose dynamics are represented by equations (1 – 6), and their kinetics by equations (8 – 13). The resulting model has 18 parameters. The quota based model has also 18 parameters with 7 mass balance equations: 6 state variables (equations 1 – 6), and the intracellular nitrogen quota (equation 14). Kinetics are disclosed on equations (15 – 19). The total biomass is evaluated by equation (7) for both models. The calibration and validation of the models are presented in the next section.
3. RESULTS AND DISCUSSIONS 3.1. Model calibration
Parameter calibration was carried out by a Particle Swarm Optimization (PSO) algorithm (Eberhart and Kennedy, 1995), and further refined by Pattern Search (Lewis and Torczon, 1996) implemented in MATLAB®. The data of Culture A and Culture B (t=0 – 38h) were used
Version postprint
A
c
c
e
p
te
d
P
r
e
p
r
in
t
A, whereas the estimation with the quota model is in better agreement with the experimental data. Both models display small underestimation in lipids and citric acid concentration at the end of culture A. This is due to the estimation trade-off between the data from both cultures where lipids and citric acid concentrations are smaller for culture B than for culture A. In Figure 3 b, it is observed that when nitrogen was depleted (21 h for the quota and 23 h the unstructured model) functional biomass was no longer produced. This could be explained regarding some of the assumptions of the models. The unstructured model assumed that growth was based on glucose and nitrogen consumption; thus when nitrogen was depleted the total biomass would have increased due to lipids accumulation. On the other hand, the quota model assumed that there is a minimum nitrogen quota Q to assure growth, which was reached subsequently to 0
the extracellular nitrogen depletion causing a stabilization of functional biomass. Nevertheless, the results indicate that functional biomass concentration continued to rise probably due to the storage of other compounds that were not measured (i.e. carbohydrates). The overflow indicators (Ind or U IndQ) are displayed for both cultures (Figure 3), where it is shown that the unstructured model started before due to the differences on the depleted nitrogen for both cultures.
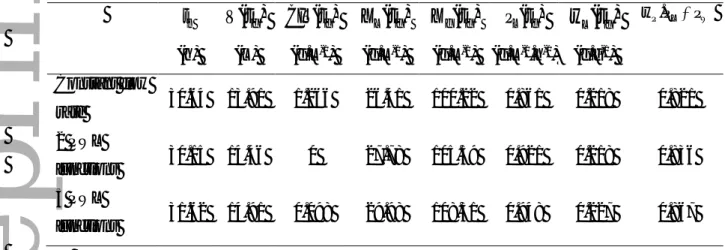
The estimated parameters for both models are presented in Table I and compared with previous values reported in the review of Papanikolaou and Aggelis, (2011a). The values of
max
µ , πLIPmax, and YLIP/S were also experimentally identified for culture A. The theoretical maximum growth rate µ for the quota model is higher than the one obtained experimentally, * as expected since it depends on the maximum and minimum values of the quota. In the unstructured model, µmax is close but also higher than the experimental value due to the glucose inhibition term. With respect to the values of the specific production rates πLIPmax, they were consistent with the parameters estimated by (Fakas et al., 2009), and the experimental
Version postprint
A
c
c
e
p
te
d
P
r
e
p
r
in
t
values. Moreover, lipid yields YLIP/S were also consistent with the experimental values. With respect to the parameters affecting citric acid, the estimated maximum specific production ratemax
CIT
π and the yields YCIT/Swere higher than the reported in literature (Papanikolaou et al., 2008), which could be explained by the high production of citric acid when glucose was added continuously and the differences on the kinetic equations. Regardless their differences in structure, both models reported similar results in the non-growth related parameters. The main distinction was observed on the saturation constant for nitrogen K , where the higher value N
on the quota model is compensated by the nitrogen quota and it is almost equivalent to YX/N. This was expected since the equations of nitrogen uptakes for both approaches (Unstructured (9) and Quota model (16)) are different. The values of the inhibition constants (Table I) show that the glucose inhibition effect differs in magnitude between citric acid production, lipid accumulation, and growth. The estimated value of the critical quota (qN*) was interestingly
found to be similar to the critical value of the N/C ratio reported by (Robles-Rodriguez et al., 2017).
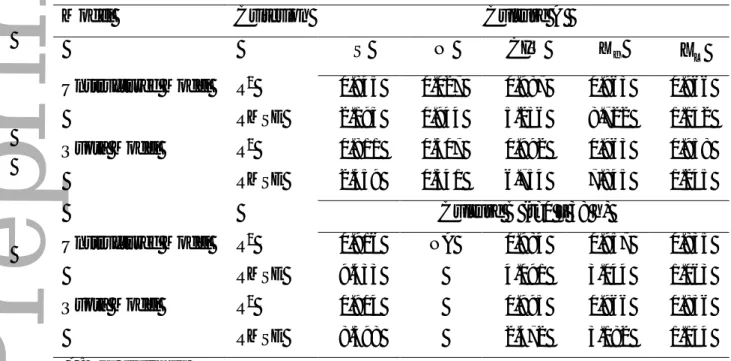
The determination coefficient R2, and the Root Mean Squared Errors (RMSE) were calculated to prove the quality and the enforcement of each model (Table II). The results for nitrogen in culture B (nitrogen starvation culture) are not reported since nitrogen data was not available. The results of the RMSE and R2 demonstrate similar conclusions for the different
variables, which are also consistent with Figure 3. With respect to the RMSE for culture A, it is seen that the unstructured model presented smaller values for citric acid and glucose, whereas the quota model was better for functional biomass, nitrogen and lipid concentrations. For culture B, the RMSE values for glucose and citric acid concentrations were smaller for the
Version postprint
A
c
c
e
p
te
d
P
r
e
p
r
in
t
Culture B (t = 38 – 80h) and culture C were used to validate the model, considering sequential carbon feeding cultures under nitrogen starvation. The validation results of the two models are displayed in Figure 4. Both models presented good agreement with the experimental data where a similar performance is observed for both validation cultures. It is worth noting that experimental data for nitrogen concentration was not available for culture B, and only the initial point of culture C was known from the initial medium composition.
In Figure 4, functional biomass concentration was stable after nitrogen depletion due to the growth dependency on the nitrogen source availability. The main differences between models were observed on nitrogen concentrations, for which no comparison could be made due to the lack of data. However, this difference was reflected on the shift to overflow metabolism identified by the indicators in equations (12) and (18) for the unstructured and the quota model, respectively. The switching times for overflow in culture B (Figure 4 a) were at 21 h for the quota model and at 23 h for the unstructured model. The difference between switching times were also observed for culture C (Figure 4 b) and culture A (Figure 3 a). However, this difference is bigger on culture A. This can be explained by the two different phenomena acting on the cell metabolism: nitrogen limitation or nitrogen starvation.
Statistical analysis was also performed for both models with the validation cultures, whose results are depicted in Table III. The values of the RMSE showed that the quota model performed better estimation for glucose and functional biomass concentrations, whilst citric acid was lower with the unstructured model, and similar results were reported for lipid concentrations in culture B. These results for RMSE were maintained for culture C.
To strengthen the validity of our model, in silico simulations were challenged against published experimental data of different strains of Yarrowia lipolytica growing on glucose under batch conditions (Kavšček et al., 2015; Papanikolaou et al., 2006; Papanikolaou et al., 2008; Papanikolaou et al., 2009). The comparison of results is displayed in Figure 5. Our model
Version postprint
A
c
c
e
p
te
d
P
r
e
p
r
in
t
was able to reproduce accurately the experiments reported in the literature. However, the model predicted higher lipid concentrations when initial glucose concentration was high (150 g.L-1).Additionally, the model was tested to represent the dynamics of a mutant strain of Y. lipolytica where results demonstrated the strong predictive capabilities of the model (See Supplementary Material D).
The proposed models captured the underlying dynamics of Yarrowia lipolytica keeping track of the variations in concentrations of two different types of cultures and two phenomena on the cell metabolism. The models were capable of identifying overflow metabolism, which depends on both the carbon and nitrogen source. Overflow is not occurring if extracellular nitrogen is not depleted or if the critical intracellular nitrogen quota is not reached. However, the level of nitrogen limitation directly affects lipid accumulation. Special care should be payed to the feeding profiles of carbon and nitrogen to have a proper value of N/C ratio allowing maximization of lipids. Therefore, a control strategy to define the optimal feeding rates is needed. In this context, the quota model was selected to evaluate a control strategy aiming at maximizing lipid accumulation by manipulating the feeding profiles of nitrogen and glucose. This choice was based on the lower RMSE values for glucose concentrations with the quota model for all the cultures, and the better description of extracellular nitrogen for Culture A, which are essential for regulating the N/C ratio.
3.3. Optimization of lipid accumulation
In fed-batch conditions, the optimization problem focusses on determining the feed rate policies for the substrates during the entire period of operation maximizing an objective function defined in terms of the status of the bioreactor. Until now, there has been a considerable amount of research about yeast cell culture optimization to avoid overflow
Version postprint
A
c
c
e
p
te
d
P
r
e
p
r
in
t
experiencing overflow, such as Yarrowia lipolytica, where it is necessary to avoid citric acid formation to favor lipid accumulation. Hereof, maximizing lipid production could be achieved by a careful determination of the feeding profiles of glucose and nitrogen to maintain the quota
qN near to the identified value of the critical quota qN*. Optimizing lipid accumulation in yeast
fed-batch cultures can be seen as a two-fold objective at a final fermentation time ( tf ). The first objective is the maximization of the lipid productivity at a final time of operation,
( )
f f L L t t X P = (20)The second objective is the production of high lipid content biomass. In order to do it, let us consider the lipid content fraction of biomass as
( )
T L L X X t
w = , and a target lipid content wL,max
, which are put together into a new normalized variable P as, W
( )
max , L f L W w t w P = (21)where the target lipid fraction was set to wL,max = 0.36 (g.g-1), which is the maximum
theoretical value (Beopoulos et al., 2009). The multi-objective problem is defined as,
W L t ,f fSIN NIN f w P P + . max P , (22) Subject to:
( )
( )
= ≤ ≤ ≤ ≤ ≤ ≤ < < < < − f PWL N N S S f f f n n f f f f t t t V V V N t N S t S Eq Eq IN IN IN IN , 0 , 0 , , , ) 14 ( ) 7 1 ( max max max min max 0 max maxThe parameter wP is a weight coefficient to favor a high lipid content and it was identified from constant flow rates and fixed to 0.25. The quota model was used to determine the optimal inputs and to predict the response of the state variables. Even if the model allows to expressing the accumulated lipids XLA, the term of total lipids XL =XLS +XLA was preferred to keep
Version postprint
A
c
c
e
p
te
d
P
r
e
p
r
in
t
consistency with literature values. Additionally, the results of using XLA or X were the same Lsince the structural lipids XLS =γ.Xf are proportional to the functional biomass. Initial conditions of the state variables were taken from Culture A (Supplementary Material C). The final fermentation time was set between 20 and 90 h. The maximum allowed residual concentrations of glucose Smax and nitrogen Nmax at the end of the culture were set to 2 g.L-1,
and 0.1 g.L-1, respectively. The volume was bounded the initial value V0 = 8 L to the maximum
volume of the bioreactor Vmax = 15 L. The upper limits for flow rates of carbon
max IN S f and nitrogen max IN N
f sources were fixed to 0.3 L.h -1. A number nPWL of piecewise linear (PWL)
functions were used to parameterize the control IN
S
f and IN
N
f . The optimization was performed with the Pattern Search algorithm of MATLAB®. For the sake of comparison, the
optimization problem was solved for two cases: (i) constant optimal flow rates along the complete culture (nf = 1); and (ii) five piecewise linear functions (nf = 5). The PWL functions
were defined with open time intervals to optimize the time length tf of each linear function between tmin and tmax for a given nf.
Figure 6 shows the optimization results concerning the dynamics of the input variables to maximize the objective functions and the prediction of the state variables from the quota model. The constant input flow rates were: 0.162 L.h-1 for glucose, and 0.021 L.h-1 for nitrogen. The
use of these constant optimal flow rates (dashed lines) led to a constant feeding with N/C ratio of 0.027 molN.Cmol-1, which allowed the production of citric acid. Although the value was
constant, nitrogen limitation occurred around 11.5 h, and was maintained until the end of the culture (30.3 h) where citric acid concentration achieved 1.28 g.L-1. Concerning the
Version postprint
A
c
c
e
p
te
d
P
r
e
p
r
in
t
for lipid accumulation. Finally, the glucose feeding decreased with two different slopes to fulfill the condition of residual glucose. Nitrogen feeding had a similar trend to glucose, where the second piecewise decreases the nitrogen feeding to induce nitrogen limitation, which is necessary for enhancing lipid accumulation. After 10 h the feeding rate was increased again at two different slopes for 19h to regulate the N/C ratio and to avoid citric acid production. The nitrogen flow dropped at the end of the culture to assure a low value of residual nitrogen. Concerning the quota, it is observed that for both cases the final values were around the critical quota qN*, which is reflected on the low citric acid concentrations.
The summary of the results of the control strategy are displayed on Table IV to clarify the enforcement of this strategy. Another case was also studied with two piecewise linear functions (nf = 2) to analyze the impact of the quantity of PWL functions (See supplementary material
B). Table IV shows that the three compared cases reported high biomass content, which is important for harvesting the cells at the end of the culture. The use of piecewise linear functions increased 1.1 times productivity and 1.04 times lipid content fraction with respect to an operation at constant flow rates. These results suggested that a constant flow rate could be used, but should be avoided if citric acid production is to be maintained at low values. The performance of 2 PWL functions was slightly better to the constant flow rates, which supports the use of a higher number of piecewise linear function for optimizing both objectives. Literature values of lipid content fraction and volumetric productivity were reported from 0.17 to 0.25 g.g-1 and from 0.08 to 0.27 g.L-1.h-1, respectively (Aggelis and Komaitis, 1999;
Beopoulos et al., 2009; Cescut, 2009; Ochoa-Estopier, 2012). Even if our results are encouraging for being competitive with the literature results, the real implementation of the developed control strategy is needed to have a fair comparison. For that, the development of software sensors, which are challenging and time demanding, is required to reconstruct the
Version postprint
A
c
c
e
p
te
d
P
r
e
p
r
in
t
state variables of the model. This will allow the proper monitoring of system and the correction of model uncertainties.4. CONCLUSIONS
An unstructured model based on Monod and inhibition kinetics and a model based on Droop quotas were developed to describe the accumulation of lipids and the production of citric acid on Yarrowia lipolytica on fed-batch and sequential batch cultures. The results of both models showed good agreement with the calibration and validation experimental data sets. Parameters from both models were consistent with literature values. Even if both models presented similar goodness-of-fit, the quota model was selected to develop a model based optimization of lipid accumulation due to a better description of residual glucose and extracellular nitrogen concentrations, which was important for the accurate manipulation of the N/C ratio. Two objectives were maximized: lipid productivity and lipid content fraction. Optimization results indicated that it would be possible to produce higher values than the literature proving the effectiveness of the control strategy. Further work need to deal with the experimental implementation to validate the simulation results of the presented control strategy.
SUPPLEMENTARY MATERIAL
A. Figures of the Internal Quota for the different cultures. B. Information on optimization results.
C. Initial conditions of Experiments for calibration and validation.
D. Assessment of the predictive capabilities of the quota model to represent the dynamics of
the mutant strain Yarrowia lipolytica JMY3501
Version postprint
A
c
c
e
p
te
d
P
r
e
p
r
in
t
French financial support by Tereos, Agence Nationale de la Recherche, and Commissariat aux Investissements d'Avenir via the Project (ref. ANR-11-BTBT-0003) ProBio3: Biocatalytic production of lipid bioproducts from renewable resources and industrial by-products: Biojet Fuel Application.
REFERENCES
Abdollahi J, Dubljevic S. 2012. Lipid production optimization and optimal control of heterotrophic microalgae fed-batch bioreactor. Chem. Eng. Sci. 84:619–627. Adesanya VO, Davey MP, Scott SA, Smith AG. 2014. Kinetic modelling of growth and
storage molecule production in microalgae under mixotrophic and autotrophic conditions. Bioresour. Technol. 157:293–304.
Aggelis G, Komaitis M. 1999. Enhancement of single cell oil production by Yarrowia lipolytica growing in the presence of Teucrium polium L. aqueous extract. Biotechnol.
Lett. 21:747–749.
Amribt Z, Niu H, Bogaerts P. 2013. Macroscopic modelling of overflow metabolism and model based optimization of hybridoma cell fed-batch cultures. Biochem. Eng. J.
70:196–209.
Arzumanov TTE, Sidorov IIA, Shishkanova NVN, Finogenova TT V. 2000. Mathematical modeling of citric acid production by repeated batch culture. Enzyme Microb. Technol.
26:826–833.
Barth G, Gaillardin C. 1997. Physiology and genetics of the dimorphic fungus Yarrowia lipolytica. FEMS Microbiol. Rev. 19:219–37.
Beopoulos A, Cescut J, Haddouche R, Uribelarrea J-L, Molina-Jouve C, Nicaud J-M. 2009. Yarrowia lipolytica as a model for bio-oil production. Prog. Lipid Res. 48:375–387. Cescut J, Severac E, Molina-Jouve C, Uribelarrea JL. 2011. Optimizing pressurized liquid
Version postprint
A
c
c
e
p
te
d
P
r
e
p
r
in
t
1218:373–379.Cescut J. 2009. Accumulation d’acylglycérols par des espèces levuriennes à usage carburant aéronautique: physiologie et performances de procédés; PhD Thesis. Institut National des Sciences Appliquées de Toulouse. http://www.theses.fr/2009ISAT0022
Droop MR. 1968. Vitamin B12 and marine ecology. The kinetics of uptake, growth and inhibition in monochrysis Lutheri. J. Mar. Assoc.:689–733.
Eberhart R, Kennedy J. 1995. A new optimizer using particle swarm theory. MHS’95. Proc.
Sixth Int. Symp. Micro Mach. Hum. Sci.:39–43.
Economou CNCN, Aggelis G, Pavlou S, Vayenas DV V. 2011. Modeling of single-cell oil production under nitrogen-limited and substrate inhibition conditions. Biotechnol.
Bioeng. 108:1049–55.
Fakas S, Stamatina M, Aggelis G. 2009. Single cell oil and gamma-linolenic acid production by Thamnidium elegans on raw glycerol. In: NY: Nova Science Publishers, editor.
Aggelis G, Ed. Microb. conversions raw glycerol, pp. 85–100.
Kavšček M, Bhutada G, Madl T, Natter K. 2015. Optimization of lipid production with a genome-scale model of Yarrowia lipolytica. BMC Syst. Biol. 9:72.
De la Hoz Siegler H, Ben-Zvi A, Burrell RE, McCaffrey WC. 2011. The dynamics of heterotrophic algal cultures. Bioresour. Technol. 102:5764–74.
Lemesle V, Mailleret L. 2008. A Mechanistic Investigation of the Algae Growth “Droop” Model. Acta Biotheor. 56:87–102.
Lewis RM, Torczon V. 1996. Pattern Search algorithms for bound constrained minimization.
SIAM J. Optim.
Version postprint
A
c
c
e
p
te
d
P
r
e
p
r
in
t
Meeuwse P, Akbari P, Tramper J, Rinzema A. 2012. Modeling growth, lipid accumulation and lipid turnover in submerged batch cultures of Umbelopsis isabellina. Bioprocess
Biosyst. Eng. 35:591–603.
Meeuwse P, Tramper J, Rinzema A. 2011. Modeling lipid accumulation in oleaginous fungi in chemostat cultures: I. Development and validation of a chemostat model for
Umbelopsis isabellina. Bioprocess Biosyst. Eng. 34:939–49. Nicaud JM. 2012. Yarrowia lipolytica. Yeast 29:409–418.
Nicaud J-M, Madzak C, Broek P, Gysler C, Duboc P, Niederberger P, Gaillardin C. 2002. Protein expression and secretion in the yeast Yarrowia lipolytica. FEMS Yeast Res.
2:371–379.
Ochoa-Estopier A. 2012. Analyses systématique des bascules métaboliques chez les levures d’intérêt industriel: application aux bascules du métabolisme lipidique chez Yarrowia lipolytica; Institut National des Sciences Appliquées de Toulouse.
Ochoa-Estopier A, Guillouet SE. 2014. D-stat culture for studying the metabolic shifts from oxidative metabolism to lipid accumulation and citric acid production in Yarrowia lipolytica. J. Biotechnol. 170:35–41.
Papanikolaou S, Aggelis G. 2002. Lipid production by Yarrowia lipolytica growing on industrial glycerol in a single-stage continuous culture. Bioresour. Technol. 82:43–49. Papanikolaou S, Aggelis G. 2003a. Modelling aspects of the biotechnological valorization of
raw glycerol: production of citric acid by Yarrowia lipolytica and 1,3-propanediol by Clostridium butyricum. J. Chem. Technol. Biotechnol. 78:542–547.
Papanikolaou S, Aggelis G. 2003b. Modeling lipid accumulation and degradation in Yarrowia lipolytica cultivated on industrial fats. Curr. Microbiol. 46:398–402.
Papanikolaou S, Aggelis G. 2009. Biotechnological valorization of biodiesel derived glycerol waste through production of single cell oil and citric acid by Yarrowia lipolytica. Lipid
Version postprint
A
c
c
e
p
te
d
P
r
e
p
r
in
t
Technol. 21:83–87.Papanikolaou S, Aggelis G. 2011a. Lipids of oleaginous yeasts. Part II: Technology and potential applications. Eur. J. Lipid Sci. Technol. 113:1052–1073.
Papanikolaou S, Aggelis G. 2011b. Lipids of oleaginous yeasts. Part I: Biochemistry of single cell oil production. Eur. J. Lipid Sci. Technol. 113:1031–1051.
Papanikolaou S, Chatzifragkou A, Fakas S, Galiotou-Panayotou M, Komaitis M, Nicaud J-MM, Aggelis G. 2009. Biosynthesis of lipids and organic acids by Yarrowia lipolytica strains cultivated on glucose. Eur. J. Lipid Sci. Technol. 111:1221–1232.
Papanikolaou S, Galiotou-Panayotou M, Chevalot I, Komaitis M, Marc I, Aggelis G. 2006. Influence of glucose and saturated free-fatty acid mixtures on citric acid and lipid production by Yarrowia lipolytica. Curr. Microbiol. 52:134–142.
Papanikolaou S, Galiotou-Panayotou M, Fakas S, Komaitis M, Aggelis G. 2008. Citric acid production by Yarrowia lipolytica cultivated on olive-mill wastewater-based media.
Bioresour. Technol. 99:2419–2428.
Rakicka M, Lazar Z, Dulermo T, Fickers P, Nicaud JM. 2015. Lipid production by the
oleaginous yeast Yarrowia lipolytica using industrial by-products under different culture conditions. Biotechnol. Biofuels 8:104.
Ratledge C. 2004. Fatty acid biosynthesis in microorganisms being used for Single Cell Oil production. Biochimie 86:807–15.
Ratledge C, Wynn JP. 2002. The biochemistry and molecular biology of lipid accumulation in oleaginous microorganisms. Adv. Appl. Microbiol. 51:1–51.
Renard F, Vande Wouwer A. 2008. Robust adaptive control of yeast fed-batch cultures.
Version postprint
A
c
c
e
p
te
d
P
r
e
p
r
in
t
accumulation and citric acid prodiction by Yarrowia lipolytica. Comput. Chem. Eng.
100:139–152.
Santos LO, Dewasme L, Coutinho D, Wouwer A Vande. 2012. Nonlinear model predictive control of fed-batch cultures of micro-organisms exhibiting overflow metabolism: Assessment and robustness. Comput. Chem. Eng. 39:143–151.
Sitepu IR, Garay LA, Sestric R, Levin D, Block DE, German JB, Boundy-Mills KL. 2014. Oleaginous yeasts for biodiesel: current and future trends in biology and production.
Biotechnol. Adv. 32:1336–60.
Surisetty K, Hoz Siegler HD la, McCaffrey WC, Ben-Zvi A. 2010a. Model re-parameterization and output prediction for a bioreactor system. Chem. Eng. Sci.
65:4535–4547.
Surisetty K, De la Hoz Siegler H, McCaffrey WC, Ben-Zvi A. 2010b. Robust modeling of a microalgal heterotrophic fed-batch bioreactor. Chem. Eng. Sci. 65:5402–5410.
Valentinotti S, Srinivasan B, Holmberg U, Bonvin D, Cannizzaro C, Rhiel M, von Stockar U. 2003. Optimal operation of fed-batch fermentations via adaptive control of overflow metabolite. Control Eng. Pract. 11:665–674.
Ykema A, Verbree EC, Van Verseveld HW, Smit H. 1986. Mathematical modelling of lipid production by oleaginous yeasts in continuous cultures. Antonie Van Leeuwenhoek
52:491–506.
Yoo SJ, Kim JH, Lee JM. 2014. Dynamic modelling of mixotrophic microalgal
photobioreactor systems with time-varying yield coefficient for the lipid consumption.
Version postprint
A
c
c
e
p
te
d
P
r
e
p
r
in
t
NOMENCLATURECIT Citric acid concentration [g.L-1]
IN
N
f Input flow rate of nitrogen [L.h-1]
max
IN
N
f Maximum input flow rate of nitrogen [L.h-1]
IN
S
f Input flow rate of glucose [L.h-1]
max
IN
S
f Maximum input flow rate of glucose [L.h-1]
IN
F Input flow rate [L.h-1]
Sample
F Output flow rate[L.h-1]
X
GUR Glucose uptake rate [gS.gXf-1h-1]
Q
Ind Overflow indicator in Quota model [-]
U
Ind Overflow indicator in Unstructured model [-]
i S
K , Saturation constants of glucose [gS.L-1]
N K Saturation constant of N [gN.L-1] i k Inhibition constants [g.L-1] n Number of data [-] f
n Number of Piecewise linear functions
N Nitrogen concentration [g.L-1]
max
N Maximum residual nitrogen concentration [g.L-1]
IN
N Nitrogen input concentration [g.L-1]
U
Of Overflow saturation constant [gS.gXf -1h-1] L
Version postprint
A
c
c
e
p
te
d
P
r
e
p
r
in
t
Nq Internal nitrogen quota [gN.gXT-1]
qN* Critical quota for citric acid formation [molN.Cmol-1]
S Glucose concentration [g.L-1]
max
S Maximum residual glucose concentration [g.L-1]
f
t Final optimal time [h]
min
t Minimum allowed time for the optimization [h]
max
t Maximum allowed time for the optimization [h]
IN
S Glucose input concentration [g.L-1]
V Volume [L] 0 V Initial volume [L] max V Maximal volume [L] L
w Lipid content fraction [g.g-1]
max ,
L
w Maximum theoretical value of lipid content fraction [g.g-1]
P
w weight coefficient to favor a high lipid fraction [-]
T
X Total biomass concentration [g.L-1]
f
X Functional biomass concentration [g.L-1]
L
X Total Lipid biomass concentration [g.L-1]
LA
X Accumulated lipid biomass concentration (TAGs) [g.L-1]
LS
X Structural lipid biomass concentration [g.L-1]
S X
Y /
Yield coefficient for functional biomass production with respect to glucose [gXf.gS-1]
S LIP
Y / Yield coefficient for lipid production with respect to glucose [gLIP.gS-1]
S CIT
Version postprint
A
c
c
e
p
te
d
P
r
e
p
r
in
t
YX/NYield coefficient for functional biomass production with respect to nitrogen [gXf.gN-1]
Abbreviations
PSO Particle Swarm Optimization PWL Piecewise linear functions
R2 Correlation Coefficient
RMSE Root Mean Square Error
TAG Triacylglycerol
Greek symbols
α maximum lipid content [gLIP.gXT-1]
γ constant fraction of the functional biomass [gXL.gXf-1]
µ Growth rate [h-1]
max
µ Maximal growth rate on carbon and nitrogen [h-1] *
µ Theoretical maximal growth rate on carbon and nitrogen [h-1] LIP
π Specific rate of lipid accumulation [gLIP. gXf-1h-1]
max
LIP
π Maximal specific rate of lipid accumulation [gLIP.gXf-1h-1] CIT
π Specific rate of citric acid production [gCIT.(gXf-h)-1]
max
CIT
π
Maximal specific rate of citric acid production [gCIT. gXf-1h-1]N
ρ Specific uptake rate of nitrogen [gN. gXf-1h-1]
max
N
ρ
Maximal specific uptake rate of nitrogen [gN. gXf-1h-1]Superscripts
Version postprint
A
c
c
e
p
te
d
P
r
e
p
r
in
t
max Maximum Operators 𝑑𝑑 𝑑𝑑𝑑𝑑Derivative of a variable with respect to time max Maximization
Version postprint
A
c
c
e
p
te
d
P
r
e
p
r
in
t
Table I. Estimated parameters for the fed-batch cultures of Yarrowia lipolytica.Parameter This work References
Unstruc Quota max µ [h-1] * µ [h-1] 0.415 - - 0.755 0.26 0.18-0.36 0.566 Culture Aa
(Papanikolaou and Aggelis, 2003b)b (Economou et al., 2011)d max LIP π [gLIP.(gXf-h)-1] 0.030 0.039 0.034 0.028 0.0027 Culture Aa (Fakas et al., 2009)c (Papanikolaou et al., 2006)b max CIT π [gCIT.(gXf-h)-1] 0.301 0.314 0.035-0.13 0.013
(Papanikolaou and Aggelis, 2003a)b (Papanikolaou et al., 2008)b
S X
Y / [gXf.gS -1]
0.603 0.519 0.78 – 0.86 (Papanikolaou and Aggelis, 2003b)b
S LIP Y / [gLIP.gS -1] 0.276 0.272 0.23 0.63-0.86 Culture Aa
(Papanikolaou and Aggelis, 2003b)b
S CIT
Y / [gCIT.gS-1]
0.88 0.89 0.63
0.45-0.82
(Papanikolaou and Aggelis, 2003a)b (Papanikolaou et al., 2008)b N X Y / [gXf.gN -1] 23.23 - 31.9-33.6 39.3 18.21
(Papanikolaou and Aggelis, 2003a)b (Fakas et al., 2009)c (Economou et al., 2011)d 1 , S K [gS.L-1] 1.517 1.116 20 1.256 (Fakas et al., 2009)c (Economou et al., 2011)d 2 , S K [gS.L-1] 0.978 1.482 69.27 (Economou et al., 2011)d 3 , S K [gS.L-1] 11.26 12.22 - N K [gN.L-1] 0.074 23.08 0.196 0.179 0.085
(Papanikolaou and Aggelis, 2003a)b (Arzumanov et al., 2000)b (Economou et al., 2011)d 1 k [gN.L-1] 924 - 835 (Economou et al., 2011)d 2 k [gCIT.L-1] 8.3 9.75 - 3 k [gCIT.L-1] 40.44 37.63 - 1 , I k [gS.L-1] 83.14 83.64 20 (Economou et al., 2011)d 2 , I k [gS.L-1] 35.2 44.17 0.399 (Economou et al., 2011)d 3 , I k [gS.L-1] 28.8 40.11 Overflow: OfU [gS.(gXf-h)-1] 0.268 - - Quotas: max N ρ [gN.(gXf-h)-1] - 0.716 - 0 Q [gN.(gXT)-1] - 0.045 -
Version postprint
A
c
c
e
p
te
d
P
r
e
p
r
in
t
Table II. Statistical evaluation of the models on the calibration data sets.
Model Criterion Culture A
S N CIT Xf XL Unstructured Model R2 0.845 0.027 0.987 0.963 0.966 RMSE 2.195 0.944 5.236 8.722 1.142 Quota Model R2 0.811 0.307 0.992 0.963 0.958 RMSE 2.359 0.341 6.754 7.845 1.245 Culture B (t=0 – 38 h) Unstructured Model R2 0.916 NA 0.984 0.957 0.835 RMSE 9.433 4.091 3.044 1.063 Quota Model R2 0.904 0.995 0.966 0.836 RMSE 8.398 2.472 3.182 1.144
Version postprint
A
c
c
e
p
te
d
P
r
e
p
r
in
t
Table III. Statistical evaluation of the models on the validation data set.Model Criterion Culture B (t=38 – 80 h)
S N CIT Xf XL Unstructured Model R2 0.392 NA 0.989 0.622 0.363 RMSE 10.293 7.731 10.368 1.041 Quota Model R2 0.479 0.991 0.476 0.361 RMSE 9.617 9.439 9.836 0.985 Culture C Unstructured Model R2 0.645 NA 0.854 0.973 0.918 RMSE 23.285 2.855 7.303 0.575 Quota Model R2 0.719 0.894 0.949 0.902 RMSE 20.545 3.174 7.695 0.884
Version postprint
A
c
c
e
p
te
d
P
r
e
p
r
in
t
Table IV. Performance of the control strategy.
f t (h) ) (tf V (L) ) (tf CIT (g.L-1) ) ( f L t X (g.L-1) ) ( f f t X (g.L-1) ) ( f L t P (g.L-1.h-1)
)
(
f Lt
w
(g.g-1) W L PP P w . + Constant flow rate 30.64 13.91 1.266 26.41 100.22 0.861 0.218 0.821 2 PWL functions 30.15 14.46 0 27.78 105.59 0.921 0.218 0.836 5 PWL functions 31.62 14.91 0.098 29.98 108.31 0.948 0.227 0.867Version postprint
A
c
c
e
p
te
d
P
r
e
p
r
in
t
Version postprint
A
c
c
e
p
te
d
P
r
e
p
r
in
t
Version postprint
A
c
c
e
p
te
d
P
r
e
p
r
in
t
Version postprint
A
c
c
e
p
te
d
P
r
e
p
r
in
t
Version postprint