HAL Id: hal-00844834
https://hal.archives-ouvertes.fr/hal-00844834v2
Submitted on 14 Feb 2014HAL is a multi-disciplinary open access archive for the deposit and dissemination of sci-entific research documents, whether they are pub-lished or not. The documents may come from teaching and research institutions in France or abroad, or from public or private research centers.
L’archive ouverte pluridisciplinaire HAL, est destinée au dépôt et à la diffusion de documents scientifiques de niveau recherche, publiés ou non, émanant des établissements d’enseignement et de recherche français ou étrangers, des laboratoires publics ou privés.
Consequences of non-respect of the Bedrosian theorem
when demodulating
Christian Pachaud, Timothée Gerber, Marcin Firla, Nadine Martin, Corinne
Mailhes
To cite this version:
Christian Pachaud, Timothée Gerber, Marcin Firla, Nadine Martin, Corinne Mailhes. Consequences of non-respect of the Bedrosian theorem when demodulating. CM 2013 - MFPT 2013 - 10th Inter-national Conference on Condition Monitoring and Machinery Failure Prevention Technologies, Jun 2013, Krakow, Poland. �hal-00844834v2�
Consequences of non-respect of the Bedrosian theorem when
demodulating
Christian Pachaud
Ex-Technical Director at Dynae, now Self Employed +33 (0)5 55 30 34 93
Timothée Gerber, Marcin Firla and Nadine Martin GIPSA-lab
Grenoble Campus, 11 rue des Mathématiques, 38402 Saint Martin D’Hères, France Corinne Mailhes
IRIT-TéSA
Université de Toulouse, 2 rue Charles Camichel, 31071 Toulouse, France
Abstract
Vibration data acquired during system monitoring periods are rich in harmonics characterizing the presence of several mechanical parts in the system. Periodic variations of the torque or of the load create modulation sidebands around those harmonics. Even if the energy impact of the sidebands is small compared to the total energy of the signal, they are strong indicators of failures in mechanical systems. Unfortunately, these effects are of little concern in most condition monitoring systems. When considering the problem from a signal processing point of view, the demodulation of those sidebands allows for a time visualization of the modulating functions which are a precise image of the torque or the load variations. This demodulation can be done on the analytical signal directly derived from the original data. But to do that, data and specifically its spectrum should respect some constraints. The purpose of this paper is to underline those often neglected constraints. In particular, the respect of the non-overlapping condition in the Bedrosian theorem is discussed for signals and modulation rates that can be encountered on rotating machines. The respect of the constraints depends on the monitored phenomenon (e.g., gear mesh, rotating shaft), the modulation phenomenon (e.g., belt frequency, rotor current) and the type of medium (e.g., vibrations, electrical current). In the case where the constraints are not satisfied, we explain the consequences in terms of signal processing. These results are illustrated by an industrial case study.
1. Introduction
The Hilbert transform theory has been known for a long time and was developed by experts from different fields, including electronics, radio, physics, and mathematics. The Bedrosian condition, derived by Bédrosian in (1), is an important issue for applying analytic signal theory. The research on conditions which ensure validity of the Bedrosian identity for the Hilbert transform of a product function f g· is given
in (2). The authors presented sufficient conditions, which are consistent with the classical Bedrosian theorem and provide new insight into the topic.
Traditionally, demodulation is done by an electrical circuit in radio receivers. The analytic signal theory is frequently used in industry and by researchers for demodulation purposes, which is a key point in maintenance applications. Conditions of demodulation application are not always explicit or tend to be badly interpreted. Even in a comprehensive article (3), where the author describes the usage of Hilbert transform applied to mechanical vibration analysis, the limitations of this method during demodulation are not underlined. The author just mentions Bedrosian conditions and the development of the analytic signal theory for system identification, and he does not present any consequences of the usage of overlapping spectra when calculating products of Hilbert transforms for diagnosis purposes.
In condition monitoring, many published papers deal with amplitude and frequency modulation phenomena for component failures (4-6). The authors did not mention Bedrosian theorem. Obviously, there exist also papers, for example (7,8), where authors are aware of the existing restrictions and mentioned the Bedrosian condition but without giving any information concerning the consequences of breaking this rule.
The present paper illustrates the effects arising from non-respecting Bedrosian theorem and is constructed in the following way. Section 2 describes the basis of demodulation using Hilbert transform and gives details about Bedrosian theorem with respect to digital demodulation. Section 3 and Section 4 describe a phase-modulated sinusoidal carrier and a harmonic carrier is conferred on the basis of several examples. Section 5 presents an industrial case study and is followed by conclusions.
2. Demodulation
The demodulation process consists in recovering information contained around a carrier frequency. Contrary to radio communication where the demodulation is historically made by an electronic circuit, the demodulation is generally digital in signal processing applications. Digital demodulation is based on the analytic representation of a signal (3). After a short reminder about analytic signal and Hilbert transform, the Bedrosian theorem will be presented.
2.1 Definitions of an analytic signal and the Hilbert transform
The analytic signal s t is a complex signal constructed from the real signal a
( )
s t and( )
its Hilbert transform ˆs t . It facilitates several mathematical manipulation of the signal,
( )
including the demodulation.( ) ( )
·ˆ( )
a
s t =s t + j s t . (1) where j is the imaginary unit. The Hilbert transform (HT) is computed by the convolution of the signal s t with the function
( )
1 /π t( )
( )
( )
ˆ * 1 s t HT s t s t t π = = (2)where * represents the convolution. Useful Hilbert transforms for demodulation purpose are HT
[
cost]
=sint and HT[
sint]
= − cost.2.2 Digital demodulation and Bedrosian theorem
Let s t be a signal representing a sinusoidal component of frequency
( )
fp modulated both in amplitude and phase by functions m t and( )
ϕ( )
t respectively.( )
( )
cos 2 p( )
s t = A m t π f t+ϕ t (3)
The demodulation process consists in extracting the functions m t and
( )
ϕ( )
t from the signal s . A strategy commonly used to digitally demodulate a signal is to take the module and the phase of the filtered analytic signal. The used filter is a notch filter which suppresses the carrier frequency to be demodulated.By definition, the analytic signal s t is equal to a
( )
( )
( )
cos 2( )
·( )
cos 2( )
.a p p
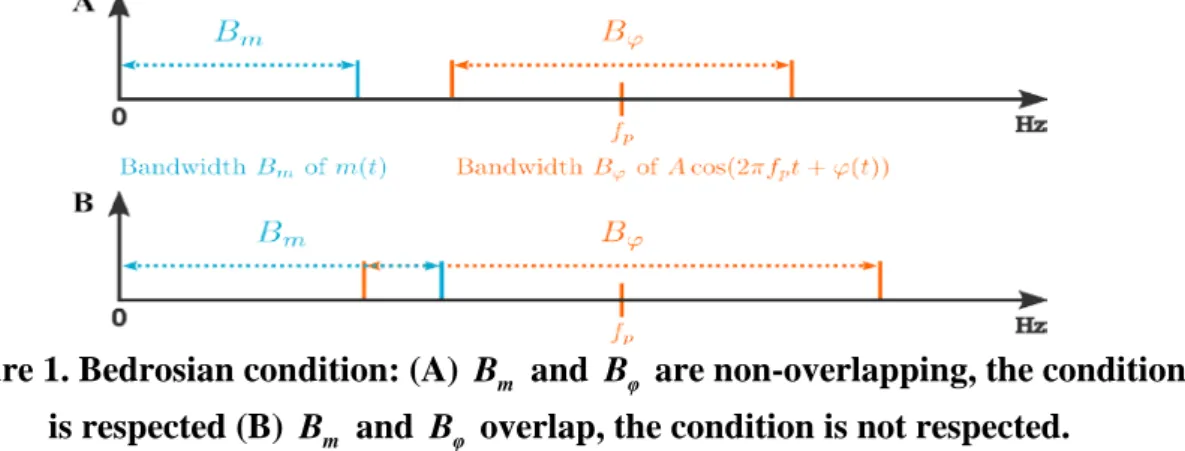
s t =A m t π f t+ϕ t + j HT A m t πf t+ϕ t (4) The imaginary part of equation (4) is the Hilbert transform of a product. Bedrosian theorem (2) assures that the Hilbert transform of a product of a low-pass and a high-pass signal is equal to the product of the low-pass signal and the Hilbert transform of the high-pass signal if, and only if, the spectral support of both function are separate.
[ ]
· ·[ ]
HT f g = f HT g if, and only if, the bandwidth Bf of the low-pass signal f and the bandwidth Bg of high-pass signal g are non-overlapping. In the case of our modulated signal, it means that
( )
cos 2 p( )
( )
sin 2 p( )
HT A m t π f t+ϕ t =A m t π f t+ϕ t , (5) if, and only if, B and m Bϕ are non-overlapping. This condition is illustrated in Fig. 1. Finally, our analytic signal can be written as
( )
( )
(
( )
( )
)
( )
2 ( ) cos 2 ·sin 2 j f tp t a p p s t =A m t πf t+ϕ t + j π f t+ϕ t =A m t e− π +ϕ (6)( )
( )
( ) 2 .j t j f tp a s t =A m t e ϕ e π (7)After using a notch filter to suppress the carrier frequency fp, the modulating functions
( )
m t and ϕ
( )
t can easily be recovered by taking respectively the module and the phase of the analytic signal.Figure 1. Bedrosian condition: (A) B and m Bφ are non-overlapping, the condition is respected (B) B and m Bφ overlap, the condition is not respected.
In telecommunication, the demodulation of sidebands is not a problem. The electromagnetic carrier frequency is very high compared to the bandwidth of the modulating signal. Therefore, the Bedrosian condition is always respected. Is it still the case in a mechanical context where the frequencies are much lower?
3. Single carrier frequency
The bandwidth B is easilly determined. It is equal to the maximum frequency present m
in the modulating signal m t . Determining the bandwidth B
( )
ϕ of the phase modulating function ϕ( )
t is a little trickier.2.1 Phase modulation bandwidth
Let p t be a signal representing a carrier frequency
( )
fp modulated in phase by a sinusoid of frequency f and amplitude m β . This signal can be developed in Fourierseries and can be written as an infinite sum
( )
cos 2 p sin 2(
m)
cos 2k( )
(
p m)
k p t A π f t β πf t A J β π f kf t +∞ = −∞ = + =
∑
+ (8)where Jk
( )
β is the Bessel function of first kind of order k. Therefore, the spectrum of( )
p t is composed by an infinite number of components of frequency fk = fp +k fm
and amplitude Ak =A Jk
( )
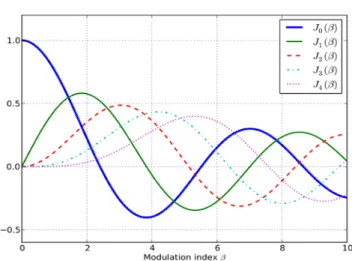
β , where k∈. This spectrum is represented in Fig. 2. The bandwidth Bϕ is then infinite. It means that the Bedrosian condition will never be respected in theory. Nevertheless, in practice, the first pairs of sidebands are the most energetic. From a certain distance to the carrier frequency, the power of sidebandsbecomes negligible. For example, it can be seen in Fig. 3 that for a modulation index β of 1, the amplitude decreases with the order k.
Figure 2. Spectrum representation of a carrier frequency fp modulated in phase
by a sinusoid of frequency f . m
Figure 3. Bessel functions of first kind Jk
( )
β for k∈{
0,1, 2, 3, 4}
.To finally determine the useful bandwidth Bϕ , Carson proposed an empirical rule (1). The main idea is to keep only the spectral components representing 98 % of the modulating signal power.
(
)
2 1 m
Bϕ = β+ f (9)
This relation is widely spread in the literature (10). Nevertheless, Carson established it for β ≤2 only (9). We propose to use a more general relation, working for every value of the modulation index β
2 m
Bϕ = q f , (10)
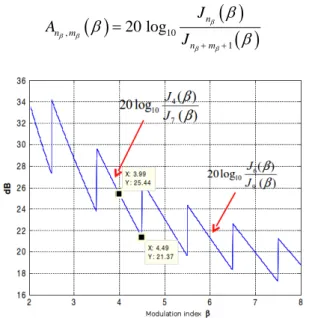
where q is the number of significant pairs of sidebands. The number q is the sum of two integers nβ and mβ: nβ is the rounded value of β to the closest integer and mβ is the minimal number such as the amplitude ratio Anβ, mβ
( )
β between sidebands of ordersidebands that have to be kept after the first nβ ones, before that the further sidebands are considered as negligible. Studying inequality An , m
( )
20 dBβ β β ≥ allows for computation of mβ. Fig. 4 illustrates this study and the results are presented in Table 1.
( )
( )
( )
, 10 1 20 log n n m n m J A J β β β β β β β β + + = (11)Figure 4. Study of the inequality ,
( )
≥ dB 20β β n m
A β for β∈
[ ]
2;8 and mβ =2. The discontinuities are due to the integer part. The inequality is verified for β 5≤ .Table 1. Number of significant sidebands according to the modulation index.
β n mβ q 0 1 1 1 1 2 2 ≤nβ ≤ 4 2 4 ≤ ≤q 6 5 ≤nβ ≤ 12 3 8 ≤ ≤q 15 13 ≤nβ ≤ 26 4 17 ≤ ≤q 30 27 ≤nβ ≤ 47 5 32 ≤ ≤q 52
Considering that the maximum frequency of the amplitude modulation is equal to the phase modulation frequency, which is a reasonable hypothesis for a mechanical system, it is possible to finally write the Bedrosian condition in the following way
2 2 2 1 p m m p m p m f B qf B f f f f q ϕ + ≤ ⇔ + ≤ ⇔ ≤ + (12) 2.2 Examples
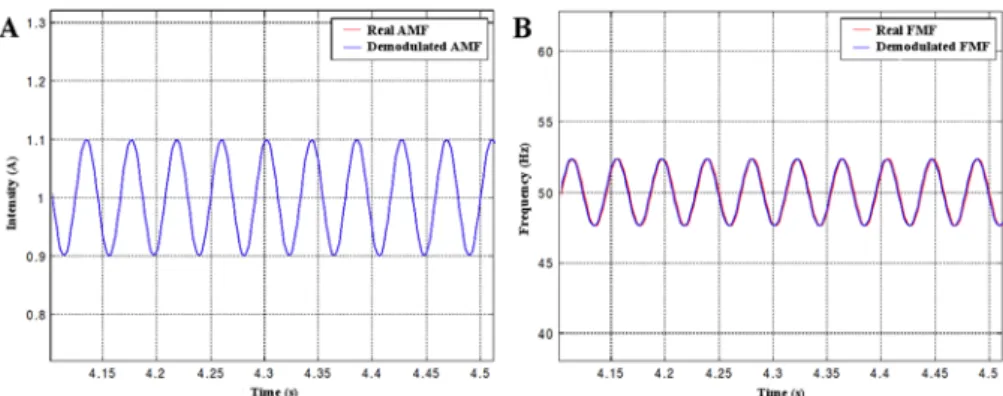
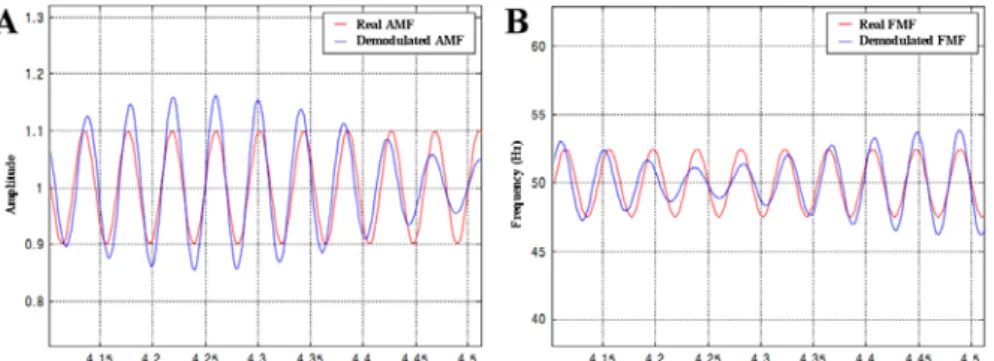
Fig. 5 and Fig. 6 illustrate the importance of respecting the Bedrosian condition when demodulating. They represent both the real and demodulated amplitude modulation function (AMF) and frequency modulation function (FMF) of the signal s t of
( )
equation (3), without any noise. The carrier frequency fp =50 Hz and the modulating frequency fm =24 Hz are common to both figures. Only the value of the modulation index β changes. In Fig. 5, β =0.1 which imply that q=1 according to Table 1. Therefore, the Bedrosian condition is respected (24 25 )
2
≤ . On the contrary in Fig. 6, the Bedrosian condition is not respected: β =1 implying that q=2. As a consequence, the inequality 24 25
3
≤ is not verified and it clearly appears that the demodulated amplitude and frequency modulations functions are not the ones expected.
Figure 5. Respect of the Bedrosian condition: fp =50 Hz, fm =24 Hz and β=0.1
(A) Real AMF and Demodulated AMF (B) Real FMF and Demodulated FMF
Figure 6. Non-respect of the Bedrosian condition: fp =50 Hz, fm =24 Hz and
1 =
β (A) Real AMF and Demodulated AMF (B) Real FMF and Demodulated FMF
4. Harmonic carrier frequency
Contrary to the mathematical theory domain, a carrier frequency is never a pure sinusoid in a vibration signal. It is a periodic function aproximated by Fourier series. It means that the signal is composed by a sum of components which frequencies are multiple of the fundamental frequency fp. The modulation sidebands present around
the fundamental are also present around these harmonics. Therefore, a real-life signal modulated in phase can be expressed as the sum of sinusoid modulated in phase
( )
i( )
cos 2i p sin 2(
m)
p t p t A πif t iβ π f t
+∞ +∞
To demodulate properly this signal, a low-pass or pass-band filter should be applied to keep only the fundamental sidebands. This operation is possible only if the sidebands of the first harmonic (of frequency 2fp) are not overlapping the sidebands of the
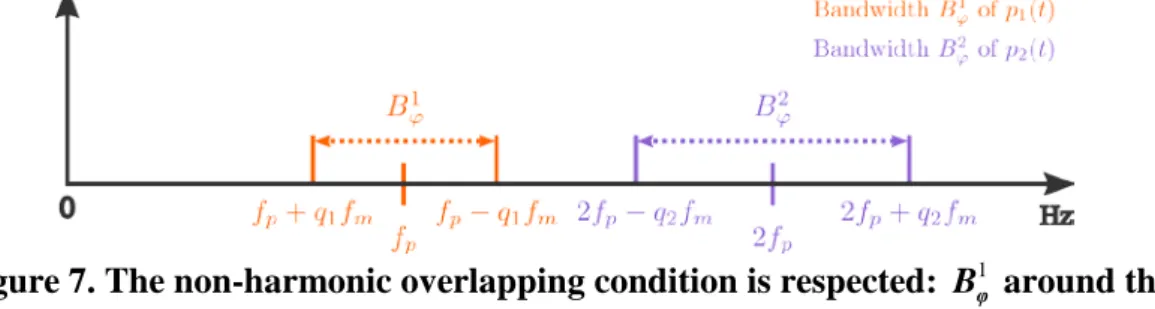
fundamental (of frequency fp). This condition is illustrated in Fig. 4 and will be referred to as the non-harmonic overlapping condition in the following. It can be expressed by the following equation
1 2 1 2 2 p p m f B B f f q q ϕ + ϕ < ⇔ < + (14)
where q and 1 q are the number of significant sidebands for the carrier frequency 2 fp
and its first harmonic 2 f respectively. 2
Figure 7. The non-harmonic overlapping condition is respected: B around the φ1 fundamental frequency and B around the first harmonic are separated. φ2
Let p t be the periodic signal with the following characteristics:
( )
fp =50 Hz, 24m
f = Hz, β =1 0.417 and β =2 0.834. The numbers of significant sidebands associated with the fundamental frequency and its first harmonic are q1 = and 1 q2 = . 2 Thus, while the Bedrosian condition (12) is verified, the non-harmonic overlapping condition (14) is not. Fig. 8 show the consequences of demodulation when this second condition is not respected.
It has been found experimentally that even if the non-harmonic overlapping condition is not respected, the demodulation is possible if the sidebands of the first harmonic are negligible compared to the sidebands of the fundamental. If there is at least an amplitude ratio of 20 dB between the most tiny amplitude of the fundamental and the sidebands included in the fundamental useful bandwidth it is possible to get the modulation functions properly, with a negligible error. The only difference between Fig. 8 and Fig. 9 is the ratio amplitude between the sidebands of the fundamental and those of its first harmonic.
Figure 8. The non-harmonic overlapping condition is not verified. The amplitude ratio between the sidebands of the fundamental and those of its first harmonic is small.
Figure 9. The non-harmonic overlapping condition is not verified. The amplitude ratio between the sidebands of the fundamental and those of its first harmonic is large.
5. Case study
This section presents an example of the demodulation of a signal measured on a gearbox casing of a ball mill.. The investigated stand consists of a 5 kV, three-phase induction motor of the power of 1.4 MW. The drivetrain consists of two spur gears connected via a two-stage flexible coupling. Both stages of gearbox are spur gears. The first stage includes a pinion gear with 24 teeth and the gear interacting with it has 175 teeth. The second stage consists of a pinion with 26 teeth and a wheel with 212 teeth. Its schematic representation is presented in Fig. 10. Vibration signal have been verified and it fulfils the Bedrosian conditions, so its demodulation could be performed.
Figure 10. Scheme of the ball mill drive train.
The rotational speed of the induction motor shaft is 991.04 rpm (16.517 Hz), which gives 135.91 rpm (2.265 Hz) after the first stage of spur gear and 16.67 rpm (0.2778 Hz)
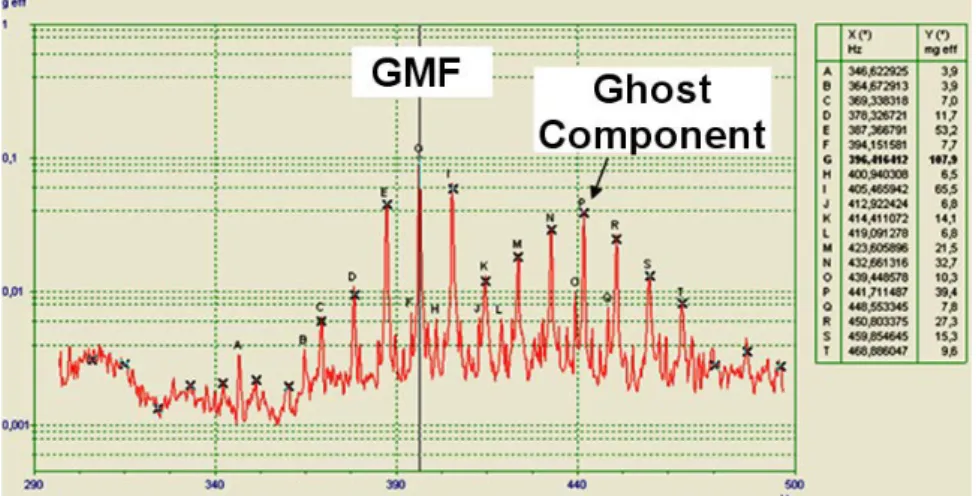
mentioned information allows to calculate the gear mesh frequency (GMF), which is equal to 396.42 Hz for the first stage of spur gear and 58.896 Hz for the second one. The obtained spectra around the GMF of the first stage of spur gear are presented in Fig. 11. This chart shows the presence of several pairs of the modulation sidebands whose spacing corresponds to the 4th order of the rotational frequency of the shaft with 175 teeth wheel fixed.
It is important to note that these families of sidebands are centred around two components. The first one is GMF of the first stage of spur gear. The second one corresponds to 195th order of PV shaft and this has no direct mechanical origin, but it is connected to the bigger wheel. It is in fact the Ghost Component that results in production process of a wheel with 175 teeth.
Figure 11. Spectrum of vibration signal with GMF of first gear stage.
Couple of facts have to be noted: • the frequency of the 3rd
left sideband (marked as K with an amplitude of approximately 14.1 mg) associated with the Ghost Component coincides with the 2nd right sideband of GMF
• the amplitude of the 3rd
right sideband of the Ghost Component (marked as T with an amplitude of 9.6 mg) is much lower than its 3rd left sideband
• the amplitudes of the sidebands on the left hand of both carrier frequencies are significantly greater than the respective ones on the right hand of them.
Figure 12. Frequency spectrum around investigated GMF before filtering represented by the blue line, and after filtering represented by the red line. Two
During further processing it is essential to eliminate the 3rd left sideband (marked M: 426.3 Hz, 21.5 mg) connected with Ghost Component from the analysed band. Next the band-pass filtering has been performed. In Fig. 12 the frequency spectrum around the GMF is presented. The red line represents the spectrum after filtering with different useful bandwidth (US) values. In the first case it is equal to 200 Hz around GMF frequency (Fig. 12A) and in the second case the US is 36 Hz (Fig. 12B).
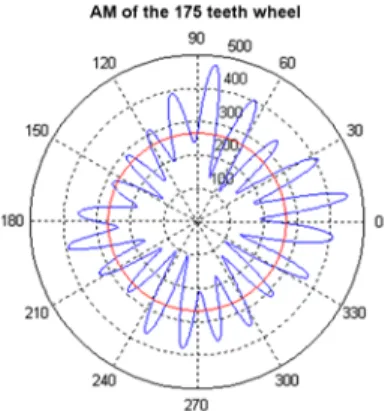
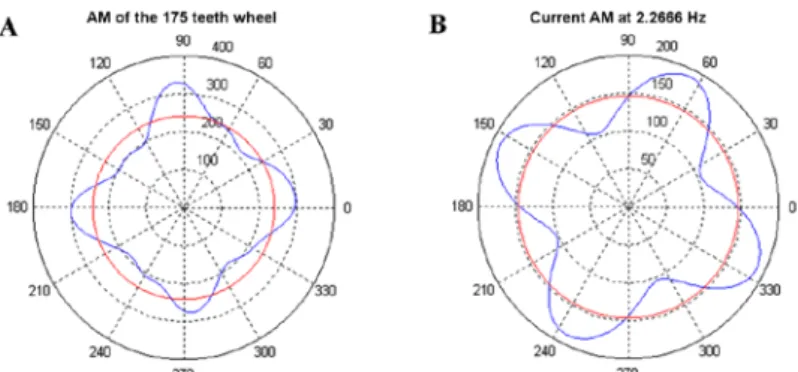
The profile of the modulation function obtained after filtering with a 200 Hz and plotted on a rotation of the 175 teeth wheel has 20 lobes, what is shown in Fig. 13. In chart there is the presence of 20 lobes which physically corresponds to a beat phenomenon between components of 175 and 195 order of the frequency of rotation of the output shaft of the gearbox first stage. It may be interpreted as an alteration of the 20 teeth of gear wheel.
Figure 13. The amplitude modulation plotted on rotation of 175 teeth wheel after usage filtering with 200 Hz bandwidth.
The inclusion into the analysis bandwidth vibratory phenomenon physically independent of the meshing of the gearbox first stage wheel which originates from the kinematics of the machine arising from manufacturing process leads to serious misinterpretation. On the other hand, the meshing profile of the 175 teeth wheel calculated after filtering the GMF component with a bandwidth of 36 Hz has four lobes. This result is entirely consistent with the modulation frequency of the GMF component which corresponds to the 4th order of rotational frequency of output shaft of the gearbox first stage and with the profile of the amplitude modulation of the supply current of the drive motor. These results are presented in Fig. 14. The angular offset is not interpretable because the acquisition of the vibration signals and the current intensity is not synchronous.
The impact of interference of the ghost component on the form of modulation functions and the associated rate of GMF component is significant when this component and the sidebands associated with it are contained in the analysed zone. This example illustrated that demodulation have to be used carefully, because even fulfilment of Bedrosian conditions is not the guarantee of good results.
Figure 14. (A) The amplitude modulation plotted on rotation of 175 teeth wheel after usage filtering with 36 Hz bandwidth (B) The corresponding chart of current.
6. Conclusions
In the case of a signal modulated both in amplitude and phase, the respect of the Bedrosian condition guarantees that the use of the analytic signal for demodulation is possible without transforming the modulation functions. Nevertheless, it does not guarantee that other phenomena could contaminate the sidebands and prevent a correct demodulation. As a consequence, the demodulation has to be done carefully by verifying that there are no unwanted components in the frequency bands to be demodulated.
Acknowledgements
This work has been supported by French Research National Agency (ANR) through EITE program (project KAStrion ANR-12-EITE-0002-01).
References and footnotes
1. E Bédrosian, ‘Product theorem for Hilbert Transforms’, Proc. IEEE, USA, 1963.
2. Y Xu, D Yan, ‘The Bedrosian identity for the Hilbert transform of product functions’, Proc. of the
American Mathematical Society, Vol. 134, Number 9, 2006.
3. M Feldman, ‘Hilbert transform in vibration analysis’, Mechanical Systems and Signal Processing,
Volume 25, Issue 3, April 2011, pp 735-802.
4. K Wang, ‘Phase Information at Tooth Mesh Frequency for Gear Crack Diagnosis’, Industrial
Electronics and Applications. ICIEA 2007. 2nd IEEE Conference on.
5. K Worden, W J Staszewski, J J Hensman, ‘Natural computing for mechanical systems research: A
tutorial overview’, Mechanical Systems and Signal Processing, Volume 25, Issue 1, January 2011, pp 4-111.
6. Z Feng, M Liang, Y Zhang, S Hou, ‘Fault diagnosis for wind turbine planetary gearboxes via
demodulation analysis based on ensemble empirical mode decomposition and energy separation’, Renewable Energy, Volume 47, 2012.
7. J Antoni, ‘Fast computation of the kurtogram for the detection of transient faults’, Mechanical
Systems and Signal Processing, Volume 21, Issue 1, 2007, pp 108-124.
8. F Cong, J Chen, G Dong, F Zhao, ‘Short-time matrix series based singular value decomposition for
rolling bearing fault diagnosis’, Mechanical Systems and Signal Processing, Volume 34, Issues 1–2, January 2013, pp 218-230.
9. J R Carson, ‘Notes on the Theory of Modulation’, Proceedings of the Institute of Radio Engineers, Vol. 10, No 1, pp 57-64, February 1922.
10. C Pachaud, ‘Réponse d'un oscillateur dissipatif à un degré de liberté à une force d'excitation sinusoïdale dont l'amplitude et la fréquence sont modulées’, GAMI, XIème colloque Vibrations Chocs et Bruit, June 1996.