HAL Id: hal-01268376
https://hal.archives-ouvertes.fr/hal-01268376
Submitted on 29 May 2020HAL is a multi-disciplinary open access
archive for the deposit and dissemination of sci-entific research documents, whether they are pub-lished or not. The documents may come from teaching and research institutions in France or abroad, or from public or private research centers.
L’archive ouverte pluridisciplinaire HAL, est destinée au dépôt et à la diffusion de documents scientifiques de niveau recherche, publiés ou non, émanant des établissements d’enseignement et de recherche français ou étrangers, des laboratoires publics ou privés.
Poplar
Nadia Goue, Nathalie Boizot, Michel Vallance, Elisabeth Magel, Philippe
Label
To cite this version:
Nadia Goue, Nathalie Boizot, Michel Vallance, Elisabeth Magel, Philippe Label. Microdissection to Isolate Vascular Cambium Cells in Poplar. Silva Fennica, Suomen Metsätieteellinen Seura ry, 2012, 46 (1), pp.5 - 16. �hal-01268376�
www.metla.fi/silvafennica · ISSN 0037-5330 The Finnish Society of Forest Science · The Finnish Forest Research Institute
S
ILVA
F
ENNICA
Microdissection to Isolate Vascular
Cambium Cells in Poplar
Nadia Goué, Nathalie Noël-Boizot, Michel Vallance, Elisabeth Magel and Philippe Label
Goué, N., Noël-Boizot, N., Vallance, M., Magel, E. & Label, P. 2012. Microdissection to isolate
vascular cambium cells in poplar. Silva Fennica 46(1): 5–16.
Vascular cambium is the lateral meristem producing xylem cells inwards and phloem cells outwards in plant stem. Thus, in trees, the quality and quantity of wood is a result of highly regulated developmental process depending initially on the vascular cambium cell production. The availability of accurate transcriptomics technologies based on high coverage sequencing raises the level of expectations on tissue sampling to a very high degree. What is the benefit of top-level transcriptomics in wood formation studies if we are using these technologies on raw tissues, mixing cells at the organ level or even higher scale? The presented work describes a nine-step procedure, from standing tree to isolated ray and fusiform cells from cryolyophilized tangential sections of the poplar cambial zone. The aim of this paper is to present a step by step procedure including advices on how to select the optimal tree, how to fell the tree while securing its physiological parameters, how to cryolyophilize and microdissect under binocular, presenting the time schedule of the whole process and RNA analysis.
Keywords fusiform cambial cells, microgenomics, Populus spp., ray cambial cells Addresses Goué: UMR5546 CNRS-Université Paul Sabatier, Castanet Tolosan, France;
Noël-Boizot, Vallance, Label & (Goué): INRA-UAGPF, 2163 Avenue de la Pomme de Pin, 45075 Orléans cedex 2, France; Magel: Universität Hamburg, Zentrum Holzwirtschaft, Deutschland
E-mail [email protected]
Received 10 June 2011 Revised 21 September 2011 Accepted 22 September 2011 Available at http://www.metla.fi/silvafennica/full/sf46/sf461005.pdf
1 Introduction
Vascular cambium is the secondary meristem which initiates wood formation in trees. Vascular cambium is formed by two types of cell from which different tissues are derived in the stem: fusiform cambial cells (FCC), which become
mainly fibers and xylem vessel elements; and ray cambial cells (RCC), which become parenchyma cells (Larson 1994). The way vascular cambium produces layers of tissues, phloem outwards and xylem inwards from FCC ultimately determines how saps will be transported in the tree (Sperry et al. 2008). However, understanding RCC
develop-ment is also crucial as rays provide photoassimi-lates, water and other signal molecules to the xylem (Lachaud et al. 1999). Since the vascular cambium is a key actor in wood production, it fundamentally affects the properties and quality of the wood (Fahn 1990, Catesson 1994). In order to understand the physiology of wood formation it is necessary to investigate the cambium at the cell level. However, little is known about the formation and organization of vascular cambium, and the molecular mechanisms underlying the cambial cell functioning is also poorly understood despite recent studies (see Matte Risopatron et al. 2010, Spicer and Groover 2010) for recent reviews. Gaining access to the cambial zone tis-sues in the stem without adversely affecting the transcriptome has been a major hurdle in forest research.
In general, the more powerful the analytical technique in molecular biology, the more accurate must be the sampling. New technologies make transcriptome profiling at the cell level possible. Such high resolution molecular analyses are com-plicated by problems associated with sample col-lection, i.e. access to tissues or cells of interest, acquisition of suitable sample size, and the lim-ited sensitivity of the expression assays (Freeman et al. 1999). However, resolution at the cell level between different cell types is becoming more widely used and is adding to our understanding of gene regulation at the cellular level (Ohtsu et al. 2007). The analysis of individual tissues and single cells eliminates the dilution effect due to complex tissue mixtures, and allows the discov-ery of vdiscov-ery small differences among distinct cell types (Kehr 2003). Various techniques have been developed for this purpose, which differ accord-ing to the nature of the plant sample (Galbraith and Birnbaum 2006). For example, by cell sort-ing (Becker et al. 2003, Birnbaum et al. 2003), by keeping cells in their biological context until sampling by micropipeting (Karrer et al. 1995, Brandt et al. 1999, Elge et al. 2001, Brandt et al. 2002), by forceps micromanipulation (Rottloff et al. 2009), and laser microdissection techniques (Asano et al. 2002, Kerk et al. 2003, Nakazono et al. 2003, Inada and Wildermuth 2005, Ohtsu et al. 2007). Tissue preparation necessitates a trade-off between the preservation of histological detail and the recovery of nucleic acids from the harvested
cells (Kerk et al. 2003). Chemical fixation of specimens and paraffin embedding, used with a laser microdissection technique, is possible but adversely affects RNA quality and quantity when compared with frozen tissues (Serth et al. 2000, Gillespie et al. 2002, Parlato et al. 2002, Perlmut-ter et al. 2004, Portillo et al. 2009).
In the present paper, we propose the microdis-section of cryolyophilized tissues as an adapted technique to isolate highly vacuolated mer-istematic cells (Catesson 1990) from vascular woody plants. Originally, this cell microdissection technique was used for metabolite and enzymatic assays (Jones et al. 1977), and for measuring the organic acid and potassium content of foliar cells (Outlaw and Lowry 1977). A similar technique has been used to isolate soybean nodule tissue and was proven to minimize any disturbance to cell metabolism (Oresnik and Layzell 1994). More recently, in woody plants, serial sectioning and cryolyophilization has been used to measure hormone concentration gradients across the devel-oping secondary vascular tissues of Scots pine (Uggla C., Magel E., Moritz, T. and Sundberg, B., unpublished data). In the present report, cryolyo-philization and microdissection are used together, and adapted to a cell microdissection technique for transcriptome analysis. Previous experiments (Hertzberg et al. 2001, Schrader et al. 2004) have shown that transcript extraction from vascular cambial tissue is possible starting from cryosec-tions, when combined with PCR amplification of primer-tagged cDNA. We applied RNA linear amplification by in vitro transcription technique (Van Gelder et al. 1990) to cambial cell samples. Our results show that RNA amplification makes analyses possible and generate various transcript profiling depending on types of vascular cambium sampling.
Formerly, we published a general study that compared gene expression between FCC and RCC (Goué et al. 2008) without detailing the microdissection procedure. The purpose of the present paper is to share our hand-microdissection technique used for cambial cells and to illustrate the urging necessity of working on homogeneous samples. We aim at developing a procedure where the geometrical constraints of cell layers in tan-gential sections in the cambial zone will be con-sidered before sampling; where the hydraulic
consequences of tree felling on sap fluxes will be taken into account during sampling; where con-sequences of tissue freezing and thawing will be prevented after sampling; where microdissection of cell types will be possible at room tempera-ture under a simple binocular; and finally where recent transcriptomics techniques can be applied on selected samples.
2 Materials and Methods
The complete procedure can be described in nine steps. a) select a tree with optimum stem diam-eter; b) avoid air in the xylem during tree felling,
c) freeze stem samples at felling and never thaw
consecutively, d) cut frozen blocks in cambial zone, e) cryosection tangential sections in the cambial zone, f) cryolyophilize cambial zone sections, g) microdissect RCC and FCC from lyophilized cambial zone sections, h) linearly amplify mRNA from cell-type enriched samples, and finally i) convert mRNA into cDNA.
2.1 Tree Felling
Sample collection was done on the 25th June 2002 from a 15-year old hybrid poplar, ‘Boelare’ (Populus trichocarpa × P. deltoïdes) with a diam-eter of about 50 cm (step a), growing at Beuxes, Moulin de Bariteau, Dominique Meese†, France.
The tree was felled one half-slab (10 cm) higher than breast height (1.4 m) and the top of the remaining standing stem was cut into 6 slabs (step
b) from the stem circumference, with dimensions
of approximately 20 cm longitudinally, 15 cm tangentially, and 7 cm radially (Fig. 1). The slabs were snap-frozen in liquid nitrogen in the field (step c) before returning to the laboratory where the frozen material was further cut into about one thousand blocks (step d), each 1 cm longitudi-nally × 0.5 cm tangentially × 0.5 cm radially. 200 blocks were used for each sampling.
2.2 Tissue and Cells Sampling
Each block was fixed on the holder with O.C.T. (TissueTek, Agar Scientific, England) and cut into three 25 µm-thick longitudinal-tangential cryosections (step e) with a cryomicrotome (HM 505E, Microm Laborgeräte, Walldorf, Germany). Sections were collected on microscope cover slips
Fig. 1. Sampling procedure from tree to cryolyophilized sections of cambial zone. Bar = 400 µm. Sections are
(24 × 24 mm) kept below 0°C, stacked together on 35 mm petri dishes, partially sealed, and transferred in a liquid nitrogen pot to a –30°C freezer to be dried (step f). The freeze-dryer was connected to a vacuum pump gauge and a –120°C fry ice trap (Hampp et al. 1990) and the samples were freeze-dried for 2 weeks until the pressure in the freeze-drying chamber stabilized. The completely dried samples were then removed and allowed to warm up slowly to room temperature.
Part of these cryosections were saved and kept as whole sections in a desiccator for further analy-sis. Remaining cryosections were microdissected by hand (step g) under a stereomicroscope (Stemi 2000-C, Zeiss, Germany) using magnification from ×100 to ×500 in a room with constant humidity (max. 40%). Cells were excised from one hundred lyophilized sections using sterilized dissecting instruments consisting of a steel handle holding a sharpened needle. Cells were collected by using a marten’s hair stuck to a steel handle (Fig. 2). Dissected cells (Fig. 3) were collected into a 1.5 ml autoclaved tube kept in silica-gel container during the procedure. However, because it is impossible to see microdissected cells in the tube with the naked-eye, it is recommended that the tube be centrifuged before opening. We iso-lated 2000 FCC and 4000 RCC for each mRNA extraction.
Scraped cambial zone was sampled according to Micheli et al. (2002) after bark removal on frozen and lyophilized stem portions. Microdis-sected cells, tissue sections and scraped tissues were compared in order to study the effect of sampling precision on gene expression.
2.3 Transcript Isolation and RT-PCR
Messenger RNAs were isolated from three dif-ferent samples: 1) from lyophilized and scraped cambial zone (CZ); 2) from cryolyophilized sec-tions of CZ; and 3) from microdissected cambial cells (CC). Purification of mRNA from all three sample types was performed using Dynabeads mRNA DIRECTTM Micro kit (Dynal Biotech
Lake Success, NY, USA). Tissue cryosections and microdissected CC were used for two independent repetitions of mRNA extractions. Transcripts were amplified (step h) by using two-round
amplifica-tion of MessageAmpTM II aRNA kit (Ambion,
USA) followed by reverse transcription (step
i) with a Superscript II according to the
manu-facturer’s instructions (Invitrogen). Nucleotides integrity was checked on gel.
The candidate genes in the present study were selected according to the results from a microar-ray experiment on vascular cambium (Goué et al. 2008). Six candidate genes were selected, which are referred to as ‘annotated clones’ in PopulusDB (http://poppel.fysbot.umu.se/index. html) and as ‘gene models’ in the JGI data-base (http://www.phytozome.net/poplar), namely a lipid transfert protein, Pt-HPS.3 (A013P67, POPTR_0001s00410), a dirigent family protein,
Pt-DRR206.6 (A047P55, POPTR_0001s10120), a fasciclin-like arabinogalactan protein, Pt-FLA14.6 (A054P41, POPTR_0012s14510), a phosholipase D, Pt-PLD1.2 (A062P40, POPTR_0001s19360), a photosystem II 10 kDa polypeptide PsbR,
Pt-PP1.1 (A078P57, POPTR_0011s14550) and a
Fig. 2. Hand-tools used in manual microdissection. Top:
steel needle tool; bottom: marten’s hair tool. Black
arrow indicates the marten’s hair. Bar = 1 cm. Fig. 3. Cryolyophilized cambial cell sections and micro-dissected cambial cells, (a) RCC and (b) FCC. Bar = 100 µm.
xyloglucan endotransglycosylase/hydrolase pro-tein, Pt-XTH9.2 (G095P92, POPTR_0013s14860). The candidate genes were amplified with Platinum Taq polymerase (Invitrogen, CA, USA) according to the manufacturer’s instructions using 25 ng of nucleic acids with gene-specific primers (Table 1). cDNAs extracted from scraped CZ were used as PCR controls.
2.4 Characterization of Cambial Cells
The surface areas of the FCC and RCC were measured from cryolyophilized cambial zone sections (see above) using images taken from a stereomicroscope (Leica MZ12, Leica Micro-systems, Germany) connected to a digital camera and processed with Image J software (www.rsb. info.nih.gov/ij/). To estimate the weights of the CC we proceed as following. Twenty cryolyo-philized sections of cambial zone were weighed (W) and scanned. Then, the total cell number (N) as well as the numbers of both cell types (Nfcc and Nrcc) were counted on one tenth of the images. The final weights (Wfcc and Wrcc) were obtained with the formula: Wfcc = (W × Nfcc) / N and respectively for Wrcc using Nrcc. Using this cell weight estimation, the cell number in the scraped cambial zone sample was estimated using its scraped sample weight. After RNA extraction and amplification, an estimation of mRNA was estimated per cell type.
3 Results
3.1 Characteristics of Cell Types
The application of the technique described in the present paper has provided new information concerning CC characteristics of hybrid poplar. At the end of the procedure, even though cells might have been slightly deformed by cryolyophi-lization, cell morphology was well conserved to set up cell characteristics and to perform homo-geneous cell microdissection. The average lon-gitudinal length of a FCC was found to be 255 µm (range 71–603 µm) and the average height of an uniseriate ray of RCC was found to be 188 µm (range 38–627 µm). We also determined the tangential dimension of CC to be 19 µm ena-bling us to calculate an estimate of cell surface area. The relative proportion of FCC and RCC is based on the area occupied by both CC types in a tangential plane. The surface of FCC and RCC is 78.4% ± 5.5 and 21.6% ± 5.5, respectively. Finally the estimation of the dry weight of a FCC is 65 ng and 10 ng for a RCC.
The molecular characteristics of cambial cells were calculated on a population of 2500 microdis-sected cells. RNA amplification is a required step when starting from small amounts of material. Gel-analysis has shown that the average length of molecule size is approximately 500 base pairs (Fig. 4). After 20 cycles of linear amplification, the amount of cDNA is estimated to be 1 µg; and
Table 1. Primer sequences and PCR conditions.
Primer name Primer sequence (3’–5’) Tm PCR Amplicon (°C) cycles size (bp) Pt-FLA14.6 s CTCCAGCACCAGCACCTGAA 55 30 239 Pt-FLA14.6 as GGATTCGATCCGACTCTGCAA Pt-DRR206.6 s GTGGGTTCTACTTCCATGAC 54 30 403 Pt-DRR206.6 as ACAACTGAATATCAACACGAAG Pt-HPS.3 s AACGTCACCATTGGCTCACC 54 26 194 Pt-HPS.3 as GGCATTGGAAGTCTTTGGGAAC Pt-PLD1.2 s GAGAATGCTGCATGGTTCCAG 54 28 174 Pt-PLD1.2 as AAATGCATCCATGCGGTGAG Pt-PP1.1 s GTCGTTCGAGGAAGTCCAAG 54 28 231 Pt-PP1.1 as GCCCAGATCAACAAACCAGT Pt-XTH9.2 s TGATTGGGCTACACAAGGTGGCCGTGTC 60 20 200 Pt-XTH9.2 as GCTGATGGCTCTGGTGCGCATTGAGC
two rounds of RNA linear amplification generate approximately 10 µg of aRNA. Our sampling strategy made it possible for us to estimate the amount of mRNA in each cell type, to be 3 pg in a FCC and 1.6 pg in a RCC.
3.2 Validation by Candidate Genes
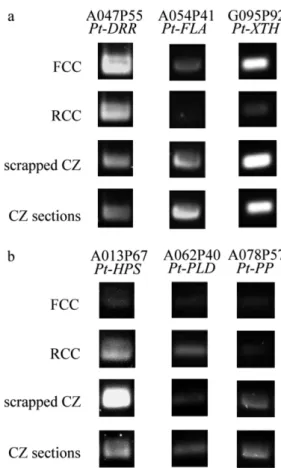
The validation presented here was conducted by RT-PCR on heterogeneous and homogene-ous samples. The RT-PCR showed a specific expression of six genes according to cell type and sampling methods (Fig. 5). Care was taken to select genes with referenced clones having similar GC contents (around 40%) to avoid bias even though we were not able to exclude any differences due to cell-type in specific samples. There is no difference in expression between scraped cambial zone (CZ) and cryolyophilized CZ sections except for the lipid transfer protein Pt-HPS.3 with a higher expression in scraped CZ compared to cryolyophilized CZ sections. In the case of FCC preferential expressed genes (Fig. 5a), preferential expression is clearly shown for the three genes AGP15, Pt-DRR, and Pt-XTH9.2. Similarly, RCC preferential gene expression is observed (Fig. 5b) except for a photosystem II polypeptide PsbR (Pt-PP).
4 Discussion
The cryolyophilized microdissection technique is relatively easy to set up in any standard labo-ratory. However, it requires dexterity from the manipulator despite the limit of dissection by hand is generally as few as 2 µm (Outlaw and Zhang 2001). Thus, manual microdissection can be performed on CC with a tangential length of 19 µm which is their shortest dimension in this plane.
Fig. 4. Analysis of the quality and integrity of nucleic
acids. Electrophoresis (1% denatured agarose gel) of aRNA samples labeled with digoxigenin. RNA ladder (1). Messenger RNAs come from RCC (2), FCC (3) and sections of vascular cambium (4).
Fig. 5. RT-PCR for six poplar clones described with their
accession number and encoded protein descrip-tion. (a): A047P55, dirigent protein; A054P41, fasciclin-like arabinogalactan protein; G095P92, xyloglucan endotransglycosylase/hydrolase pro-tein 9 and (b): A013P67, lipid transfer propro-tein; A062P40, phosholipase D; A078P57, photosystem II 10 kDa protein.
4.1 Cell Characteristics
There are striking variations in the dimensions and volumes of CC and their derivatives, which depend on parameters such as species, individual, tissue, localization within the tissue, age, and environmental conditions. Investigations on CC dimensions aid our understanding of wood-form-ing processes because CC size, or more precisely FCC size, has been shown to determine fiber and tracheary cell size (Bailey 1920, Ajmal et al. 1986). The average longitudinal length of a FCC was found to be 255 µm in our experiment. It is slightly below the estimation done on previous work on Populus spp. that reported FCC length to be 490 µm (range 350–660 µm) (Bailey 1920), and in other dicotyledons, between 300 µm and 350 µm (Catesson 1980). This can be due to the weak deformation that occurs at the lyophiliza-tion step. We also found the tangential dimen-sion of CC to be 19 µm enabling us to calculate an estimate of cell surface area and the relative proportion of FCC and RCC, based on area occu-pied by both CC types in a tangential plane. This character appears to be species-specific. For the hybrid poplar ‘Boelare’, the proportion of RCC is estimated to be around 22%, which is comparable with the results of previous studies on Juglans
regia (19%) and Prunus persica (33%) (Bartwal et al. 1983).
The whole procedure is time-consuming but the use of linear amplification gained from micro-dissected cells reduces the number of required cells. Further on, we will follow the nine-steps description of the procedure to discuss each step of the work.
4.2 Selecting Trees with Optimum Stem Diameter
Cambial cells, either FCC or RCC are known to have radial dimensions of about 10 µm when active (Catesson 1990, Iqbal 1990). The purpose of the method was to collect FCC and RCC as whole cells. To achieve this, the effect of the geometry of the stem radius on the thickness of the cambial section is of utmost importance. In theory, the stem radius of sampled tree should be infinite to ensure that no CC is lost during the
flat cryosectioning step. In other words, to ensure that cryosection in the tangential-longitudinal plane is flat, the stem radius should be infinite. Geometrically, with an infinite stem radius, the arc of the cambial section is equal to its chord (the chord here being its width in the tangen-tial direction), where arc = alpha × R, and chord = 2 × R × sin(alpha/2); alpha being expressed in radians, and R being the radius of the stem in meters. Obviously an infinite stem diameter is an impossibility; nevertheless, we had to select as large a diameter standing tree as possible in order to ensure that this geometrical limitation would be negligible. In our case, a 50 cm stem diameter led to a 0.004% difference between the arc and the chord on the tangential-longitudinal plane, instead of a theoretical zero difference. This is a critical, technical consideration when attempting to acquire an homogeneous sample, as the curvature of the tissue will affect the quality of a section taken from it: i.e. while cambial cells may be in a meristematic stage in the center part of the section, they may already be showing signs of differentiation at the periphery of the section, and vice-versa. This geometrical aspect has to be considered at the experimental design stage.
4.3 Avoid Air in the Xylem during Tree Felling
A second important point is to limit hydraulic flux in the xylem zone during stem sampling and before freezing in liquid nitrogen. When the tree is felled, even during the brief period when it is lying on the ground, atmospheric evapora-tive demand and stomatal conductance remains and generates a negative water potential in the stem (Tyree and Ewers 1991). Within only a few minutes of felling, therefore, air enters very rapidly into the stem through the cut base and produces large movements of water and sap in the xylem vessels and in the cambial zone of the felled tree. According to the cohesion-tension theory, a change in transpiration should result in the essentially instantaneous onset of changes in the flow and xylem tension (Sperry et al. 2008). Since these water movements might drastically change the location of mobile molecules, such as mRNA, in the cambial zone, and might affect any
subsequent results, we had to cut the tree above the position at which the samples were to be taken, which was at breast height. This procedure ensures that the CZ subsequently cryolyophilized and microdissected from these trunk portions are free of air, and that limited movement of water and sap does not modify the localization of mRNA in the different cell types.
4.4 Freeze Stem Samples at Felling, Cut Frozen Blocks, Cryosection Tangentially and Never Thaw until Lyophilization
From the top of the remaining standing stem after felling, the outer trunk portions were then cut and immediately frozen (Fig. 1). Blocks surrounding cambial zone were cut frozen and because tissues frequently split at the xylem expansion zone when frozen in liquid nitrogen, only those blocks that included the complete phloem-cambium-xylem structure were used for cryosectioning. During the procedure, the frozen stem samples, isolated blocks and tissue sections never thawed and remained in the solid phase throughout. Keeping cells as close as possible to their normal biological and physiological environment can be challenging when transcriptome analysis is conducted. The use of liquid nitrogen to freeze material is a key point in the procedure as this rapidly stops all water movements in the sampled tissues. Special care was taken to maintain sub-zero temperatures during all procedural steps in order to prevent any such thawing that might cause the formation of crystalline ice and the consequent degradation of nucleic acids and metabolites within the cells.
4.5 Microdissected RCC and FCC from Cryolyophilized Cambial Zone Sections
Although the freezing procedure is considered the best way to yield an adequate quantity of high quality mRNA, it is not widely used because of the potential of forming ice crystals that may destroy cell structure upon thawing. Tissue sec-tions are so thin that special care must still be taken in order to avoid thawing occurring in those steps prior to cryolyophilization. Thawing may occur on tissue sections within just a few seconds
at room temperature. The cell microdissection techniques developed here suppresses the critical thawing steps by applying the lyophilization pro-cedure to frozen tissue sections, which naturally avoids the formation of ice crystals. It makes the long lasting step of hand-microdissection possible at room temperature.
FCC and RCC were isolated (Fig. 3) from cryolyophilized tangential sections in a constant humidity room because an appropriate level of humidity limits the amount of static electricity in the ambient air of the dissecting room and so facilitates the collection of dissected cells.
4.6 Linearly Amplify mRNA from Cell-Type Enriched Samples
Our results indicate a difference in transcript amounts in FCC vs RCC, 3 pg vs 1.6 pg. Previous investigations have also found differences in the amount of transcripts according to cell type, and shown that care should be taken to normalize the yield when designing experiments that rely on quantitative comparisons between different cell types (Kerk et al. 2003). To that end, we isolated 2000 FCC and 4000 RCC for each mRNA extrac-tion. Previous transcriptome profiling, based on cell isolation, has been conducted on 10 cells (Kryvych et al. 2008); 150 cells (Asano et al. 2002); 2000 cells (Inada and Wildermuth 2005); and up to 10 000 cells (Nakazono et al. 2003). It is important to perform a cell-type transcriptome analysis on an optimized amount of cells in such a way that results for a so-called ‘average cell’ are achieved without bias due to there being too few cells (Kawasaki 2004). The technique of nucleic acid amplification is now making cell level investigations technically feasible and it has been suggested that transcriptome analyses on populations of several hundreds to thousands of cells would give a realistic representation of what happens in tissues, organs, and ultimately in the whole plant (Nygaard et al. 2005).
4.7 Convert mRNA into cDNA
RT-PCR results indicate that gene expression is changing according to the precision of the sam-pling. Interestingly, our RT-PCR results show that a gene showing an expression in scrapped CZ or in tissue sections is not reflecting what is happen-ing in FCC only but can also reflect an expression occurring preferentially in RCC. However, our results clearly show that intensity of expression is greater if the preferential expression is in FCC rather than RCC. This is hypothetically due to the fact that differential expression is generally better observed where preferential expression occurs in FCC rather than in RCC for two reasons. The first one is due to the proportion of FCC vs RCC that varies within a tree and amongst species (Lev-Yadun and Aloni 1995) and is 78% ± 5 of FCC in our case study. Secondly, our results also indicate that the quantity of messenger RNA would be higher in FCC than in RCC and then add to the unbalanced ratio between the 2 types of cell within the cambial tissue. Finally, when considering genes known to be expressed in the cambial zone, although the patterns of expression were similar in scraped CZ and in CZ sections, they do not reflect what occurs inside the tissue. If a gene of interest is specifically expressed in FCC or RCC, then expression is observed both in scraped cambial zone and in cambial zone sections. Caution should therefore be taken when investigating wood formation, and especially vas-cular formation, if using heterogeneous samples since the level of expression may reflect prefer-ential expression in either FCC or RCC.
4.8 Producing Cell-Type Enriched Samples
When sampling material for cell microdissection, the possibility of contamination of the sample (Nakazono et al. 2003) can never be entirely eliminated, whatever sampling technique is used (Laval et al. 2002). Based on careful observa-tions of their histological secobserva-tions, Ornstein et al. (2000) estimated each dissection by laser cell microdissection to contain more than 95% of the desired cells, which is similar to our findings with lyophilized cryosection microdissection. Moreover, the technique that we have developed
has the advantage of maintaining the vicinity of cell of interest intact, whereas laser cell micro-dissection can cause carbonization of the cell’s vicinity. Intercellular communication is another area that could be investigated experimentally by lyophilized cryosection microdissection of vascular cambium, since plasmodesmata have been shown to be well represented in the tangen-tial walls of RCC and in the radial and transverse walls between FCC, between RCC, and at both cell types junctions (Catesson 1990, Fuchs et al. 2010).
5 Conclusion
The approach of combining cell microdissection and transcriptome analysis is a valuable tool for the investigation of cell-specific expression in plants and is expected to highlight our under-standing of wood formation in regards to recent transcriptomics technologies such as RNAseq (Marguerat and Bähler 2010). It can be adapted to diverse kinds of tissues and especially to wood tis-sues. This technique can be widely used in plants and can be adapted to the analysis of other fea-tures such as cell wall components (Angeles et al. 2006), metabolomes and proteomes (Wienkoop et al. 2004) and then contribute to the understanding of the physiology of the entire organism.
Acknowledgements
This work was supported by: Le Conseil Régional de la Région Centre, France; the FORE pro-gramme; and the Formas and Erasmus European programmes. The authors thank gratefully both anonymous reviewers for improving the quality of this publication.
References
Ajmal, S., Khan, M.I.H., Khan, R. & Mahmooduzzafar, Iqbal, M. 1986. Structure of the vascular cambium in certain exotic eucalypts. Journal of Tree Sciences 5(2): 80–87.
Angeles, G., Berrio-Sierra, J., Joseleau, J.P., Lorimier, P., Lefebvre, A. & Ruel, K. 2006. Preparative laser capture microdissection and single-pot cell wall material preparation: a novel method for tissue-specific analysis. Planta 224(1): 228–232. Asano, T., Masumura, T., Kusano, H., Kikuchi, S.,
Kurita, A., Shimada, H. & Kadowaki, K.-I. 2002. Construction of a specialized cDNA library from plant cells isolated by laser capture microdissec-tion: toward comprehensive analysis of the genes expressed in the rice phloem. The Plant Journal 32: 401–408.
Bailey, I.W. 1920. The cambium and its derivative tissues. II. Size variations of cambial initials in gymnosperms and angiosperms. American Journal of Botany 7: 355–367.
Bartwal, B.S., Siddiqui, F.A. & Iqbal, M. 1983. Cam-bium structure in some Indian fruit trees. Kalikasan (Philippine Journal of Biology) 12: 61–69. Becker, J.D., Boavida, L.C., Carneiro, J., Haury, M.
& Feijo, J.A. 2003. Transcriptional profiling of Arabidopsis tissues reveals the unique character-istics of the pollen transcriptome. Plant Physiology 133(2): 713–725.
Birnbaum, K., Shasha, D.E., Wang, J.Y., Jung, J.W., Lambert, G.M., Galbraith, D.W. & Benfey, P.N. 2003. A gene expression map of the Arabidopsis root. Science 302(5652): 1956–1960.
Brandt, S., Kehr, J., Walz, C., Imlau, A., Willmitzer, L. & Fisahn, J. 1999. A rapid method for detection of plant gene transcripts from single epidermal, mesophyll and companion cells of intact leaves. The Plant Journal 20(2): 245–250.
— , Kloska, S., Altmann, T. & Kehr, J. 2002. Using array hybridization to monitor gene expression at the single cell level. Journal of Experimental Botany 53(379): 2315–2323.
Catesson, A.-M. 1980. The vascular cambium. In: Control of shoot growth in trees. IUFRO, Freder-icton, Canada.
— 1990. Cambial cytology and biochemistry. The Vascular cambium. M. Iqbal. Tauton, Somerset, England.
— 1994. Cambial ultrastructure and biochemistry: changes in relation to vascular tissue differentia-tion and the seasonal cycle. Internadifferentia-tional Journal of Plant Sciences 155(3): 251–261.
Elge, S., Brearley, C., Xia, H.-J., Kehr, J., Xue, H.-W. & Mueller-Roeber, B. 2001. An Arabidopsis inositol phospholipid kinase strongly expressed in procambial cells: Synthesis of PtdIns(4,5)P2 and PtdIns(3,4,5)P3 in insect cells by 5-phospho-rylation of precursors. The Plant Journal 26(6): 561–571.
Fahn, A. 1990. Plant anatomy. Oxford, Pergamon Press.
Freeman, T.C., Lee, K. & Richardson, P.J. 1999. Analy-sis of gene expression in single cells. Current Opinion in Biotechnology 10: 579–582.
Fuchs, M., van Bel, A.J. & Ehlers, K. 2010. Season-associated modifications in symplasmic organiza-tion of the cambium in Populus nigra. Annals of Botany 105(3): 375–387.
Galbraith, D.W. & Birnbaum, K. 2006. Global studies of cell type-specific gene expression in plants. Annual Review of Plant Biology 57: 451–475. Gillespie, J.W., Best, C.J.M., Bichsel, V.E., Cole, K.A.,
Greenhut, S.F., Hewitt, S.M., Ahram, M., Gath-right, Y.B., Merino, M.J., Strausberg, R.L., Epstein, J.I., Hamilton, S.R., Gannot, G., Baibakova, G.V., Calvert, V.S., Flaig, M.J., Chuaqui, R.F., Herring, J.C., Pfeifer, J., Petricoin, E.F., Linehan, W.M., Duray, P.H., Bova, G.S. & Emmert-Buck, M.R. 2002. Evaluation of non-formalin tissue fixation for molecular profiling studies. The American Journal Pathology 160: 449–457.
Goué, N., Lesage-Descauses, M.C., Mellerowicz, E.J., Magel, E., Label, P. & Sundberg, B. 2008. Microgenomic analysis reveals cell type-specific gene expression patterns between ray and fusiform initials within the cambial meristem of Populus. New Phytologist 180(1): 45–56.
Hampp, R., Rieger, A. & Outlaw, W.H. jr. 1990. Micro-dissection and biochemical analysis of plant tis-sues. Physical methods in plant sciences. H. F. Linskens, Jackson, J.F. Berlin, Springer-Verlag 11: 124–147.
Hertzberg, M., Sievertzon, M., Aspeborg, H., Nilsson, P., Sandberg, G. & Lundeberg, J. 2001. cDNA microarray analysis of small plant tissue samples using a cDNA tag target amplification protocol. The Plant Journal 25(5): 585–591.
preparation method and cell-specific marker for laser microdissection of Arabidopsis mature leaf. Planta 221(1): 9–16.
Iqbal, M. 1990. The vascular cambium. Taunton, Som-merset, England, Research Studies Press Ltd. Jones, M.G.K., Outlaw, W.H. jr. & Lowry, O.H. 1977.
Enzymatic assay of 10–7 to 10–14 moles of sucrose
in plant tissues. Plant Physiology 60: 379–383. Karrer, E.E., Lincoln, J.E., Hogenhout, S., Bennett,
A.B., Bostock, R.M., Martineau, B., Lucas, W.J., Gilchrist, D.G. & Alexander, D. 1995. In situ isola-tion of mRNA from individual plant cells: creaisola-tion of cell-specific cDNA libraries. Proceedings of the National Academy of Sciences of the United States of America 92: 3814–3818.
Kawasaki, E.S. 2004. Microarrays and the gene expres-sion profile of a single cell. Annals of the New York Academy of Sciences 1020: 1–9.
Kehr, J. 2003. Single cell technology. Current Opinion in Plant Biology 6: 617–621.
Kerk, N.M., Ceserani, T., Tausta, S.L., Sussex, I.M. & Nelson, T.M. 2003. Laser capture microdissec-tion of cells from plant tissues. Plant Physiology 132: 27–35.
Kryvych, S., Nikiforova, V., Herzog, M., Perazza, D. & Fisahn, J. 2008. Gene expression profiling of the different stages of Arabidopsis thaliana trichome development on the single cell level. Plant Physiol-ogy and Biochemistry 46(2): 160–173.
Lachaud, S., Catesson, A.-M. & Bonnemain, J.-L. 1999. Structure and functions of the vascular cam-bium. Comptes rendus de l'Academie des sciences Serie III Sciences de la vie 322: 633–650. Larson, P.R. 1994. The vascular cambium:
develop-ment and structure. Berlin, Springer Verlag. Laval, V., Koroleva, O.A., Murphy, E., Lu, C., Milner,
J.J., Hooks, M.A. & Tomos, A.D. 2002. Distribu-tion of actin gene isoforms in the Arabidopsis leaf measured in microsamples from intact individual cells. Planta 215: 287–292.
Lev-Yadun, S. & Aloni, R. 1995. Differentiation of the ray system in woody plants. Botanical Review 61: 49–88.
Marguerat, S. & Bähler, J. 2010. RNA-seq: from tech-nology to biology. Cellular and Molecular Life Sciences 67: 569–579.
Matte Risopatron, J.P., Sun, Y. & Jones, B.J. 2010. The vascular cambium: molecular control of cellular structure. Protoplasma 247(3–4): 145–161. Micheli, F., Ermel-Fontaine, F., Bordenave, M.,
Rich-ard, L. & Goldberg, R. 2002. Cell walls of woody tissues: cytochemical, biochemical and molecular analysis of pectins and pectin methylesterases. In: Chaffey, N.J. (ed.). Wood formation in trees: cell and molecular biology techniques. Taylor & Francis: London. p. 179–200.
Nakazono, M., Qiu, F., Borsuk, L.A. & Schnable, P. 2003. Laser-capture microdissection, a tool for global analysis of gene expression in specific plant cell types: identification of genes expressed dif-ferentially in epidermal cells or vascular tissues of maize. The Plant Cell 15: 583–596.
Nygaard, V., Holden, M., Loland, A., Langaas, M., Myklebost, O. & Hovig, E. 2005. Limitations of mRNA amplification from small-size cell samples. BMC Genomics 6: 147.
Ohtsu, K., Takahashi, H., Schnable, P.S. & Nakazono, M. 2007. Cell type-specific gene expression pro-filing in plants by using a combination of laser microdissection and high-throughput technologies. Plant & Cell Physiology 48(1): 3–7.
Oresnik, I.J. & Layzell, D.B. 1994. Composition and distribution of adenylates in soybean (Glycine max L.) nodule tissue. Plant Physiology 104: 217–225.
Ornstein, D.K., Gillespie, J.W., Paweletz, C.P., Duray, P.H., Herring, J., Vocke, C.D., Topalian, S.L., Bost-wick, D.G., Linehan, W.M., Petricoin III, E.F. & Emmert-Buck, M.R. 2000. Proteomic analysis of laser capture microdissected human prostate cancer and in vitro prostate cell lines. Electrophoresis 21: 2235–2242.
Outlaw, W.H. jr. & Lowry, O.H. 1977. Organic acid and potassium accumulation in guard cells during sto-matal opening. Proceedings of the National Acad-emy of Sciences of the United States of America 74(10): 4434–4438.
— & Zhang, S. 2001. Single-cell dissection and microdroplet chemistry. Journal of Experimental Botany 52(356): 605–614.
Parlato, R., Rosica, A., Cuccurullo, V., Mansi, L., Mac-chia, P., Owens, J.D., Mushinski, J.F., De Felice, M., Bonner, R.F. & Di Lauro, R. 2002. A preser-vation method that allows recovery of intact RNA from tissues dissected by laser capture microdissec-tion. Analytical Biochemistry 300: 139–145. Perlmutter, M.A., Best, C.J.M., Gillespie, J.W.,
Gath-right, Y., Gonzalez, S., Velasco, A., Linehan, W.M., Emmert-Buck, M. R. & Chuaqui, R.F. 2004. Com-parison of snap freezing versus ethanol fixation
for gene expression profiling of tissue specimens. Journal of Molecular Diagnosis 6(4): 371–377. Portillo, M., Lindsey, K., Casson, S., Garcia-Casado,
G., Solano, R., Fenoll, C. & Escobar, C. 2009. Iso-lation of RNA from laser-capture-microdissected giant cells at early differentiation stages suitable for differential transcriptome analysis. Molecular Plant Pathology 10(4): 523–535.
Rottloff, S., Muller, U., Kilper, R. & Mithofer, A. 2009. Micropreparation of single secretory glands from the carnivorous plant Nepenthes. Analytical Biochemistry 394(1): 135–137.
Schrader, J., Nilsson, J., Melllerowicz, E., Berglund, A., Nilsson, O., Hertzberg, M. & Sandberg, G. 2004. A high-resolution transcript profile across the wood-forming meristem of poplar identifies potential regulators of cambial cell identity. The Plant Cell 16(9): 2278–2292.
Serth, J., Kuczyk, M.A., Paeslack, U., Lichtinghagen, R. & Jonas, U. 2000. Quantitation of DNA extracted after micropreparation of cells from frozen and formalin-fixed tissue sections. American Journal of Pathology 156(4): 1189–1196.
Sperry, J.S., Meinzer, F.C. & McCulloh, K.A. 2008. Safety and efficiency conflicts in hydraulic archi-tecture: scaling from tissues to trees. Plant, Cell and Environment 31(5): 632–645.
Spicer, R. & Groover, A. 2010. Evolution of develop-ment of vascular cambia and secondary growth. New Phytologist 186(3): 577–592.
Tyree, M.T. & Ewers, F.W. 1991. The hydraulic archi-tecture of trees and other woody plants. New Phy-tologist 119(3): 345–360.
Van Gelder, R.N., von Zastrow, M.E., Yool, A., Dement, W.C., Barchas, J.D. & Eberwine, J.H. 1990. Amplified RNA synthesized from limited quantities of heterogeneous cDNA. Proceedings of the National Academy of Sciences of the United States of America 87: 1663–1667.
Wienkoop, S., Zoeller, D., Ebert, B., Simon-Rosin, U., Fisahn, J., Glinski, M. & Weckwerth, W. 2004. Cell-specific protein profiling in Arabidopsis thal-iana trichomes: identification of trichome-located proteins involved in sulfur metabolism and detoxi-fication. Phytochemistry 65(11): 1641–1649.