HAL Id: hal-02347439
https://hal.archives-ouvertes.fr/hal-02347439
Submitted on 9 Dec 2020
HAL is a multi-disciplinary open access
archive for the deposit and dissemination of
sci-entific research documents, whether they are
pub-lished or not. The documents may come from
teaching and research institutions in France or
abroad, or from public or private research centers.
L’archive ouverte pluridisciplinaire HAL, est
destinée au dépôt et à la diffusion de documents
scientifiques de niveau recherche, publiés ou non,
émanant des établissements d’enseignement et de
recherche français ou étrangers, des laboratoires
publics ou privés.
Thomas Daubon, Joris Guyon, Anne-Aurélie Raymond, Benjamin Dartigues,
Justine Rudewicz, Zakaria Ezzoukhry, Jean-William Dupuy, John Herbert,
Frédéric Saltel, Rolf Bjerkvig, et al.
To cite this version:
Thomas Daubon, Joris Guyon, Anne-Aurélie Raymond, Benjamin Dartigues, Justine Rudewicz, et
al.. The invasive proteome of glioblastoma revealed by laser-capture microdissection. Neuro-Oncology
Advances, Society for NeuroOncology (SNO); the European Association of Neuro-Oncology(EANO);
and Oxford University Press, 2019, 1 (1), pp.1-12. �10.1093/noajnl/vdz029�. �hal-02347439�
Neuro-Oncology Advances
1(1), 1–12, 2019 | doi:10.1093/noajnl/vdz029 | Advance Access date 28 September 2019
This is an Open Access article distributed under the terms of the Creative Commons Attribution License (http://creativecommons.org/licenses/by/4.0/), which permits unrestricted reuse, distribution, and reproduction in any medium, provided the original work is properly cited.
© The Author(s) 2019. Published by Oxford University Press, the Society for Neuro-Oncology and the European Association of Neuro-Oncology.
Thomas Daubon, Joris Guyon, Anne-Aurélie Raymond, Benjamin Dartigues, Justine Rudewicz,
Zakaria Ezzoukhry, Jean-William Dupuy, John M. J. Herbert, Frédéric Saltel, Rolf Bjerkvig,
Macha Nikolski, and Andreas Bikfalvi
INSERM U1029, Pessac, France (T.D., J.G., J.R., A.B.); LAMC, University of Bordeaux, Bordeaux, France (T.D., J.G., J.R., A.B.); KG Jebsen Brain Tumour Research Center, University of Bergen, Bergen, Norway (T.D., R.B.); University Bordeaux, INSERM UMR1053, BaRITOn Bordeaux Research in Translational Oncology, F-33000 Bordeaux, France (F.S.); Oncoprot, TBM Core US005 University of Bordeaux, France (A-.A.R., Z.E., F.S.); Bordeaux Bioinformatics Center, CBiB University of Bordeaux, France (B.D., J.R., M.N.); Plateforme Protéome, University of Bordeaux, Bordeaux, France (J-.W.D.); Disease Gene Discovery Limited, 27 Old Gloucester Street, London, UK (J.M.J.H.); NorLux Neuro-Oncology, Department of Biomedicine University of Bergen, Norway (R.B.); Oncology Department, Luxembourg Institute of Health 84, Val Fleuri, Luxembourg (R.B.); LaBRI, UMR5800 University of Bordeaux, Talence, France (M.N.)
Corresponding Authors: Andreas Bikfalvi and Thomas Daubon, U1029 INSERM-Angiogenesis and Cancer Lab, Université Bordeaux –
Campus Pessac, Bat. B2, RDC, Allée Geoffroy St-Hilaire, 33615 Pessac, France ([email protected];
Abstract
Background. Glioblastomas are heterogeneous tumors composed of a necrotic and tumor core and an invasive
periphery.
Methods. Here, we performed a proteomics analysis of laser-capture micro-dissected glioblastoma core and
inva-sive areas of patient-derived xenografts.
Results. Bioinformatics analysis identified enriched proteins in central and invasive tumor areas. Novel markers of
invasion were identified, the genes proteolipid protein 1 (PLP1) and Dynamin-1 (DNM1), which were subsequently validated in tumors and by functional assays.
Conclusions. In summary, our results identify new networks and molecules that may play an important role in
gli-oblastoma development and may constitute potential novel therapeutic targets.
Key Points
• Proteomics analysis on central and invasive areas reveals molecular heterogeneity. • Membrane trafficking, cytoskeleton, and metabolism pathways are particularly enriched. • Identification of new players in glioblastoma development.
Glioblastomas (GBM) are the most common and aggressive tumors from the central nervous system. Patient survival rate, despite therapeutic improvements, is about 15 months after tumor detection.1,2 GBM derive mainly from astrocytes but
may contain oligodendrocytic components as well. They are characterized by increase in vascular growth, but also by tor-tuous blood vessels, that are poorly perfused and thrombose, resulting in hypoxia and, in turn, necrosis.3 Furthermore, single
or contro-lateral invasion is observed.4 The Stupp protocol,
commonly used as first-line therapy, is based on large tumor
mass resection, local irradiation, and temozolomide treatment. Tumor recurrence is a constant feature and observed after a few months at which point patients may undergo second line surgery and antiangiogenic therapy (bevacizumab).5 However,
evasive resistance to antiangiogenic treatment is observed with tumor recurrence in most of the cases, mainly due to secondary tumors formed from invasive cells. We have re-cently performed RNA sequencing for both central and inva-sive areas and identified a gene regulatory network with high connectivity.6
The invasive proteome of glioblastoma revealed by
laser-capture microdissection
In this study, we performed laser-capture microdissection of core and invasive areas from patient-derived GBM xeno-grafts followed by high-throughput proteomic analysis. We identified novel protein signatures including proteolipid protein 1 (PLP1) and Dynamin-1 (DNM1) and validated them in additional tumor samples. Finally, a functional validation was carried out in vitro. Thus, our results report novel unexpected proteins that are involved in glioblas-toma development and may constitute novel therapeutic targets for preventing invasion following surgery.
Materials and Methods
Ethical Issues
Male RAGγ2C−/− mice were housed and treated in the animal
facility of Bordeaux University (“Animalerie Mutualisée Bordeaux”). All animal procedures were performed as ac-cording to the institutional guidelines and approved by the local ethics committee (agreement number: 5522).
Patients gave their consent prior tissue analysis ac-cording to the clinical guidelines. Informed written con-sent was obtained from all subjects (Department of Neurosurgery, Humanitas, Milan according to Humanitas ethical committee regulations).
Intracranial Tumor Xenografts
P3 spheroids were prepared 3 days before implantation by seeding 104 P3 cells in neurobasal medium with 0.4%
methylcellulose (Sigma) in a U-bottom 96 wells plate (Falcon). After PBS washing, five P3 spheroids were ster-eotactically implanted into the brains of randomly chosen three Ragγ2C−/− mice (8–12 weeks old). P3 cells have been
extensively characterized and have molecular profile of the mesenchymal subgroup (from male patient, age 64; chro-mosomal aberrations + [Chr 7, Chr19, 20q], −[1q42-q43, Chr9, Chr10, 20p] − [PIK3R, CDKN2A/B]7). Briefly, GBM spheroids
(5 spheroids of 104 cells per mouse) were implanted into the
right cerebral hemisphere using a Hamilton syringe fitted with a needle (Hamilton, Bonaduz, Switzerland), following the procedure already described,6 which consisted in an
in-jection at Bregma 0, 2 mm left, 3 mm deep.
Laser-Capture Microdissection
Coronal brain sections (10 µm thickness) were made using a CM3050-S microtome (Leica, Wetzlar, Germany) from
snap-frozen samples. The sections were then dehydrated in a series of pre-cooled ethanol baths (40 s in 95% and twice 40 s in 100%) and air-dried. Laser microdissection of samples was performed using a PALM MicroBeam microdissection system version 4.6 equipped with the P.A.L.M. RoboSoftware (P.A.L.M. Microlaser Technologies AG, Bernried, Germany). Laser power and duration were adjusted to optimize the cap-ture efficiency. Microdissection was performed at 5× magni-fication. Three tumors were analyzed for each condition, and five caps were collected for each tumor type. Three replicates were generated on serial sections for each brain tumor.
Sample Preparation for Mass Spectrometry
Microdissected tissues were first incubated in RIPA buffer supplemented with inhibitor cocktail (Complete, Roche). They were then treated by sonication for 10 s, supplemented with Laemmli buffer, heated at 95°C during 5 min and finally loaded onto a 10% acrylamide SDS-PAGE gel. Migration was stopped when samples entered into the first centimeter of the resolving gel and proteins were visualized by Colloidal Blue staining. Each SDS-PAGE band was cut into 1 × 1 mm gel pieces. Gel pieces were destained in 25 mM ammo-nium bicarbonate (NH4HCO3), 50% Acetonitrile (ACN), and shrunk in ACN for 10 min. After ACN removal by evapora-tion or pipetting, gel pieces were dried at room temperature. Proteins were first reduced in 10 mM dithiothreitol, 100 mM NH4HCO3 for 30 min at 56°C, then alkylated in 100 mM iodoacetamide, 100 mM NH4HCO3 for 30 min at room tem-perature, and shrunken in ACN for 10 min. After ACN re-moval, gel pieces were rehydrated with 100 mM NH4HCO3 for 10 min at room temperature. Before protein digestion, gel pieces were shrunken in ACN for 10 min and then dried at room temperature. Proteins were digested by incubating each gel slice with 10 ng/µl of trypsin (T6567, Sigma–Aldrich) in 40 mM NH4HCO3, 10% ACN, rehydrated at 4°C for 10 min, and finally incubated overnight at 37°C. The resulting pep-tides were extracted from the gel by three steps: a first in-cubation in 40 mM NH4HCO3, 10% ACN for 15 min at room temperature and two incubations in 47.5% ACN, 5% formic acid for 15 min at room temperature. The three collected ex-tractions were pooled with the initial digestion supernatant, dried in a SpeedVac, and resuspended in 0.1% formic acid before nanoLC-MS/MS analysis.
nanoLC-MS/MS Analysis
Online nanoLC-MS/MS analyses were performed using an Ultimate 3000 RSLC Nano-UPHLC system (Thermo
Importance of the Study
Our study deals with the identification of
mo-lecular players and regulatory circuits in
glio-blastoma development. Since glioglio-blastomas are
heterogeneous tumors composed of a tumor
core and an invasive periphery, we have chosen
a proteomics approach which takes into account
this regional heterogeneity. We used laser-capture
microdissection and state-of-the-art proteomics
analysis of core and invasive tumor areas to
identify molecular players and signatures.
Scientific, USA) coupled to a nanospray Q-Exactive hy-brid quadruplole-Orbitrap mass spectrometer (Thermo Scientific, USA). Each peptide extract were loaded onto a 300 µm ID × 5 mm PepMap C18 precolumn (Thermo Scientific, USA) at a flow rate of 20 µl/min. After 3 min desalting, peptides were online separated on a 75 µm ID × 25 cm C18 Acclaim PepMap RSLC column (Thermo Scientific, USA) with a 4–40% linear gradient of solvent B (0.1% formic acid in 80% ACN, solvent A: 0.1% formic acid in H2O) in 108 min. The separation flow rate was set at 300 nl/min. The mass spectrometer was operated in positive ion mode at a 1.8 kV needle voltage. Data were acquired using Xcalibur 3.1 software in a data-dependent mode. Full MS scans in the range from m/z 300 to 1600 were recorded at a resolution of 70,000 at m/z 200 and the target value for the automatic gain control (AGC) algorithm was set to 3 × 10⁶ ions collected within 100 ms. Dynamic exclusion was
set to 30 s and top 12 ions were selected from fragmenta-tion in HCD mode. MS/MS spectra were acquired with a resolution of 17,500 at m/z 200, and the maximum ion in-jection time and the AGC target were set to 100 ms and 1 × 10⁵ ions, respectively. Only precursors with assigned
charges states +2 and +3 were selected for fragmenta-tion. Molecules that are not proteins are generally charged with only one proton, hence the interest of sequencing only multicharged ions, which are generally peptides. Furthermore, peptide anion analysis remains little prac-ticed because of challenges with high-pH reversed-phase separations and a lack of robust fragmentation methods suitable for peptide anion characterization. Others set-tings were as follows: no sheath and no auxiliary gas flow; heated capillary temperature of 270°C; normalized HCD collision energy of 27%; and an isolation width of 2 m/z.
MS Data Processing and Quantification
Mascot 2.5 algorithm through Proteome Discoverer 1.4 Software (Thermo Fisher Scientific Inc.) was used for pro-tein identification in batch mode by searching against a
Mus musculus database (Proteome ID UP000000589;
re-lease date November 15, 2018; 54,188 proteins) merged to a Homo sapiens database (Proteome ID UP000005640; re-lease date November 17, 201pretty8; 73,931 proteins) from http://www.uniprot.org/ website.8 Two missed enzyme
cleavages were allowed. Mass tolerances in MS and MS/ MS were set to 10 ppm and 0.02 Da. Oxidation of methio-nine, acetylation of lysine, and deamidation of asparagine and glutamine were searched as dynamic modifications. Carbamidomethylation on cysteine was searched for as a static modification. For protein quantification, raw LC-MS/ MS data were imported in Proline Studio (http://proline. profiproteomics.fr/) for feature detection, alignment, and quantification. Protein identification was only accepted when at least 2 specific peptides had a pretty rank = 1 and had a protein false discovery rate value < 1.0% calculated using the “decoy” option in Mascot.8 Label-free
quantifica-tion of MS1 level by extracted ion chromatograms was car-ried out using the parameters indicated in Supplementary Table 1. Protein ratios were normalized to the median ratio. A missing values inference method was applied, and we used a variant when there is a minimum of 1.5-fold change with an adjusted P value below .05.
Experimental Reproducibility Between
Triplicates
Protein quantifications were analyzed using a bespoke pipeline of python scripts. For human data set, there were 743 proteins in each brain sample and 517 proteins for the mouse data set. We estimated the dispersion of pro-tein quantification values between technical replicates (3 per sample) for each condition (angiogenic and invasive) by computing the coefficient of variation CV= σμ, where σ and μ are the standard deviation and mean. Histograms of CV values were built for each sample separately for each condition. Based on the analysis of these histograms, we chose CV=0.8 as the threshold for eliminating proteins whose values were not sufficiently reproducible between triplicates. Proteins were retained only if the CV was below the 0.8 threshold for both conditions, resulting in 574, 691, and 714 proteins for each of the brain samples for Human and in 372, 468, and 484 proteins for each of the brain sam-ples for mouse. To compare central and invasive condi-tions, we have generated aggregated tables with protein quantifications for all samples and replicates, resulting in 18 column tables (9 columns per condition) for Human and mouse; a protein was retained to be part of these tables only if it was present in 6 out of 9 columns for each con-dition. These resulting aggregated data set contain in total 730 proteins for the Human-annotated data set and 510 for the mouse-annotated data set (Supplementary Tables 2 and 3). Furthermore, for certain downstream analyses, we considered only proteins common to all replicates, re-ducing the aggregated data sets to 544 and 331 proteins for Human and mouse, respectively.
Differential Expression Analysis
To reveal potential biomarkers which distinguish be-tween invasive and angiogenic conditions, we applied the Welch’s t-test to the corresponding replicate value vectors. The resulting P-values were further adjusted using the Benjamini–Hochberg multiple test correction algorithm9
re-sulting in padj values for each protein. We set the threshold for the significance of the padj at 0.01, yielding (i) for the aggregated data sets 152 and 284 potential biomarkers for Human and mouse, respectively; and (ii) for the common data sets 119 and 206 potential biomarkers for Human and mouse, respectively. These significantly differentially expressed proteins are further filtered by computing the log-fold change between protein quantifications for inva-sive and angiogenic replicates as logFC = logµ(I)
µ(A),
where I and A are vectors of values for invasive and angi-ogenic conditions, respectively. Proteins having padj<0.01 and |logFC|>2 for the Human data set and padj<0.01 and |logFC|>5 for the mouse data set are retained to generate the clustermaps. Clustermaps were generated using pheatmap package v.1.0.1210 with the Euclidean distance
and Ward D2 clustering method parameters.
Functional Enrichment Analysis
For the enrichment analysis, the significantly differen-tially expressed proteins (padj<0.01) in the aggregated
data sets were further filtered by the logFC criterion. We have retained proteins having the |logFC|>1 for both Human- and mouse-aggregated data sets. In order to find pathways deregulated between the two conditions of in-terest, we subsequently performed a Gene Set Enrichment Analysis (GSEA) on these subsets. We used Gseapy python package (https://pypi.python.org/pypi/gseapy), which is a wrapper to the functionalities provided by the Broad’s in-stitute GSEA suite (http://www.broad.mit.edu/gsea/). We used the enrichment function, applying a 0.05 adjusted P-value cutoff, and ran the analysis using the GO biolog-ical process and GO cellular component knowledgebases. KEGG package was also used for defining cellular path-ways enriched in invasive areas.
AngioScore
The AngioScore was calculated as done previously.11
Briefly, for each gene, the AngioScore is the percentage of publications that contain one or more relevant angi-ogenesis keywords in the abstracts from all publications assigned to a gene by the Entrez Gene database. A t-test comparison of AngioScores between the core and the in-vasive GBM areas was performed.
Antibodies and Reagents
PLP inhibitor peptide was purchased from Peprotech (100– 21), and DNM1 inhibitor, Dynasore (RD Systems, 201-LB/C). Cells were treated at concentrations indicated concentra-tions in the legend section.
Histological and Immunohistological Analyses
For immunofluorescence on histological sections, frozen sections were processed as described previously.6 Patientparaffin-embedded sections were deparaffinised in xy-lene and hydrated serially in 100%, 95%, and 80% ethanol. Endogenous peroxidase was quenched in 3% H2O2 in PBS for 10 min. Slides were then incubated with anti-DNM1 (Invitrogen PA1660), anti-PLP1 (Sigma SAB2101830), or anti-Nestin (ThermoFisher PA5-11887) antibodies overnight at 4°C. Sections were washed three times in PBS, and sec-ondary fluorescent antibodies were applied (Anti-mouse or anti-rabbit fluorescent antibodies). After mounting, DNM1 or PLP1 expression localizations were analyzed using IHC profiler from Fiji Software. IHC profiler uses the DAB signal in images and the results are expressed as a ratio the DAB area to the total area.
Proliferation and Viability Experiments
A 96 wells plate (Falcon) was coated with 0.2 mg/ml of Matrigel in NBM for 30 min. Then, 2000 P3 cells were placed into the wells with 10 ng/ml of Hoechst stain in NBM and incubated for 24 h. When adherent cells appeared, su-pernatant were removed and substituted by 100 µl of NBM with treatment. Pictures of each well were taken at T0, 24 h, 48 h, and at 72 h. LIVE/DEAD (Invitrogen) assays were also realized through the addition of Calcein into the wells. The
number of living (in blue) and/or dead (in red) cells was quantified with the FIJI software.
Invasion Assays in Collagen I Gels
P3 spheroids were prepared 3 days, respectively, before inclusion by the seeding of 104 cells in neurobasal
me-dium with 0.4% methylcellulose (Sigma) in a U-bottom 96 wells plate (Falcon). A solution of 1 mg/ml of collagen I (Fisher Scientific) was prepared in PBS with 7.2mM NaOH. Treatments were mixed directly into the collagen gels. After 30 min incubation on ice, spheroids were individually picked, washed in PBS, and included in the collagen solu-tion. After 45 min at 37°C in a cell incubator, neurobasal medium with the different treatments was added. P3 sphe-roid invasion areas were measured after 24 h with FiJi software, with a home-made macro. Briefly, total area was automatically quantified and the core area was manually measured. The core area was then subtracted from the total area for obtaining the invasive area. For each inde-pendent experiment, the mean of 7 to 8 invasive areas was calculated and compared with controls.
Statistical Analysis for In Vitro Experiments
Statistical analysis was performed using the Graphpad software. Multiple comparisons were performed with one-way analysis of variance, followed by Tukey post hoc tests and with one-way ANOVA Bonferroni multiple comparison test. Statistical comparison between two groups was per-formed by using the Mann–Withney test.Data Availability
The mass spectrometry proteomics data have been depos-ited to the ProteomeXchange Consortium via the PRIDE (Deutsch et al., 2017) partner repository, with the data set identifier PXD012791. All data are available within the Article and Supplementary Files, or available from the au-thors upon request.
Results
Laser Capture and Mass Spectrometry of
Glioblastoma Core and Invasive Areas
For this study, we have used patient-derived P3 tumors. These tumors are of mesenchymal phenotype and have the following characteristics: male patient, age 64; chromo-somal aberrations + [Chr 7, Chr19, 20q], − [1q42-q43, Chr9, Chr10, 20p] − [PIK3R, CDKN2A/B]. Five P3 spheroids were injected in the right hemisphere in the striatum.6
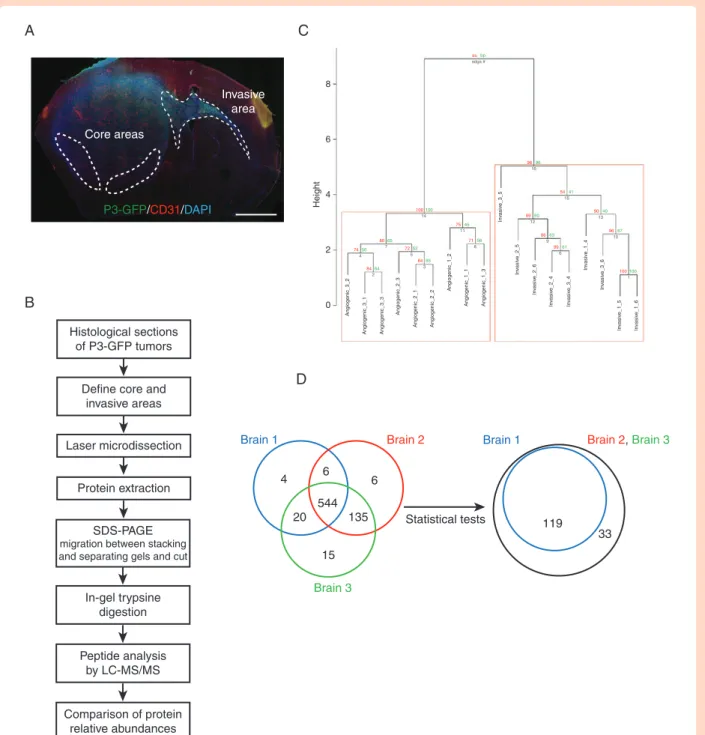
Laser-capture microdissection (LCM) was performed on patient-derived glioblastoma xenografts from P3 cells transduced with GFP vectors from core and invasive areas and the pro-teins extracted (Figure 1A and B). Tumor core and invasive areas from three different mice were laser-microdissected and processed for proteomic analysis. Proteins were di-gested and analyzed by liquid chromatography/tandem
mass spectrometry (LC-MS/MS). Relative abundances of specific Human and mouse peptides were compared and then grouped to analyze the differential protein expres-sion levels. The dendrogram showed a distinct pattern of arborescence for invasive and core proteins (Figure
1C and Supplementary Figure 1A). A total of 730 Human and 510 mouse proteins were detected. A Venn diagram shows a comparison of the number of proteins found for three different mouse brains, where 544 Human proteins were found common with all (Figure 1D). After adjusting
A
Core areas Invasive area P3-GFP/CD31/DAPIB
Histological sections of P3-GFP tumorsDefine core and invasive areas
Laser microdissection Brain 1 Brain 2
Brain 3 Brain 2,Brain 3 Brain 1 4 6 6 15 20 544 135 8 aubp 7450 adga # 4 100100 14 7545 11 9696 16 8960 12 5441 15 8663 9 8961 6 9040 13 9667 10 100100 1 7156 8 8065 7 7252 5 8464 2 8455 3 6 4 Height 2 0 Angiogenic_3_ 2 Angiogenic_3_ 1 Angiogenic_3_ 3 Angiogenic_2_ 3 Angiogenic_2_ 1 Angiogenic_2_ 2 Angiogenic_1_ 2 Angiogenic_1_ 1 Angiogenic_1_ 3 In va siv e_3_ 5 In va siv e_2_ 5 In va siv e_2_ 6 In va siv e_2_ 4 In va siv e_3_ 4 In va siv e_1_ 4 In va siv e_3_ 6 In va siv e_1_ 5 In va siv e_1_ 6 119 33 Statistical tests Protein extraction In-gel trypsine digestion Peptide analysis by LC-MS/MS Comparison of protein relative abundances SDS-PAGE migration between stacking and separating gels and cut
D
C
Figure 1. Laser-capture microdissection and proteomics analysis for comparing central and invasive glioblastoma areas. (A) Schematic rep-resentation of P3 tumor core and invasive areas. P3-GFP cells were stereotactically injected into mouse hemisphere and were visualized using fluorescence microscopy with CD31 and DAPI staining (P3 in green, CD31 in red, and DAPI in blue). Scale bar = 500 µm. (B) Technical flow chart of P3 tumors analysis by combining laser microdissection and mass spectrometry analysis. (C) Hierarchical clustering of paired samples obtained from the analysis of the log-ratio values of the 544 proteins common for all samples. Values at the left represent approximately unbiased P values (AU) and values at the right correspond to boot- strap probability (BP). (D) Venn diagrams of Human proteins expressed in the three different tumors analyzed by proteomics. 544 proteins are common between the three tumors (left diagram). After Welch test P-values by FDR and setting the signif-icance threshold at 0.01, 152 Human proteins were found differentially regulated between the core and the invasive areas (right diagram).
the Welch test P-values by FDR and setting the signifi-cance threshold at 0.01, 152 Human proteins were found significantly differentially regulated between the core and the invasive areas (Figure 1D), and 284 mouse proteins (Supplementary Figure 1B). Thirty-four Human proteins were found upregulated in the invasive area and 118 in core area (Supplementary Table 4). For Human proteins, meta-bolic pathways were enriched, notably gluconeogenesis (GO:0006094), mitochondrion (GO:0005739), and fatty acid metabolism (GO:019395 and GO: 0006635) (Figure 2A). Furthermore, categories relating to cytoskeleton proteins (focal adhesion GO:0005925, cell cortex part GO:0044448, and or cytoskeleton GO:0005856) and trafficking were also enriched (Figure 2A). Two hundred seventy-six mouse proteins were found upregulated in the invasive area and eight in core area (Supplementary Table 5). For mouse pro-teins, metabolic pathways were also enriched, such as gluconeogenesis (GO:0006094), glucose catabolic to pyr-uvate (GO:0061718), canonical glycolysis (GO:0061621), and mitochondrion (GO:0005739) (Supplementary Figures 1C and 2). Analysing invasive and central protein hits with KEGG database, PI3K-Akt signaling pathway (hsa04151), and synaptic vesicle cycle (hsa04721) were highly repre-sented (Supplementary Table 6).
Enrichment of New Marker Proteins in Invasive
Glioblastoma Area
For the subsequent analyses, we focused our attention on the Human specific proteins. Volcano plot for proteins overexpressed in the invasive part and/or the tumor core demonstrated a clear enrichment of proteins in the core area, but with higher log-fold change (|logFC|) found in the invasive area (Figure 2B and Supplementary Table 4). A 2D cluster heatmap of proteins with padj<0.01 and logFC>2 and which are in common in three mouse brains showed a highly significant overexpression of Proteolipid Protein-1 (PLP1, log-fold change of 3.19), Dynamin-1 (DNM1, log-fold change of 4.02), and RHOB (log-fold change of 3.14) in the invasive area (Figure 2C). Among the most upregulated proteins in the core area were Glial Fibrillary Astrocytic Protein (GFAP, log-fold change of −2.38), Isocitrate Dehydrogenase 2 (IDH2, log2 fold change of −2.04), and glutamine synthetase (GLUL, log-fold change of −2.99) (Figure 2C). An interaction network of proteins from the in-vasive area showed a main node where DNM1 and PLP1 were linked (Figure 2D). Among the highest upregulated genes, VSNL1 (Visinin Like 1, log-fold change of 6.38) and STXBP1 (syntaxin binding protein, log-fold change of 4.31) were identified. However, functional analysis of these mol-ecules is difficult since no specific inhibitors exist.
To provide further evidence of the difference between the invasive area and the angiogenic tumor core, we cal-culated an “AngioScore,” as described previously.11 The
AngioScore is derived by searching angiogenesis and tumor angiogenesis keywords against total publications using Pubmed and reflects in our analysis angiogenic signaling provided by the tumor (Figure 2E). The average AngioScore was 1.5 times higher in the angiogenic tumor core when compared with the invasive area, by taking the 30 best hits from each area. This is globally in agreement
with the proteomic expression analysis. By filtering the 20 highest AngioScores, most of the identified protein potential biomarkers were expressed in the core area (Supplementary Table 7). In the invasive part, some pro-teins (RHOB or fumarate hydratase) also exhibited an el-evated AngioScore but these proteins have been indeed extensively studied in the context of tumor angiogenesis (Supplementary Table 7).
Analysis of PLP1 and DNM1 Expression in Patient
Samples
Little is known about the role of PLP1 in tumor develop-ment12 and only few publications identify DNM1 as
glioblas-toma marker.13,14 Therefore, we focused our attention on
these proteins since they were significantly overexpressed in the invasive area. Immunostaining with PLP1 or anti-DNM1 antibodies showed higher expression of both pro-teins in invasive areas in patient-derived xenografts (Figure 3A and B). PLP1 was detected in the extracellular space and on the plasma membrane, and DNM1 was expressed in the cytoplasm (Figure 3A and B). This was confirmed in paraffin-embedded patient samples (Figure 3C).
PLP1 and DNM1 Inhibition Decreases Cell
Invasion
To functionally study the role of PLP1 and DNM1, invasion experiments were performed. We used the patient-derived cell line P3 for these experiments. To interfere with PLP1- and DNM1-dependent invasion, specific inhibitors were used in a collagen type I invasion assay (Figure 4). Both inhibitors showed inhibitory activity on invasion (29% of inhibition for PLP1 inhibitor; 36%/71%/97% of inhibition for Dynasore at 78/155/310 µM, respectively) (Figure 4A and B). The specific inhibitor of DNM1 (Dynasore) demonstrated a very strong and dose-dependent inhibition of tumor cell invasion (Figure 4B). To rule out cell toxicity, we used the Dead/Live kit assay. At a maximum inhibitory Dynasore concentration of cell invasion (310 µM), cytotoxicity was in-deed observed but not at 155 µM, which inhibited invasion at 71% (Figure 5A). In addition, Dynasore at 155 µM also in-hibited proliferation of P3 cells (Figure 5B). We also verified the effect of PLP inhibitor on cytotoxicity and proliferation. No difference in comparison to untreated cells was found (Figure 5C and D).
Discussion
In this article, we undertook a systematic study to unravel molecular signatures related to glioblastoma development and, in particular, invasion. To this aim, we performed a proteomics analysis on patient-derived tumors implanted in immunodeficient mice. It has been previously shown that the molecular characteristics of patient tumors remain stable when xenografted in mice.15 We performed our
anal-ysis on laser-capture microdissected material obtained from invasive and central tumor areas. The scientific pipeline used in this study was validated in previous publications in
A
B
D
E
C
gluconeogenesis (GO:0006094) HitsCombined Score 30 25 20 15 14 6 4
hexose biosynthetic process (GO:0019319) fatty acid oxidation (GO:0019395) fatty acid beta-oxidation (GO:0006635) fatty acid catabolic process (GO:0009062) glucose metabolic process (GO:0006006) neutrophil activation involved in immune response (GO:0002283) neutrophil degranulation (GO:0043312) neutrophil mediated immunity (GO:0002446) glycolytic process (GO:0006096)
15
10
5
0
–2 0 2
Log2 Fold Change
40 * 30 20 10 Angio Score 0
Core area Invasive area
ATP6V1C1 ATP6V1E1
DLG1
CAMK2G
STXBP1
DNM1
EHD3 SYNJ1 AP2B1 SNAP91 VSNL1 PLP1 SYNGR1 TUBB4A PPP2R1A PPP2R2A YWHAG HSPA4 VCP RAB3A ENSG00000258947 SYT1 ATP6V0A1 ATP6V0D1 NDUFV1 GNB2 GNB1 –Log10 (pv alue) 4 6 STXBP1 PLP1 SNAP91 RHOB DNM1 TUBB4A VSNL1 sample PURB GLUL GFAP IDH2 RTN4 NDUFV1 AP2B1 RAB3A ATP6V0D1 ATP6V1E1 ATP6V1C1 SYT1 TUBB3 TUBB4A CAMK2G VSNL1 STXBP1 SNAP91 PLP1 RHOB CSRP1 DNM1 sample 2 1 Invasive area Tumor core Protein cluster 1 Protein cluster 2 Tumor core . 1.2 Tumor core . 1.1 Tumor core . 1.3 Tumor core . 2.3 Tumor core . 2.1 Tumor core . 2.2 Tumor core . 3.2 Tumor core . 3.1 Tumor core . 3.3 Invasiv e area. 2.5 Invasiv e area. 2.6 Invasiv e area. 2.4 Invasiv e area. 3.4 Invasiv e area. 3.6 Invasiv e area. 1.5 Invasiv e area. 1.6 Invasiv e area. 1.4 Invasiv e area. 3.5 cluster 0 –1 –2 cluster CSRP1 2.4 2.5 2.6 2.7 2.8 2.9 3.0 3.1 –log 10(Adjusted P-value) Biological Processes
mitochondrion (GO:0005739) Hits
Combined Score 40 30 20 10 30 9 3
focal adhesion (GO:0005925) mitochondrial matrix (GO:0005759) cell cortex part (GO:0044448) cytoskeleton (GO:0005856) ficolin-1-rich granule (GO:0101002) vacular proton-transporting V-type ATPase complex (GO:0016471 ) lysosomal membrane (GO:0005765) ficolin-1-rich granule lumen (GO:1904813) clathrin-coated vesicle membrane (GO:0030665)
2 3 4 5 6 7 –log
10(Adjusted P-value)
Cellular Components
Figure 2. Protein enrichment of tumor invasive area (A) Gene Set Enrichment Analysis results. Gene Ontology (GO) biological processes (BP) and cellular components (CC) enrichment of the top 152 proteins that are significantly differentially expressed between core and invasive areas (pval adj < 0.01 and |logFC| > 2), and which are represented here for the three tumors. The x-axis represents the negative log10 P-adjusted value. The size of each spot (Ratio) corresponds to the fraction of proteins within our set of proteins that have the corresponding GO function. (B) Graphical representation of quantitative proteomics data for the three P3 tumors. Proteins are ranked in a volcano plot according to P value for technical re-producibility, calculated from a one-tailed paired t-test (−log10 [P value]) (y-axis) and their relative abundance ratio (log ratio) between core and invasive areas (x-axis). The line indicates the P < 0.05 threshold. Off-centered spots are those that vary the most between core and invasive areas. (C) Heatmap of the top 22 of the 152 proteins that are significantly differentially expressed for P3 tumor core and invasive areas (pval adj < 0.01 and |logFC| > 2). (D) Network of human tumor invasive proteins. Each node represents a protein and interactions with medium confidence >0.4 are showed. Proteins are clustered using the Markov Cluster Algorithm and colors represent clusters. Dashed lines represent intercluster edges and width represent edge confidence (medium: >0.4, high: >0.7, and highest: 0.9). Disconnected proteins are removed from the analysis. (E) AngioScore of the top 30 hits from P3 tumor core and invasive areas. Student t-test, * P < .05.
A
B
C
Cor e Nestin/DAPI DNM1 Plot profile 1500Staining intensity (A.U)
1000
500
Invasive area Core 0
1500
Staining intensity (A.U)
1000 500 Invasive area *** Core 0 1500
Staining intensity (A.U)
1000 500 Invasive area **** Core 0 DNM1 staining
***
800Staining intensity (A.U)
600 400 200
Invasive area Core 0 PLP1 staining
**
zoom-DNM1/DAPI DNM1/DAPI Zoom Zoom PLP1/DAPI zoom-PLP1/DAPI 300 250 200 150 100 50 0 4 3.5 3 2.5 2 1.5 1 0.5 0 Plot profile Nestin/DAPI PLP1 Cor e In vasiv e area Cor e In vasiv e area Cor e In vasiv e area In vasiv e areaFigure 3. DNM1 and PLP1 are more expressed in invasive areas of patient-derived xenografts and in patients. (A) Immunostaining of Nestin (red) and DNM1 or PLP1 (green) in the tumor core (upper panels) and in the invasive area (middle panels) of P3 tumors. DAPI was used for nuclear staining (blue). Scale bars: 100 µm. Lower panels represent magnified images as delineated by dashed line squares, with plot profiles defined using Fiji software (defined by white lines). Both DNM1 and PLP1 are cytoplasmic. (B) The graphs represent DNM1 and PLP1 staining intensity of 10 different images from P3 core and invasive areas (Student t-test, ** P < .01; ***P < .001). (C) Immunostaining of DNM1 or PLP1 (green) in the tumor core (upper panels) and in the invasive area (lower panels) of P3 tumors. DAPI was used for nuclear staining (blue). Scale bars: 100 µm. The graphs represent DNM1 and PLP1 staining intensity of 10 different images of core and invasive areas from several patient sections (Student t-test, ***P < .001; ****P < .0001).
which unidentified protein candidates were discovered for tumor classification16 or for invadopodia structure.17 When
stringent statistical conditions were applied (padj<0.01 and logFC>2), 34 Human proteins were overexpressed and 118 were downregulated in invasive areas (out of 152 proteins present in the aggregated dataset).
Our analysis also included the estimation of an AngioScore. This latter approach was already success-fully used in a previous publication from our team.11 In the
AngioScore, we compared the 30 best hits between core and
invasive areas, and confirmed enrichment angiogenesis-related proteins in the core area. Furthermore, the AngioScore was significantly reduced in the invasive area.
To reinforce the validity of our analysis, we only selected proteins which were overexpressed in the dif-ferent tumor areas of three difdif-ferent animals. PLP1 and DNM1 were among the top candidates. PLP1 is a proteolipid protein expressed in the myelinated neurons, which was recently found in glioblastoma by scRNAseq.18
However, this article did not discriminate between the
A
B
Control Control 310 155 78 Dynasore (μ M) Dynasore (μM) Zoom 2.0**
****
****
*
1.5 1.0 0.5 4 3 2 1 Cont 78 155 310 0 0 Control PLP inh. In vasion (a.u.) In vasion (a.u.) PLP inh.Figure 4. DNM1 and PLP1 control P3 cell invasion. (A) P3 cells were included into Collagen I gels and then incubated with control or PLP1 inhibitor (80 µg/ml). P3 spheroid invasion was measured in collagen I gels after 24 h. Scale: 50 µm. The graph represents the results as means ± SD of three independent experiments, each done in eight replicates for each condition. **P < .01 (Student t-test). (B) P3 cells were included into Collagen I gels and then incubated with control or DNM1 inhibitor Dynasore at several concentrations (78, 155, or 310 µM). P3 spheroid invasion was measured in collagen I gels after 24 h. Scale: 50 µm. The graph represents the results as means ± SD of three independent experiments, each done in eight repli-cates for each condition. *P < .05; ****P < .0001 (ANOVA).
viable core and the invasive areas. PLP was shown to be expressed in glioblastoma without isoform distinc-tion12 but more recently, the PLP1 isoform was reported
as oligodendrocytic marker.19 We reinforced our
anal-ysis by immunohistology using a specific anti-PLP1 an-tibody, to ascertain its overexpression in the invasive area. Furthermore, we performed functional analysis using a specific PLP inhibitor and found that tumor cell invasion was inhibited. A similar analysis was performed on DNM1. DNM1 has been studied in acute myeloid leu-kaemia, lung, and colon adenocarcinomas but not in glioblastoma.20 In glioblastoma, DNM1 was recently
char-acterized as a marker of long-term patient survival in a computational analysis.21 At a biological level, DNM1 was
found to form a complex with Cortactin in glioma cells.14
Our data are not in agreement with a publication which
reported a role of DNM2 in glioblastoma invasion using the standard glioblastoma cell lines LN444 and SNB19.22
DNM2 is highly expressed in all cancer types contrary to the expression of DNM1, which is mainly expressed in glioma, as referenced in TCGA. Furthermore, DNM2 is not a good prognosis marker for glioblastoma patient sur-vival (TCGA database). Dynamin 2 was also recently de-scribed as a potential therapeutic target for glioblastoma development.23 In our analysis, 2′,3′-cyclic-nucleotide
3′-phosphodiesterase (CNP, log2 fold change of 1.28) was significantly overexpressed in the core area in agree-ment with a previously published study.24 CNP is not
well studied in glioblastoma development and can be of interest for further studies. Furthermore, as indicated by the enrichment analysis, metabolic pathways were highly represented in both Human and mouse protein data sets.
Dynasore (μM) Dynasore (μM) Dynasore (μM) Cont 155 Liv e / Dead Liv e / Dead 310 620 PLPi (μM) 20 40 80 100 ns **** **** 80 60 40 20 0 155 310 620 Cell viability (%) 2.5 2.0 1.5 1.0 0.5 0.0 0 24 48 72 ** ** ** * ** Time (h) 0 24 48 72 ns Time (h) Cont 155 310 620 Cont 20 40 80 Cell prolif eration vs control (A.U .) 2.5 2.0 1.5 1.0 0 Cell prolif eration vs control (A.U .)
A
B
D
PLP inbibitor (μM) PLP inbibitor (μM) Cont 100 ns 80 60 40 20 0 20 40 80 Cell viability (%)C
Figure 5. DNM1 inhibitor Dynasore reduces cell viability and proliferation at high doses. (A) Cell viability was recorded in live microscopy with Dead/Live kit (Invitrogen) as represented in lower panels (blue for living cells and red for dead cells). Dynasore was used at 155, 310, or 620 µM as indicated. The graph represents the percentage of living cells at the time of 72 h, and the results as means ± SD of three independent experiments, each done in 10 replicates for each condition. ns, nonsignificant; ****P < .0001 (ANOVA). (B) Cell proliferation was recorded in live microscopy at time 24, 48, and 72 h. Dynasore was used at 155, 310, or 620 µM as indicated. The graph represents cell proliferation at different time points, and the results as means ± SD of three independent experiments, each done in 10 replicates for each condition. ns, nonsignificant; **P < .01; ***P < .001; ****P < .0001 (ANOVA). (C) Cell viability was recorded in live microscopy with Dead/Live kit (Invitrogen) as represented in lower panels (blue for living cells and red for dead cells). PLP1 inhibitor (PLPi) was used at 20, 40, or 80 µM as indicated. The graph represents the percentage of living cells at the time of 72 h, and the results as means ± SD of three independent experiments, each done in 10 replicates for each condition. ns, nonsignificant (ANOVA). (D) Cell proliferation was recorded in live microscopy at time 24, 48, and 72 h. PLP1 inhibitor (PLPi) was used at 20, 40, or 80 µM as indicated. The graph represents cell proliferation at different time points, and the results as means ± SD of three independent experiments, each done in 10 replicates for each condition. ns, nonsignificant (ANOVA).
We validated the regional expression of PLP1 and DNM1 by analyzing their RNA expression in the Ivy Glioblastoma Atlas Project database. Both candidates were found upregulated in the infiltrative tumor (IT), and the leading edge (LE) when compared with core areas (Cellular Tumor—CT). These areas were defined by histological characteristics, by evaluating the number of tumor cells in the sections. This correlation indicates that both tumor genes and proteins are involved in glioblastoma invasion.
Our study differs from the previous proteomics anal-ysis where two different PDX glioblastoma models (angi-ogenic or invasive) were compared.25 In the latter analysis,
Annexin A2 (ANXA2) and Calnexin (CNX) were found upregulated in the angiogenic model. A second prote-omics study, from the same group, investigated effects of bevacizumab, which significantly modulated the tumor proteome.26 Bevacizumab induces a switch from
angio-genic to invasive tumors, largely documented in the lit-erature.5,27 Our study is completely different from these
studies above since they did not take into account re-gional heterogeneity. Thus, the results from the proteomics cannot be compared, except for Isocitrate dehydrogenases 1 and 2 (IDH1, IDH2), ANXA5, and alpha-Enolase (ENO1) which were found upregulated in the angiogenic tumor model26 and in the core area in our study. All together, we
highlight in this study underexplored proteins, which show evidence of a role in cell invasion.
Supplementary Material
Supplementary material is available online at
Neuro-Oncology (http://neuro-oncology.oxfordjournals.org/).
Keywords
glioblastoma | intratumor heterogeneity | invasion | patient-derived xenograft | proteomics analysis.
Authors’ Contributions
T.D. and J.G. performed biological experiments; B.D., J.R., and J.H. performed bioinformatics analysis; A-.A.R. and J.W.D. per-formed proteomics experiments; Z.E. perper-formed LCM experi-ments; T.D., A-.A.R., F.S., R.B., M.N., and A.B. discussed the results; M.N. supervised the bioinformatics analysis; T.D. and A.B. designed and supervised research; T.D., M.N., and A.B. wrote the manuscript.
Acknowledgments
This work was supported by grants from Institut National de la Santé et de la Recherche Médicale (INSERM) (recurrent funding), and from the “Ligue contre le Cancer” and the “Conseil Régional Nouvelle Aquitaine” to A.B., by Helse Vest, Haukeland Hospital, The Norwegian Research Council and Stiftelsen Kristian Gerhard Jebsen Research Foundation for R.B. and by the “Plan Cancer” for
J.R.. The Oncoprot platform was supported by Nouvelle-Aquitaine Region with European Regional Development Fund.
Conflict of interest statement. None declared.
References
1. Louis DN, Perry A, Reifenberger G, et al. The 2016 World Health Organization classification of tumors of the central nervous system: a summary. Acta Neuropathol. 2016;131(6):803–820.
2. Stupp R, Mason WP, van den Bent MJ, et al. Radiotherapy plus con-comitant and adjuvant temozolomide for glioblastoma. N Engl J Med. 2005;352(10):987–996.
3. Das S, Marsden PA. Angiogenesis in glioblastoma. N Engl J Med. 2013;369(16):1561–1563.
4. Kotliarova S, Fine HA. SnapShot: glioblastoma multiforme. Cancer Cell. 2012;21(5):710–710 e711.
5. Keunen O, Johansson M, Oudin A, et al. Anti-VEGF treatment reduces blood supply and increases tumor cell invasion in glioblastoma. Proc
Natl Acad Sci U S A. 2011;108(9):3749–3754.
6. Daubon T, Léon C, Clarke K, et al. Deciphering the complex role of thrombospondin-1 in glioblastoma development. Nat Commun. 2019;10(1):1146.
7. Bougnaud S, Golebiewska A, Oudin A, et al. Molecular crosstalk be-tween tumour and brain parenchyma instructs histopathological fea-tures in glioblastoma. Oncotarget. 2016;7(22):31955–31971.
8. Perkins DN, Pappin DJ, Creasy DM, Cottrell JS. Probability-based pro-tein identification by searching sequence databases using mass spec-trometry data. Electrophoresis. 1999;20(18):3551–3567.
9. Benjamini Y, Hochberg Y. Controlling the false discovery rate: a prac-tical and powerful approach to multiple testing. Journal of the Royal
Statistical Society, Series B. 1995;57(1):289–300.
10. Kolde R. Pheatmap: pretty heatmaps. R Package Version 61, 1–7 2012. 11. Soulet F, Kilarski WW, Roux-Dalvai F, et al. Mapping the extracellular
and membrane proteome associated with the vasculature and the stroma in the embryo. Mol Cell Proteomics. 2013;12(8):2293–2312. 12. Golfinos JG, Norman SA, Coons SW, et al. Expression of the genes
encoding myelin basic protein and proteolipid protein in human malig-nant gliomas. Clin Cancer Res. 1997;3(5):799–804.
13. Patel AP, Tirosh I, Trombetta JJ, et al. Single-cell RNA-seq high-lights intratumoral heterogeneity in primary glioblastoma. Science. 2014;344(6190):1396–1401.
14. Abe T, La TM, Miyagaki Y, et al. Phosphorylation of cortactin by cyclin-dependent kinase 5 modulates actin bundling by the dynamin 1-cortactin ring-like complex and formation of filopodia and lamellipodia in NG108-15 glioma-derived cells. Int J Oncol. 2019;54(2):550–558.
15. Wang J, Miletic H, Sakariassen PØ, et al. A reproducible brain tumour model established from human glioblastoma biopsies. BMC Cancer. 2009;9:465.
16. Henriet E, Abou Hammoud A, Dupuy JW, et al. Argininosuccinate synthase 1 (ASS1): a marker of unclassified hepatocellular adenoma and high bleeding risk. Hepatology. 2017;66(6):2016–2028.
17. Ezzoukhry Z, Henriet E, Cordelières FP, et al. Combining laser cap-ture microdissection and proteomics reveals an active transla-tion machinery controlling invadosome formatransla-tion. Nat Commun. 2018;9(1):2031.
18. Filbin MG, Tirosh I, Hovestadt V, et al. Developmental and onco-genic programs in H3K27M gliomas dissected by single-cell RNA-seq.
Science. 2018;360(6386):331–335.
19. Kong J, Cooper LA, Wang F, et al. Machine-based morphologic analysis of glioblastoma using whole-slide pathology images uncovers clinically relevant molecular correlates. PLoS One. 2013;8(11):e81049.
20. Haferlach T, Kohlmann A, Wieczorek L, et al. Clinical utility of microarray-based gene expression profiling in the diagnosis and subclassification of leukemia: report from the International Microarray Innovations in Leukemia Study Group. J Clin Oncol. 2010;28(15):2529–2537.
21. Patel VN, Gokulrangan G, Chowdhury SA, et al. Network signa-tures of survival in glioblastoma multiforme. PLoS Comput Biol. 2013;9(9):e1003237.
22. Feng H, Liu KW, Guo P, et al. Dynamin 2 mediates PDGFRα-SHP-2-promoted glioblastoma growth and invasion. Oncogene. 2012;31(21):2691–2702.
23. Luwor R, Morokoff AP, Amiridis S, et al. Targeting glioma stem cells by functional inhibition of dynamin 2: a Novel treatment strategy for glio-blastoma. Cancer Invest. 2019;37(3):144–155.
24. Zorniak M, Clark PA, Leeper HE, et al. Differential expression of 2’,3’-cyclic-nucleotide 3’-phosphodiesterase and neural lineage markers correlate with glioblastoma xenograft infiltration and patient survival.
Clin Cancer Res. 2012;18(13):3628–3636.
25. Rajcevic U, Petersen K, Knol JC, et al. iTRAQ-based proteomics profiling reveals increased metabolic activity and cellular cross-talk in angiogenic compared with invasive glioblastoma phenotype. Mol Cell Proteomics. 2009;8(11):2595–2612.
26. Demeure K, Fack F, Duriez E, et al. Targeted proteomics to assess the re-sponse to anti-angiogenic treatment in human glioblastoma (GBM). Mol
Cell Proteomics. 2016;15(2):481–492.
27. Obad N, Espedal H, Jirik R, et al. Lack of functional normalisation of tu-mour vessels following anti-angiogenic therapy in glioblastoma. J Cereb