HAL Id: hal-01788013
https://hal.archives-ouvertes.fr/hal-01788013
Submitted on 8 May 2018
HAL is a multi-disciplinary open access
archive for the deposit and dissemination of
sci-entific research documents, whether they are
pub-lished or not. The documents may come from
teaching and research institutions in France or
abroad, or from public or private research centers.
L’archive ouverte pluridisciplinaire HAL, est
destinée au dépôt et à la diffusion de documents
scientifiques de niveau recherche, publiés ou non,
émanant des établissements d’enseignement et de
recherche français ou étrangers, des laboratoires
publics ou privés.
FES as a tumor suppressor in melanoma
Michael Olvedy, Julie Tisserand, Flavie Luciani, Bram Boeckx, Jasper
Wouters, Sophie Lopez, Florian Rambow, Sara Aibar, Bernard Thienpont,
Jasmine Barra, et al.
To cite this version:
Michael Olvedy, Julie Tisserand, Flavie Luciani, Bram Boeckx, Jasper Wouters, et al..
Compara-tive oncogenomics identifies tyrosine kinase FES as a tumor suppressor in melanoma. Journal of
Clinical Investigation, American Society for Clinical Investigation, 2017, 127 (6), pp.2310 - 2325.
�10.1172/JCI91291�. �hal-01788013�
Comparative oncogenomics identifies tyrosine
kinase FES as a tumor suppressor in melanoma
Michael Olvedy, … , Paulo De Sepulveda, Jean-Christophe
Marine
J Clin Invest. 2017;
127(6)
:2310-2325.
https://doi.org/10.1172/JCI91291
.
Identification and functional validation of oncogenic drivers are essential steps toward
advancing cancer precision medicine. Here, we have presented a comprehensive analysis
of the somatic genomic landscape of the widely used BRAF
V600E- and NRAS
Q61K-driven
mouse models of melanoma. By integrating the data with publically available genomic,
epigenomic, and transcriptomic information from human clinical samples, we confirmed the
importance of several genes and pathways previously implicated in human melanoma,
including the tumor-suppressor genes phosphatase and tensin homolog (PTEN), cyclin
dependent kinase inhibitor 2A (CDKN2A), LKB1, and others. Importantly, this approach also
identified additional putative melanoma drivers with prognostic and therapeutic relevance.
Surprisingly, one of these genes encodes the tyrosine kinase FES. Whereas FES is highly
expressed in normal human melanocytes, FES expression is strongly decreased in over
30% of human melanomas. This downregulation correlates with poor overall survival.
Correspondingly, engineered deletion of Fes accelerated tumor progression in a
BRAF
V600E-driven mouse model of melanoma. Together, these data implicate FES as a
driver of melanoma progression and demonstrate the potential of cross-species
oncogenomic approaches combined with mouse modeling to uncover impactful mutations
and oncogenic driver alleles with clinical importance in the treatment of human cancer.
Research Article
Genetics
Oncology
Find the latest version:
http://jci.me/91291/pdf
Introduction
Genome-wide scans and resequencing efforts have recently revealed hundreds of recurrent copy-number alterations (CNAs) and point mutations across diverse human cancers. However, genomic instability and heterogeneity of human tumors impedes a straightforward cataloguing of cancer-causing genes and of possible therapeutic targets. Strategies enabling the distinction of causal genetic alterations (drivers) from bystander genomic noise (passengers) are needed to facilitate the discovery of genes that drive oncogenesis. Although several approaches have recently been described, the statistical power of these approaches depends on very large sample numbers (1). Another major limitation of human cancer-genome characterization studies is the lack of rig-orous in vivo functional validation. Studies that include function-al data invariably rely upon transfection studies in cultured cells, which lack many hallmarks of naturally arising tumors (2). There is therefore the pressing need to combine comparative oncogenomic
approaches with in vivo cancer models to identify and validate new bona fide cancer genes/pathways that drive cancer progression and/or metastasis.
Malignant melanoma is one of the most aggressive and treat-ment-resistant human cancers. Improvement of clinical outcomes for this disease remains a major challenge. Despite the recent developments in melanoma therapies, most of the patients with metastatic melanoma still succumb to their disease (3). The molec-ular genetics of melanoma, and in particmolec-ular how specific genom-ic and nongenomgenom-ic (epigenetgenom-ic) alterations interact to produce its aggressive/metastatic characteristics, remain poorly understood. This lack of knowledge has been a major barrier to rational devel-opment of effective therapeutics and prognostic diagnostics for melanoma patients. One confounding factor of discriminating drivers in human melanoma is the particularly high background mutation burden due to UV mutagenesis (4).
Substantial progress in our understanding of the etiologies and genetic underpinnings of melanoma has nevertheless been made and has led to promising results in trials of targeted ther-apies for this disease. A key advance was the discovery of the recurrent somatic mutations in the gene encoding the BRAF ser-ine-threonine kinase, the BRAFV600E mutation being the most
common, in about 50% of patients (5). Large single-center studies, meta-analyses, and whole-exome sequencing (WES) efforts have Identification and functional validation of oncogenic drivers are essential steps toward advancing cancer precision
medicine. Here, we have presented a comprehensive analysis of the somatic genomic landscape of the widely used BRAFV600E- and NRASQ61K-driven mouse models of melanoma. By integrating the data with publically available genomic,
epigenomic, and transcriptomic information from human clinical samples, we confirmed the importance of several genes and pathways previously implicated in human melanoma, including the tumor-suppressor genes phosphatase and tensin homolog (PTEN), cyclin dependent kinase inhibitor 2A (CDKN2A), LKB1, and others. Importantly, this approach also identified additional putative melanoma drivers with prognostic and therapeutic relevance. Surprisingly, one of these genes encodes the tyrosine kinase FES. Whereas FES is highly expressed in normal human melanocytes, FES expression is strongly decreased in over 30% of human melanomas. This downregulation correlates with poor overall survival. Correspondingly, engineered deletion of Fes accelerated tumor progression in a BRAFV600E-driven mouse model
of melanoma. Together, these data implicate FES as a driver of melanoma progression and demonstrate the potential of cross-species oncogenomic approaches combined with mouse modeling to uncover impactful mutations and oncogenic driver alleles with clinical importance in the treatment of human cancer.
Comparative oncogenomics identifies tyrosine kinase
FES as a tumor suppressor in melanoma
Michael Olvedy,1,2 Julie C. Tisserand,3 Flavie Luciani,1,2 Bram Boeckx,4,5 Jasper Wouters,6,7 Sophie Lopez,3 Florian Rambow,1,2 Sara Aibar,6,7 Bernard Thienpont,4,5 Jasmine Barra,1,2 Corinna Köhler,1,2 Enrico Radaelli,8 Sophie Tartare-Deckert,9 Stein Aerts,6,7 Patrice Dubreuil,3 Joost J. van den Oord,10 Diether Lambrechts,4,5 Paulo De Sepulveda,3 and Jean-Christophe Marine1,2
1Laboratory for Molecular Cancer Biology, Center for Cancer Biology, Vlaams Instituut voor Biotechnologie (VIB), Leuven, Belgium. 2Laboratory for Molecular Cancer Biology, Department of Oncology, KU
Leuven, Leuven, Belgium. 3INSERM, Aix Marseille University, CNRS, Institut Paoli-Calmettes, CRCM, Equipe Labellisée Ligue Contre le Cancer, Marseille, France. 4Laboratory for Translational Genetics, Center
for Cancer Biology, VIB, Leuven, Belgium. 5Laboratory for Translational Genetics, and 6Laboratory of Computational Biology, Department of Human Genetics, KU Leuven, Leuven, Belgium. 7Laboratory
of Computational Biology, and 8Mouse Histopathology Core Facility, VIB Center for Brain & Disease Research, Leuven, Belgium. 9Centre Méditerranéen de Médecine Moléculaire (C3M), INSERM, U1065,
Université Côte d’Azur, Nice, France. 10Laboratory of Translational Cell and Tissue Research, Department of Pathology, KU Leuven and UZ Leuven, Leuven, Belgium.
Authorship note: M. Olvedy, J.C. Tisserand, and F. Luciani are co–first authors. D.
Lam-brechts, P. De Sepulveda, and J.C. Marine are co–senior authors.
Conflict of interest: The authors have declared that no conflict of interest exists. Submitted: October 21, 2016; Accepted: March 2, 2017.
Reference information: J Clin Invest. 2017;127(6):2310–2325.
Strikingly, somatic variants were rare in all lesions, with an average of 1.33 missense mutations per lesion (Supplemental Fig-ure 1A). In total, 16 mutations were identified and independently validated using an orthogonal genotyping method. Notably, loss of Trp53 did not significantly increase the number of missense mutations (Supplemental Figure 1A and Supplemental Table 2). Likewise, we identified and independently validated only 1 single indel across all 12 lesions. This indel caused a frameshift deletion in Fbxw22 and is predicted to cause a loss-of-function phenotype (Supplemental Figure 1A). The number of missense mutations in each lesion was significantly lower than in sun-exposed human melanoma (8). Similarly to non–sun-exposed human melanoma (8), we failed to identify a specific mutational signature or muta-tional bias (Supplemental Figure 1B), due to low mutation burden. Consistent with the low mutation burden, we identified only 1 recurrent missense mutation in A230050P20Rik. However, this mutation was found in 2 different tumors isolated from the same mouse, indicating that these lesions are likely to be clonally related as opposed to being driven by an independent recurrent event. None of the missense mutations were found in genes that are known to be significantly (q ≤ 0.05) mutated in human melanoma according to MutSig2CV analysis (Broad Institute TCGA Genome Data Analysis Center – 2016: Mutation Analysis; MutSig2CV v3.1). Nevertheless, in the cohort of human melanomas from TCGA (n = 290), 4 out of 14 orthologous genes were recurrently mutated and 8 harbored pro-tein-inactivating mutations such as nonsense or splice-site muta-tions or frameshift delemuta-tions (Supplemental Table 2).
Recurrent CNAs in murine melanomas. To assess the role of
chromosomal aberrations in BRAFV600E- and NRASQ61K-driven
melanomas, whole-genome shallow sequencing (WGSS) was per-formed and the landscape of somatic CNAs was established based on read depth. In total we sequenced 70 primary melanoma lesions (Figure 1 and Supplemental Table 1) derived from 35 BRAFV600E-
and 35 NRASQ61K-mutant mice. Among the BRAFV600E-driven
mel-anoma lesions, 7 were engineered to lack Ink4a, 6 had conditional deletion of Pten (14), 6 were knockouts for Cdkn2a locus, and 10 carried a Trp53R172H mutation frequently observed in UV-exposed
human melanoma (19, 24). Of the NRASQ61K-driven lesions, 5 had
deletion in Ink4a, 5 had deletion of the full Cdkn2a locus, and 16 carried conditional deletion in at least 1 of the Trp53 alleles.
Chromosomal aberrations — both in terms of whole-chro-mosomal (broad) and focal CNAs — were significantly higher in NRASQ61K- than in BRAFV600E-driven tumors (Supplemental Figure
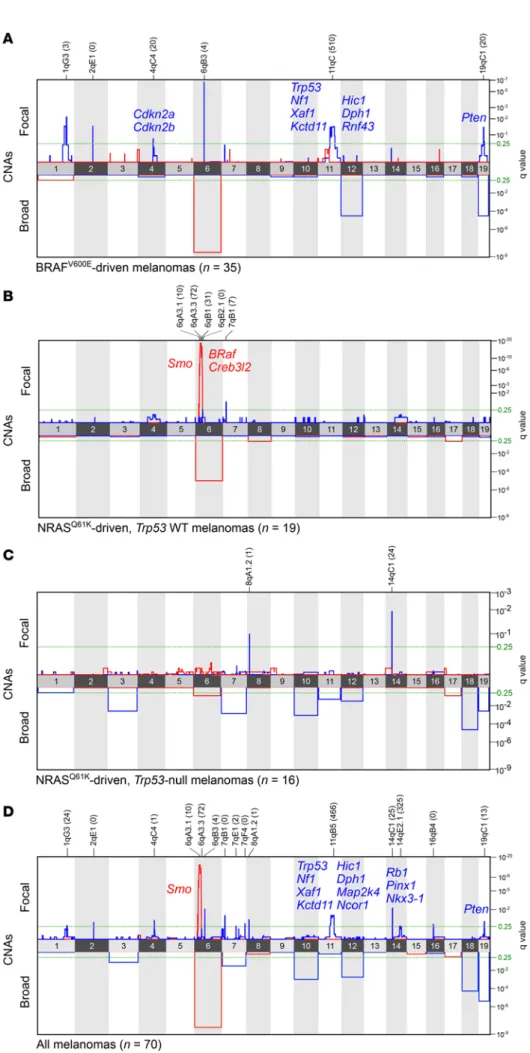
2A). Nevertheless, GISTIC (https://software.broadinstitute.org/ software/cprg/?q=node/31) identified recurrently deleted regions in BRAFV600E-driven melanoma, encompassing well-established
tumor-suppressor genes, including Cdkn2a and Cdkn2b (11%; q = 1.76 × 10⁻¹) and Pten (26%; q = 4.20 × 10⁻²) as well as Trp53 and Nf1
(14%, q = 3.40 × 10⁻²; Figure 2, A–D, and Supplemental Table 3 for
an overview of all recurrently deleted loci). Whereas chromosome 12 (harboring, among other tumor suppressors, p27Kip1) and chro-mosome 19 (harboring Pten) were significantly deleted (17%, q = 2.80 × 10⁻⁵ and 17%, q = 2.80 × 10⁻⁵, respectively), amplification
of chromosome 6, which contains Kras and c-Raf, was frequently observed (23%, q = 2.73 × 10⁻⁹; Figure 2A).
In addition to few other recurrent focal CNAs (Supplemen-tal Table 3), GISTIC identified 3 distinct regions located next to subsequently confirmed that BRAFV600E mutations are among the
most common activating genetic events detected in cutaneous melanomas (4, 6–8). Accordingly, mice engineered to express BRAFV600E in melanocytes develop melanoma at a median
laten-cy of 12.6 months (9). This mutation overactivates the MAPK/ ERK signaling pathway, leading to melanocytic hyperproliferation (10). Importantly, BRAFV600E-mutant melanomas are addicted to
this oncogenic driver mutation and targeted therapies against the BRAFV600E-activated oncogene have demonstrated very effective
antitumor responses in patients (11, 12). Activation of the MAPK signaling pathway in about 20% of cutaneous melanoma is a con-sequence of NRAS mutations (6), and melanocyte-specific expres-sion of NRASQ61K drives melanoma formation in mice (13).
Both BRAFV600E- and NRASQ61K-driven mouse melanoma
lesions recapitulate many histopathological features that are seen in subsets of human melanomas (9, 13–15). The long latency in these models (>10 months) indicates that additional genomic alterations are required for tumor progression. Loss-of-function mutations in phosphatase and tensin homolog (PTEN), cyclin dependent kinase inhibitor 2A (CDKN2A), or cyclin-dependent kinase inhibitor 2A (INK4A) and transformation related protein 53 (TRP53), events that are frequently observed in human melanoma (16), have been shown to increase the penetrance and reduce the latency of these BRAFV600E- and/or NRASQ61K-driven mouse
mela-noma lesions (13, 14, 17–20). Importantly, since these melamela-noma lesions develop in the absence of UV exposure, the background mutation frequency is likely to be dramatically reduced. We there-fore hypothesized that these models are well suited for a compara-tive cancer genome study aimed at identifying genetic events that drive melanoma initiation and progression in cooperation with oncogenic BRAF and NRAS and, importantly, validating their rel-evance in the appropriate in vivo context.
Results
Low mutation burden in murine melanoma. In an effort to identify
novel melanoma drivers, BRAFV600E- and NRASQ61K-driven
spon-taneous cuspon-taneous melanoma mouse lesions were subjected to WES at an average coverage depth of ×60 (Supplemental Table 1; supplemental material available online with this article; https:// doi.org/10.1172/JCI91291DS1). BRAFV600E-driven lesions lacking
p16INK4A (thereafter referred to as INK4A) in the melanocyte
lin-eage (Tyr-CreERT2/° BrafLSL–V600E/+ Ink4a–/– mice) and NRASQ61K
–mel-anoma lacking both Trp53 alleles (Trp53-null) in the melanocyte lineage (Tyr-Cre Tyr-NrasQ61K/° Trp53fl/fl mice) were also analyzed
(21, 22). Note that although the loss of these tumor suppres-sors accelerated melanomagenesis, frank cutaneous melanoma lesions only appeared on average after 57 weeks in the absence of
Ink4a and after 30 weeks on the Trp53-null background. In total,
8 BRAFV600E-driven (2 of which originated from the same mouse)
and 4 NRASQ61K-driven melanoma lesions were sequenced
(Sup-plemental Figure 1A). We also sequenced matching germline DNA from each intercross (4 Tyr-CreERT2/° BrafLSL–V600E/+ Ink4a–/–, 2
Tyr-NrasQ61K/° and 2 Tyr-Cre Tyr-NrasQ61K/° Trp53fl/fl) at an average
cov-erage depth of ×60. We identified all somatic variants in these 12 melanoma lesions using an established pipeline that had been pre-viously used to reliably identify a large number of carcinogen-in-duced somatic mutations in mouse squamous cell carcinomas (23).
Whole-chromosome aberrations, and in particular losses (of chromosomes 1, 3, 7, 10, 11, 12, 18, and 19), were especially fre-quent in samples carrying conditional deletion in one or both Trp53 alleles (Figure 1 and Figure 2C, Supplemental Figure 2C, Supple-mental Figure 3A, and SuppleSupple-mental Table 5). Importantly, quan-titative reverse-transcriptase PCR (RT-qPCR) analysis revealed that Trp53 mRNA levels in all Trp53 heterozygous lesions were comparable to those seen in Trp53-null lesions, indicating that all 4 heterozygous lesions underwent Trp53 loss of heterozygosity (LOH) (Supplemental Figure 4A). These data indicate that there is a selective pressure for p53 loss of function on this background and that p53 deficiency promotes aneuploidy in skin melanoma. A similar phenomenon was recently described for nonmelanoma skin cancer (23) and was also observed in mouse liver cancers in which the p53 pathway was functionally inactivated (Supplemen-tal Figure 4B). Interestingly, comparing the results from GISTIC of different tumor types — including data from murine SCLCs (27) and cutaneous SCCs (23) — indicated that the recurrent broad alterations are cancer-type specific (Supplemental Figure 4C). For instance, whereas loss of chromosome 19 (harboring Pten) was commonly seen in all tumor types, except liver carcinoma, ampli-fication of chromosome 4 or loss of chromosome 9 was a very fre-quent event only in mouse small cell lung cancers (mSCLCs) and one another on chromosome 6, which are recurrently amplified
in NRASQ61K-driven lesions (Figure 2, B and D, and Supplemental
Table 3 and 4). One of these regions encompasses 31 genes, includ-ing Braf (68%, q = 1.05 × 10⁻¹⁶). The adjacent region contains 72
genes, including Smo (68%, q = 5.50 × 10⁻¹⁹), which encodes a key
transducer of hedgehog (Hh) signaling (25), and the third region did not carry any known or predicted oncogenes. The Braf-contain-ing region was no longer significantly amplified when all lesions, including the BRAFV600E-driven melanoma, were included in
GIS-TIC, indicating that this particular focal event specifically occurs on an NRASQ61K-mutant background. Notably, none of these 3
regions were amplified in NRASQ61K lesions that carried
inactivat-ing mutations within the Trp53 locus, indicatinactivat-ing the loss of p53 alleviates the need for these focal amplification events. In contrast, 2 focal losses on chromosome 8 (13%, q = 1.03 × 10⁻¹),
encompass-ing a sencompass-ingle gene (Csmd1), and chromosome 14 (25%, q = 1.21 × 10⁻²), encompassing 24 genes, were only observed in Trp53-null
NRASQ61K lesions (Figure 2C). Interestingly, Csmd1 is a tumor
sup-pressor frequently deleted and mutated in human melanoma and is commonly lost in many other tumor types (26). Overall, these data indicate that broad and focal CNAs are likely to influence the progression of BRAFV600E- and NRASQ61K-driven tumors by
affect-ing regions harboraffect-ing established and novel putative cancer genes.
Figure 1. Landscape of CNAs in genetically induced murine melanomas. Heat map of CNAs in 70 BRAFV600E- and NRASQ61K-driven murine melanomas. The
genetic background of each sample is color coded based on the legend provided at the bottom of the panel. The copy-number gains and losses are depict-ed in rdepict-ed and blue, respectively. Chromosome numbers are shown on the x axis. The total number of CNAs (focal and broad) is shown on the right panel.
Figure 2. GISTIC analysis of recurrent genetic alterations in murine melano-mas. Recurrent focal and whole-chro-mosomal amplification and deletion in
BRAFV600E-driven lesions (A; n = 35);
NRASQ61K-driven, Trp53 WT lesions (B;
n = 19); NRASQ61K-driven, Trp53
heterozy-gous or homozyheterozy-gous null lesions (C;
n = 16); and all samples combined (D;
n = 70). Recurrent deletions and
amplifica-tions are shown in red and blue, respec-tively. The green dashed lines in all panels indicate the set significance threshold of 0.25. Genes of interest are listed next to focal gains and losses, and the numbers of protein-coding genes in the peak of the CNA are shown in parentheses.
Single-nucleotide alterations (SNAs) were identified in 17 genes, and the promoter region of 396 genes exhibited evidence of DNA hypermethylation, an epigenetic mark that typically associates with repression of transcription (28, 29). Importantly, 30 of these genes had already been enlisted into various tumor-suppressor gene (TSG) databases, including UniProt (http://www.uniprot. org/) and that referenced by Vogelstein et al. (Table 1 and Sup-plemental Table 6; ref. 30). Webgestalt (http://webgestalt.org/ option.php), KEGG (http://www.genome.jp/kegg/genes.html), GeneSetDB (http://genesetdb.auckland.ac.nz/haeremai.html), and Ingenuity Pathway Analysis (IPA) (QIAGEN) revealed a sig-nificant enrichment in genes implicated in pathways known to play important roles in melanomagenesis such as TGF-β (Padj =
4.7 × 10⁻⁵), Wnt/β-catenin (P
adj. = 1.1 × 10⁻⁵), the MAPK signaling
pathway (Padj. = 5.5 × 10⁻⁵), Hh (P
adj = 2.4 × 10⁻²) and p53 signaling
(Padj = 1.3 × 10⁻³), and biological processes regulating the cell cycle
(Padj. = 2.0 × 10⁻⁹), apoptosis (P
adj. = 2.0 × 10⁻⁹), and cell movement
(Padj. = 3.0 × 10⁻¹⁰). IPA also indicated that the majority of these
genes (23 out of 30, 76%) have multiple biological functional connections, indicating that this list is enriched for alterations/ mutations affecting functionally interacting proteins (Supple-mental Figure 6 and Supple(Supple-mental Table 7).
Strikingly, virtually all of the genes validated as tumor sup-pressors in the BRAFV600E- and/or NRASQ61K-driven melanoma
mouse models, namely Pten, Cdkn2b, Nf1, Trp53, and Stk11, were among the 30 selected genes (Table 1; ref. 14, 31–34). Sporadic mutations and/or downregulation of expression of APC (35) and
PDCD4 (36) in human melanoma have also been described.
Inter-estingly, one of these genes was the well-established negative reg-ulator of the Hh signaling pathway, Sufu. Notably, Kctd11, another negative modulator of this pathway, was present among the 30 putative melanoma TSGs that have not been previously linked to melanomagenesis (Table 1). These data, together with the identi-fication of Smo in a focally and recurrently amplified region of the mouse melanoma genome (Figure 2B), indicate that increased Hh signaling may contribute to melanomagenesis.
Importantly, further in silico analysis of the RNA-sequencing (RNA-seq) data set from the melanoma TCGA cohort revealed significant clinical associations between the RNA abundance of 9 (out of 30) genes and patient survival (P < 0.1; Table 1 and Sup-plemental Table 6, ref. 37). Only one of these genes (i.e., PTEN) has been previously linked to melanoma. Together, these analyses identified a series of new likely drivers and progression pathways with clinical importance in human melanoma.
A tumor-suppressor function for FES in human melanoma.
Giv-en that the cGiv-entral aim of this study was the idGiv-entification of new melanoma drivers with clinical relevance to the human disease, we focused our attention on the 8 above-described genes that have not been previously implicated in melanoma biology, name-ly NKX3-1, PRDM1, AGAP2, TNFAIP3, FES, KCTD11, RAP1A, and
BCL10. Importantly, analysis of a microarray data set (38)
identi-fied KCTD11, FES, and TNFAIP3 as the only 3 genes that — sim-ilarly to PTEN — exhibited average lower levels of expression in a series of melanoma cell lines compared with various normal human melanocyte cultures (Supplemental Figure 7A). Inter-estingly, only one of these genes (FES) showed a robust inverse correlation between RNA abundance and DNA methylation lev-nonmelanoma skin carcinomas, respectively. Similarly, recurrent
loss of chromosome 10 was only observed in mouse melanoma.
Comparative genomics identifies putative melanoma drivers.
GISTIC indicated that some of the focal and broad alterations described above occurred more frequently than expected by chance, suggesting that these events provide selective advan-tage during tumor progression and may therefore involve key cancer (and/or melanoma) genes. Importantly, these events are of potential clinical relevance in human melanoma, as a signifi-cant overlap between orthologous genes located on broad CNAs in human and murine melanoma was observed (Supplemental Figure 5, A–D). To begin cross-species analysis of human can-cer and murine melanoma genomes, we compiled a list of genes located in chromosomal regions (both focal and broad CNAs) that are recurrently and specifically deleted in mouse melanoma lesions (n = 5204 genes) and searched for evidence of (epi)genet-ic alterations and/or deregulation of expression of their human orthologues in the melanoma clinical samples from the TCGA cohort (see Methods for a detailed description of the pipeline). 1250 orthologues exhibited (focal or broad) CN loss with signifi-cant association between CN and RNA abundance (FDR ≤ 0.01).
Table 1. Comparative genomics identifies putative melanoma TSGs
Mouse
gene Human gene TSG validated in GEMMs of melanoma
Significant association between RNA abundance
and patient survival
Reference Pten PTEN x x 14 Cdkn2b CDKN2B x 31 Nf1 NF1 x 32 Stk11 STK11 (LKB1) x 33 Trp53 TP53 x 19 Fes FES x Agap2 AGAP2 x Prdm1 PRDM1 (BLIMP1) x Bcl10 BCL10 x Kctd11 KCTD11 x Nkx3-1 NKX3-1 x Rap1a RAP1A x
Tnfaip3 TNFAIP3 (A20) x
Apc APC Brms1 BRMS1 Cadm4 CADM4 Dph1 DPH1 (OVCA1) Hif3a HIF3A Kank1 KANK1 Lats1 LATS1 Map2k4 MAP2K4 (MKK4) Mcc MCC Men1 MEN1 Ncor1 NCOR1 Pdcd4 PDCD4 Rb1 RB1 Sash1 SASH1 Smad2 SMAD2 Smad4 SMAD4 Sufu SUFU
els in the vicinity of its transcription start site (TSS) (r = –0.7098,
P < 0.0001; Supplemental Figure 7B). Importantly, whereas
meth-ylated CpG islands clustered at the 5′ end of FES, CpG islands locat-ed within the gene body were not methylatlocat-ed (Figure 3A). These data indicated that downregulation of FES expression in human melanoma may occur through a DNA methylation- dependent mechanism. Given that, in contrast to copy-number loss, epigen-etic-dependent gene silencing can potentially be reversed using
epigenetic drugs, we focused our attention on this particular putative TSG. Intriguingly, FES encodes a tyrosine kinase, a class of proteins best known for their potential protumorigenic, rather than tumor-suppressive, functions.
Further inspection of the RNA-seq data from the TCGA cohort revealed that FES expression levels were low (below the mean) in about 40% of these clinical samples (Figure 3A and Supplemental Figure 8A). Notably, there was no bias for any specific common
Figure 3. FES expression is regulated by promoter methylation in human melanomas. (A) Analysis of FES expression in 474 melanoma clinical sam-ples from the TCGA cohort. The left panel shows FES mRNA levels ordered from the highest (red) to the lowest (green). The middle panel shows DNA methylation profile obtained from 19 array probes located in the CpG sites of FES. The schematic above shows a representation of the FES locus, with UTR regions in white and exons in black. CpG positions are shown as red stripes. The right panel depicts the copy number status of the FES locus split into
cases that show loss (in blue) and gain (in red) and samples in which the CNA status of FES was not assessed (in gray). (B) FES expression in short-term
melanoma cultures (MM) and 3 normal melanocyte cultures (NM). Upper graph shows expression of FES mRNA levels as determined by RT-qPCR. Values are normalized to the mean RNA level of normal melanocytes, which was set to 1. Error bars show mean ± SD (n = 2). The middle panel shows Western blot analysis of FES. Actin served as a loading control. The bottom panel shows methylation profile of short-term melanoma cultures and normal melanocytes
as determined by bisulfite sequencing of 20 CpG sites located at positions ranging from –72 to +115 from the FES′ TSS. BRAFV600E (B) and NRASQ61K,L,R (N)
mutational status is indicated on top of the sample name. (C) Expression of FES in MM031 cell culture after treatment with demethylating agent
decit-abine or its vehicle. The upper panel shows FES mRNA levels assessed by qRT-PCR. Western blot analysis in the 2 lower panels shows FES protein levels. GAPDH served as a loading control.
mutational event (i.e., BRAF versus NRAS mutations) to occur in these selected samples (Supplemental Figure 8B). Interestingly, low mRNA abundance significantly correlated with poor progno-sis (P = 0.0456; Supplemental Figure 8C). To further validate and extend these results, we assessed FES mRNA levels by RT-qPCR in 8 normal human primary melanocyte cultures (NHME), 12 short-term melanoma cultures, and 23 melanoma cell lines (38). Whereas high levels of FES were detected in NHME cultures, FES mRNA levels were lower in most melanoma cultures (Figure 3B, Supplemental Figure 7A, and Supplemental Figure 8D). Western blotting analysis confirmed that the decrease in mRNA levels was correlated with a concomitant decrease in FES protein levels (Fig-ure 3B and Supplemental Fig(Fig-ure 8E).
To further confirm this finding, the CpG DNA methylation status of the region flanking the FES′ TSS was assessed by bisul-fite sequencing in primary melanocytes and short-term (Figure 3B) and long-term (Supplemental Figure 8E) melanoma cultures. Lit-tle to no methylation was detected in primary melanocytes, which expressed high levels of FES. In contrast, the levels of CpG DNA methylation in human melanoma cultures were generally higher than in melanocytes and largely inversely correlated with FES mRNA abundance. Moreover, FES expression could be restored upon exposure of melanoma cells to 5-aza-2′-deoxycytidine (5-aza-dC, decitabine), which inhibits CpG methylation (Figure 3C).
Notably, in silico inspection of the human melanoma TCGA data indicated that the FES locus was not more frequently targeted by mutations than occurring by chance (MutSig 2CV, q = 1). Only a few missense mutations were identified (8 mutations from 278 patients from the TCGA cohort; 2.9%), and although 2 of these mutations affected residues located in the kinase domain (Supplemental Fig-ure 8F), these residues were not conserved and the mutations are not predicted to affect the kinase activity, according to Meta-SNP (http:// snps.biofold.org/meta-snp/) and PredictSNP2 (http://loschmidt. chemi.muni.cz/predictsnp2/; ref. 39). Together, these data indicate that cytosine methylation, rather than inactivating mutations, is a common mechanism of FES silencing in human melanoma.
The observation that FES is expressed in NHME was both new and, to some extent, surprising. Importantly, FES protein expression was readily detected by IHC in melanocytes from nor-mal human skin, ruling out the possibility that the high levels of
expression detected in NHME cultures was an artifact of in vitro culturing. Whereas FES expression was also elevated in all benign nevi examined, FES immunoreactivity varied from high/medium (FES positive) to very low/undetectable (FES negative) in various cutaneous melanoma samples included in an initial survey study (Figure 4A). Interestingly, in FES-positive samples, there was a tendency toward decreased immunoreactivity in the dermal inva-sive melanoma cells compared with the noninvainva-sive epidermal component (Figure 4A). Consistently, an anticorrelation between
FES mRNA levels and thickness according to Breslow (https://
xenabrowser.net) was observed in the TCGA clinical samples (Supplemental Figure 8G).
To further survey FES protein expression in a larger cohort of biospecimens, 2 tissue micro-arrays (TMAs) from UZ Leuven (40) and 3 commercially available TMAs (ME1004d + ME2081 + ME2082b) containing collectively 27 benign nevi, 219 primary melanomas, and 221 metastatic melanomas were examined. The majority of nevi (85%) were positive for FES, whereas 39% of pri-mary melanomas and 23% of metastatic melanomas expressed very low/undetectable FES levels. Two of the TMAs were anno-tated with survival outcomes and comprised 687 evaluable cores, corresponding to 176 melanomas, 40 of which were primary and 136 metastatic. Of the evaluable melanomas, 138 melanomas (75%) were positive (high/medium) and 38 (21%) were negative (low/undetectable) for FES. A statistically meaningful association was observed between FES protein levels and survival. Patients with low/undetectable levels of FES showed a significantly shorter survival than patients with high/medium FES protein expression (log-rank test: P = 0.0054, Figure 4B).
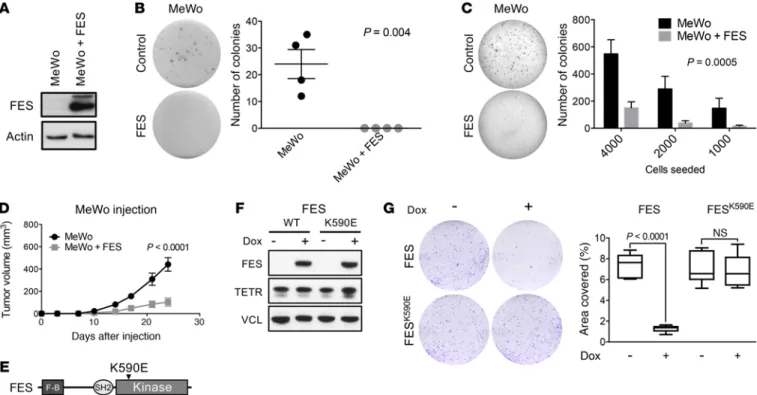
Importantly, whereas restoration of FES expression in 2 FES-negative melanoma cell lines (MeWo and 501 Mel) only min-imally affected the proliferative capacity of these cells in optimal growth conditions, it did drastically decrease the ability of MeWo (and to a lesser extent 501 Mel) to form colonies when plated at low density and to support anchorage-independent growth in soft agar (Figure 5, A–C, and Supplemental Figure 9). Moreover, FES expression dramatically decreased the ability of MeWo to form tumors when injected into immune-compromised mice (Figure 5D). Importantly, FES-dependent growth inhibition was depen-dent on the integrity of its kinase domain, as reintroduction of
Figure 4. Low FES expression defines a subset of human melanoma with poor prognosis. (A) Representative pictures of FES staining in human cutane-ous melanoma samples. Left panel shows FES staining in normal human skin; the inset shows a zoom-in view of a melanocyte residing in the basal layer of the epidermis. The three panels on the right show representative photographs of FES-positive and FES-negative melanoma cases. The photograph on the far right depicts the difference in the intensity of FES staining within melanoma. The epidermal layer (E) showed more intense staining compared with the dermal skin layer (D). Scale bars: 100 μm. (B) Kaplan-Meier curve of FES-positive versus FES-negative cases determined from FES staining on a tissue microarray containing 176 human metastatic melanoma samples. The survival time represents the time from the diagnosis of primary melanoma until the melanoma-related death of the patient. Statistical significance was determined by the Mantel-Cox test (α = 5.000%).
S100 (Figure 6E and data not shown). A significant increase in the proliferation index and in the number of cells positive for the cell proliferation marker Ki67 in BrafCA/+ Ptenfl/fl Fes KO, as
compared with WT, tumors (Figure 6, E and F) indicated that
Fes loss drives tumor progression, at least in part, by
promot-ing an increase in melanoma cell proliferation. Together, these data establish Fes as a suppressor of BRAFV600E-driven
mela-nomagenesis in mice.
To gain insights into the molecular mechanisms underlying Fes’ tumor-suppressor function, we profiled the transcriptome of
Tyr-CreERT2/° BrafCA/+ Ptenfl/fl Fes+/+ and Tyr-CreERT2/° BrafCA/+ Ptenfl/fl Fes–/–
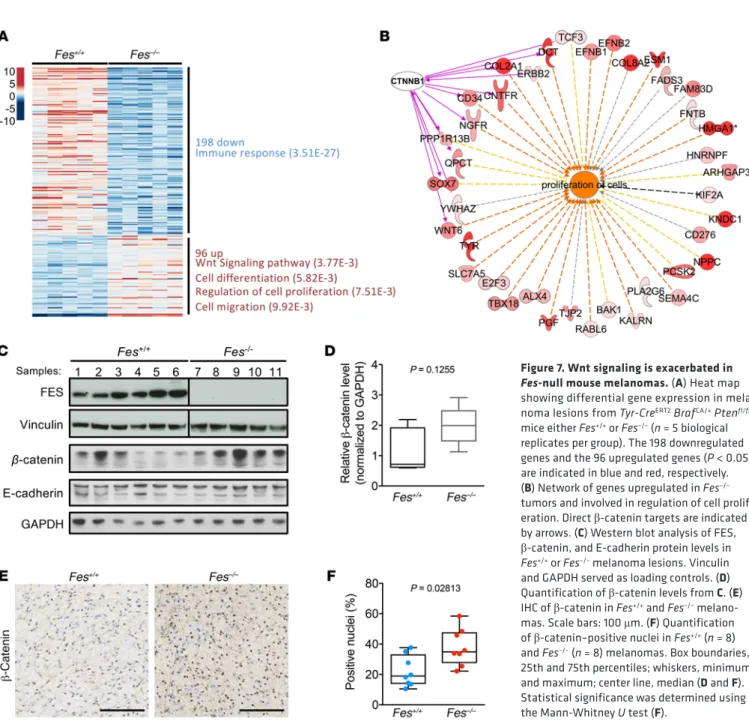
melanoma lesions (n = 5 per group) by RNA-seq. Differential gene expression analysis showed enrichment for signatures associated with increased Wnt signaling (P = 3.77 × 10⁻³) and cell proliferation
(P = 7.51 × 10⁻³) among the upregulated genes and immune response
among the downregulated genes (P = 3.51 × 10⁻²⁷; Figure 7, A and B,
and Supplemental Table 8). Previous reports indicated that active β-catenin signaling in melanoma is associated with increased cell proliferation and more aggressive disease (17). Moreover, tumor-in-trinsic β-catenin activation dominantly excludes T cell infiltration into the melanoma tumor microenvironment (43). An increase in β-catenin signaling may therefore, at least partly, drive both the increased cell proliferation gene expression signature and, indirect-ly, the downregulation of genes linked to immune response. a FES kinase–dead mutant (K590E; ref. 41) did not affect the
growth of MeWo melanoma cells (Figure 5, E–G). Together, these observations are consistent with a tumor-suppressor role for FES in human melanoma that depends on its kinase activity.
Fes deficiency promotes the progression of BRAFV600E-induced murine melanoma. Together, the above data raise the
possibil-ity that FES may function as a tumor suppressor in melanoma. In order to directly test this possibility, we combined a Fes-null allele (42) with the Tyr-CreERT2 BrafCA/+ alleles. The BrafCA/+
allele enables tamoxifen-inducible expression of the constitu-tively active BRAFV600E mutation. We initiated tumorigenesis
in Tyr-CreERT2/° BrafCA/+ Ptenfl/fl Fes+/+ (Fes WT) and Tyr-CreERT2/°
BrafCA/+ Ptenfl/fl Fes–/– (Fes KO) animals by tamoxifen exposure
on the back skin or tail. Macroscopic examination of the mel-anoma lesions after tumor induction revealed acceleration of tumor growth on the Fes- deficient background (Figure 6, A and B, and Supplemental Figure 10, A and B). Accordingly, Fes loss led to a significant reduction in tumor latency and significantly reduced overall survival (Figure 6C). Notably, Fes loss also led to a significant decrease in tumor latency and overall survival on the BrafCA/+ Ink4a–/– background, which is far less penetrant
than the BrafCA/+ Ptenfl/fl background (Figure 6D). Histological
analyses confirmed that the dissected tumors were of mela-nocytic origin and stained positive for the melanoma marker
Figure 5. FES reexpression decreases cell proliferation in vitro and in vivo in a kinase-dependent manner. (A) Western blot analysis of FES in MeWo cell line
with overexpression of FES. Actin served as a loading control. (B) Clonogenic assay of MeWo cells with and without expression of exogenous FES. Error bars
indicate mean ± SEM (n = 4 biological replicates per group). (C) Soft agar assay of MeWo cells with and without expression of exogenous FES. Error bars
indi-cate mean ± SEM (n = 3 biological repliindi-cates per group). (D) Mice (n = 9) were injected with 1 × 10⁶ MeWo cells to the left or MeWo cells expressing exogenous
FES to the right side of the body. The tumor volume was measured every 3 to 4 days up to day 24. Error bars indicate mean ± SEM (n = 9 biological replicates
per group). (E) Schematic indicating the location of the FES kinase-dead mutation. F-B, F-BAR domain. (F) Western blot analysis of doxycycline-induced
expression of WT or mutant FES in MeWo cell line. Vinculin served as a loading control. (G) Clonogenic assay of MeWo cells expressing WT or mutant FES.
Quantification of the assay measured as the percentage of area covered is shown in the graph on the right. Error bars indicate mean ± SEM (n = 3 biological
target genes, such as Trp1, Trp2, and Tyr, were observed in Fes KO melanoma lesions (Supplemental Figure 10, D and E). An increase in the cell differentiation gene expression signature (P = 5.82 × 10⁻³)
was also apparent in the Fes KO lesions (Figure 7A). Finally, consistent with an increase in expression of melanocytic pigmentation genes,
Fes KO melanoma lesions were more pigmented than their Fes WT
counterparts (Supplemental Figure 10F and data not shown). Togeth-er, these results establish a clear genetic link between FES and mela-noma progression and indicate that FES dampens tumor progression, at least in part, by decreasing β-catenin activation.
Discussion
Our study provides what we believe is the first comprehensive analysis of the genomic landscape of the widely used BRAFV600E-
and/or NRASQ61K-driven mouse models of melanoma. This
anal-ysis provides important insights into the biology of these geneti-Total β-catenin protein levels were not significantly higher
in Fes KO tumors. Similarly, mRNA expression levels of the gene encoding β-catenin (Ctnnb1) were not affected by Fes loss (Supple-mental Figure 10C). Consistent with elevated β-catenin signaling, however, a clear accumulation of nuclear β-catenin was observed in Fes-deficient lesions (Figure 7, C–F). In contrast, levels of p-Erk, p-Akt (Ser-473), and p-STAT3 were comparable in Fes WT and KO melanoma lesions, indicating that MAPK, PI3K, and JAK-STAT sig-naling were, by and large, not affected by Fes loss (data not shown). Expression of many melanocytic pigmentation genes is con-trolled by the melanocyte-specific isoform of melanogenesis-asso-ciated transcription factor (MITF), MITF-M, which is a downstream target of β-catenin signaling (44, 45). Enhanced β-catenin signaling in melanoma is therefore often accompanied by an MITF-M–depen-dent increase in melanocytic differentiation markers (17). Consis-tently, increased MITF-M protein levels and upregulation of MITF
Figure 6. Fes loss accelerates progression of BRAFV600E-driven, PTEN-deficient, or INK4a-deficient melanoma. (A) Representative photographs of Tyr-CreERT2
BrafCA/+ Ptenfl/fl mice either Fes+/+ or Fes–/– at days 27 and 41 after topical treatment of the back skin with 5 mM 4-HT. (B) Box plot shows the tumor volume
mea-sured at day 40 after 4-HT exposure of Fes+/+ (n = 13) or Fes–/– (n = 10). (C) Kaplan-Meier analysis of Fes+/+ (n = 13) and Fes–/– (n = 15) mice on a Tyr-CreERT2 BrafCA/+
Ptenfl/fl background. (D) Kaplan-Meier analysis of Fes+/+ (n = 7) and Fes–/– (n = 18) mice on a Tyr-CreERT2 BrafCA/+ Ink4a–/– background. (E) IHC of S100 melanoma and
Ki67 proliferation markers in Tyr-CreERT2 BrafCA/+ Ptenfl/fl melanomas that were WT or KO for Fes. Scale bars: 100 μm. (F) Proliferative index of Fes+/+ (n = 8) or Fes–/–
(n = 10) melanomas from E determined by counting Ki67+ nuclei within the tumor. Statistical significance was determined using the Mann-Whitney U test (B and
The majority of genomic alterations observed in the mouse lesions were focal and broad deletions, which are likely associat-ed with loss of TSG function. This is only partly surprising, since the lesions were engineered to already express either one of the two most common melanoma oncogenes, namely BRAFV600E and
NRASQ61K. Focusing on the recurrently deleted regions, a list of
30 putative melanoma tumor suppressors has been established through comparative oncogenomics analysis. A striking observa-tion is that a majority of these genes are highly funcobserva-tionally linked, which further supports the notion that melanoma therapies should be directed against signaling pathways themselves rather than individually mutated genes and provide a rational explanation as to why only transient therapeutic responses to BRAFV600E
inhibi-tors are observed in BRAF-mutated melanoma patients (12). All melanoma TSGs validated genetically using mouse mod-els, namely Pten, Cdkn2b, Nf1, Trp53, and Stk11 (also known as cally engineered melanomas. Moreover, because of the reduced
mutational noise compared with human melanoma, comparative genome analysis of these mouse lesions with their human coun-terparts and integration of these data with publically available epigenomic and transcriptomic data from human melanoma clin-ical samples allowed the identification of what we believe are pre-viously unknown drivers of melanoma progression.
Our analysis reveals highly molded somatic melanoma mouse genomes with a very low somatic point mutation frequency and much fewer CNAs and structural rearrangements than their human counterparts. Notably, as previously observed in other p53-deficient mouse cancers, including lung (27), lymphoma (46), or nonmelanoma skin cancers (23), functional inactivation of p53 led to dramatic chromosomal rearrangements. Inactivation of p53 can therefore be used as a genetic trick to recapitulate the dramatic chromosomal rearrangements seen in human melanoma.
Figure 7. Wnt signaling is exacerbated in
Fes-null mouse melanomas. (A) Heat map
showing differential gene expression in mela-noma lesions from Tyr-CreERT2 BrafCA/+ Ptenfl/fl mice either Fes+/+ or Fes–/– (n = 5 biological
replicates per group). The 198 downregulated genes and the 96 upregulated genes (P < 0.05) are indicated in blue and red, respectively.
(B) Network of genes upregulated in Fes–/–
tumors and involved in regulation of cell prolif-eration. Direct β-catenin targets are indicated
by arrows. (C) Western blot analysis of FES,
β-catenin, and E-cadherin protein levels in
Fes+/+ or Fes–/– melanoma lesions. Vinculin
and GAPDH served as loading controls. (D)
Quantification of β-catenin levels from C. (E)
IHC of β-catenin in Fes+/+ and Fes–/–
melano-mas. Scale bars: 100 μm. (F) Quantification
of β-catenin–positive nuclei in Fes+/+ (n = 8)
and Fes–/– (n = 8) melanomas. Box boundaries,
25th and 75th percentiles; whiskers, minimum
and maximum; center line, median (D and F).
Statistical significance was determined using
analysis indeed indicated that FES may function as a Wnt path-way inhibitor and, consistently, an increase in nuclear β-catenin levels was observed in Fes-deficient BRAFV600E-driven tumors.
This observation is in line with the previously reported cooperativ-ity between stabilized β-catenin and BRAFV600E in the formation
of aggressive mouse melanomas (17). Note that since stabilized β-catenin also cooperates with activated NRAS in mouse melano-ma development (61), it is possible and melano-may be likely that loss of
Fes may also accelerate melanomagenesis on the NRAS-mutant
background; this remains to be tested experimentally. We also show herein that ectopic FES expression severely compromised the in vitro and in vivo growth of MeWo cells, which express WT β-catenin. In contrast, FES-induced growth inhibition was far less dramatic in 501 Mel cells, which carry a β-catenin-stabilizing mutation (59). Taken together, these data indicate that FES exerts its tumor-suppression function, at least partly, as an inhibitor of canonical WNT–β-catenin signaling. Although the molecular mechanism underlying FES-dependent inhibition of WNT sig-naling remains to be fully elucidated, our data indicate that FES modulates β-catenin cellular localization, rather than its stability, in a manner that depends on its kinase activity. Additional work is needed to determine whether FES affects β-catenin nuclear trans-location indirectly or directly, by phosphorylating β-catenin itself. Recurrent focal and broad amplifications in the mouse mela-noma genomes were not as common as recurrent deletions. Broad amplifications of chromosome 6 were nevertheless significantly (q ≤ 0.25) recurrent in both BRAFV600E- and NRASQ61K-driven
mel-anomas. In addition, 3 distinct recurrent focal amplifications, all located on chromosome 6, were also observed in NRASQ61K-driven
melanomas. Notably, one of them contained the Braf gene, which indicates that increased Braf expression may promote a growth advantage to NRASQ61K-driven melanoma lesions. Interestingly,
one of these recurrent amplifications contained Smo, a key signal transducer of Hh signaling. This observation raises the possibility that increased Hh signaling may contribute to melanomagenesis. Consistent with this possibility, several components of Hh signal-ing pathway, includsignal-ing the well-established negative regulators
Sufu and Kctd11, are among the 30 melanoma TSGs we identified.
To date, only few studies have tentatively implicated Hh signaling in melanoma (62–64). Our work therefore warrants further dissec-tion of the role of Hh signaling in melanomagenesis and leads us to entertain the possibility that Hh inhibitors should be considered in the context of (combination) melanoma targeted therapies.
This work provides a rich resource of candidate genes involved in melanoma progression in addition to a list of pathways and bio-logical processes with potential clinical importance in the treat-ment of human melanoma.
Methods
Transgenic mice. The Tyr-CreERT2/°, BrafCA/+, BrafLSL–V600E/+, Ink4a–/–,
Ptenfl/fl, Tyr-NrasQ61K/°, Trp53–/–, Trp53fl/fl, Cdkn2a–/–, R26RLSL–eYFP/+, and
Fes–/– mouse lines and strategies used for genotyping these mice were
described previously (13, 21, 22, 42, 65–71). The various cohorts of compound mice were on mixed genetic backgrounds consisting of more than 85% C57BL/6J and, to a lesser extent, 129SvJ and FVB. The full list of samples collected from the compound mice and their genet-ic background can be found in Supplemental Table 1.
Lkb1), and several other genes previously linked to melanoma
(i.e., Apc), were present in this list. Importantly, about 20 genes that have not been causally linked to melanoma were also iden-tified, half of which have potential value in predicting human patient survival outcomes. This analysis therefore provides a rich resource of clinically relevant melanoma genes and a framework for further genomic validation of these genes as bona fide melano-ma TSGs. In the context of the present study, we chose to validate one of these genes, Fes, by compound deletion in the autochtho-nous BRAFV600E-driven mouse melanoma model. Importantly, we
provide genetic evidence that inactivation of Fes promotes mel-anoma progression and decreases survival of animals bearing BRAFV600E-expressing melanoma lesions. Together, these data
illustrate the potential of this comparative and integrative genom-ic effort to identify acquired drivers of progression and dissect stepwise tumorigenesis.
FES was first described as the product of a viral oncogene (47) and has been implicated in growth and survival signaling in leukemia cell lines driven by oncogenic KIT and FLT3 receptors (48, 49). Despite these initial observations, there is to date no clear evidence that FES functions as an oncoprotein in human cancer. In contrast, large-scale sequencing of the tyrosine kinome in colorectal tumors identified FES as one of a few mutated genes (50). Although not conclusive, the loss-of-function nature of these mutations and in vitro assays using colorectal cancer cell lines raised the possibility that FES may instead function as a potential tumor suppressor (41, 51). Herein we provide clear evidence that
FES functions as a TSG in both human and mouse melanoma.
Consistent with this finding, an old study reported low levels of
FES in a few human melanoma cell lines (52).
Protein kinases are often upregulated in cancer and are attrac-tive therapeutic targets. However, protein kinases exert pleiotro-pic functions, such as increased survival, progression of the cell cycle, differentiation, adherence, or migration, that are dependent on the tissue and molecular environment of the cells. Ultimate-ly, this implies a context-dependent functional role of specific kinases in cancer, i.e., oncogene or TSG function (53). Our data provide an additional example of a tyrosine kinase that acts as a tumor suppressor. Importantly, kinase inhibitors are now wide-ly used in the clinic, including for the treatment of melanoma. Despite assertions on selectivity, most available inhibitors target multiple protein kinases in addition to the intended target (54). Considering the increasing list of kinases with putative TSG func-tion, a comprehensive characterization of protein kinase function and kinase inhibitor selectivity profiling is essential for the proper management of these drugs in the clinic. Of note, FES is inhibited by ALK inhibitors (55) and several FDA-approved drugs such as the CDK1/2 inhibitor III, sunitinib, or bosutinib (56).
Whereas nuclear β-catenin, which reflects canonical Wnt pathway activation, is present in about 30% of human melanoma specimens (57), β-catenin-stabilizing mutations are only found in about 5% of the cases (43, 58, 59). The molecular mechanisms underlying such a frequent dysregulation of β-catenin localization and activation of function remain unclear (60). Interestingly, our data raise the possibility that epigenetic downregulation of FES transcription is one key mechanism that contributes to Wnt sig-naling activation in β-catenin WT melanomas. Our transcriptomic
renewed every 3 days. After 6 or 9 days, cells were collected for RT-PCR and Western blot analysis.
For FES reexpression experiments, control or Fes cDNA LXSN retroviral vectors were transfected in Phoenix A cells using Lipofect-amine 2000 (Thermo Scientific). Culture supernatants containing the retroviruses were used to infect melanoma cells in the presence of polybrene (Sigma-Aldrich) at 8 μg/ml overnight. After 2 rounds of infection, cells were selected using Geneticin (Thermo Scientific) at 1 mg/ml. For the clonogenic assay, 501 Mel or MeWo cells were seeded at low density in 60-mm culture plates in 3 ml media and grown for 8 to 10 days. Colonies were then fixed in 4% paraformaldehyde (Ther-mo Scientific), stained with 0.05% crystal violet, and counted. For the soft agar assay, cells were seeded in 12-well culture plates in 1 ml of supplemented DMEM containing 0.3% agar (Thermo Scientific). After 14 days, cells were stained with 0.002% crystal violet (Sigma- Aldrich) and colonies were scored using ImageJ software.
For the doxycycline-inducible expression of WT and kinase-dead mutant FES, MeWo cells were transduced with the lentivirus carrying the vector for TetR (FUGW plasmid with GFP replaced by TetR-T2A-NeomycinR) and selected with Geneticin (InvivoGen) at 1 mg/ml. Selected cells were transduced with lentivirus carrying a
doxy-cycline-inducible conditional vector for FESWT or FESK590E and selected
with puromycin (Sigma-Aldrich). The conditional vectors were made by
Gateway-recombining pENTRY-FESWT/K590E vectors (41) with a
pLEN-TI CMV/TO Puro DEST (Addgene, vector #17293). For the clonogenic assay, cells were plated onto 6-well plates at a density of 5,000 cells and incubated with doxycycline to induce the expression of FES. After 10 to 11 days, colonies were fixed and stained in a solution of 1% crystal violet in 35% methanol for 15 minutes and scored using ImageJ software.
MeWo cells injections. MeWo cells (1 million) were injected in 150
μl of 0.9% NaCl subcutaneously into nude mice (Janvier). Control and FES MeWo transfected cells were injected in the opposite flanks of mice. Tumor growth was monitored twice a week until week 24.
Bisulfite sequencing. Genomic DNA was extracted using the
QIAamp DNA Mini Kit (QIAGEN). For bisulfite conversion, we used the EZ DNA Methylation Gold Kit (Proteigene) according to the man-ufacturer’s instructions. Then a first PCR amplification was done (F-GTTGGGTTATTTTTTTTCGGTT and R-TAAATAAATCTCTA-ACCCTC), followed by a nested PCR (F-GGAGTAGGGGGGTTGG-TAGG and R-CCTACTCTACCCCTACCTACC). PCR products were sequenced using the BigDye Terminator v1.1 Cycle Sequencing Kit (Thermo Scientific) on an Applied Biosystems 3130 DNA Analyzer.
Lysates and Western blotting. Cultured cells were lysed at 4°C in
HNTG buffer (50 mM Hepes, pH 7.0, 150 mM NaCl, 1% Triton X-100,
10% glycerol, 1 mM EGTA, 1.5 mM MgCl2) supplemented with
pro-tease inhibitor cocktail (Roche) and orthovanadate (Sigma-Aldrich). Protein concentrations were assessed using the Bradford protein assay (Bio-Rad). Following SDS-PAGE, lysates were transferred on PVDF membranes (Millipore). Immunoblotting was performed using rabbit polyclonal anti-ERK2 (Santa Cruz Biotechnology Inc.), mouse mono-clonal anti–β-actin (Sigma-Aldrich), and rat monomono-clonal anti-Fes (Cal-biochem) antibodies and SuperSignal West Pico Chemiluminescent Substrate (Thermo Scientific).
Tissue samples were additionally homogenized with Precellys Homogenizer (Bertin Technologies) in protein lysis buffer (25 mM
HEPES, pH 7.5, 0.3 M NaCl, 1.5 mM MgCl2, 2 mM EDTA, 2 mM EGTA,
1 mM DTT, 1% Triton X-100, 10% glycerol, phosphatase/protease
Activation of the Tyr-CreERT2 locus. Topical administration of
4-hydroxytamoxifen (4-HT) was conducted by preparing a 50 mg/ml solution (130 mM) of 4-HT (70% Z-isomer, Sigma-Aldrich) in DMSO. For localized melanoma induction on the back, 3- to 4-week-old mice
were anesthetized and depilated on a 2-cm2 patch of skin on the back
with a combination of gum rosin and beeswax (Sigma-Aldrich). After the area was dried and cleaned, 1 μl of 5 mM 4-HT in ethanol vehi-cle was applied using a pipette. For distal tail inductions, 4 μl of 130 mM 4-HT was applied on the middle part of the tail (4 cm long) and wrapped by surgery tape to prevent the spread of 4-HT. The mice were evaluated weekly for tumor appearance and progression and mea-sured with a caliper. The volume was calculated using the following formula: V = (length × width × height)/2. Mice were killed as soon
as the tumors reached 15 mm3 or sooner if they were suffering from
tumor burden. Tumors and organs were snap-frozen in liquid nitrogen for further analysis or fixed in 4% paraformaldehyde, processed, and embedded in paraffin for histological studies.
Histology and IHC. Tissues were fixed overnight in 4%
parafor-maldehyde, dehydrated, paraffin embedded, sectioned (5 μm), and stained with H&E. For IHC, slides were stained with antibodies against S100 (Z0311; 1:300; Dako) and Ki67 (RM-9106-S; 1:200; Thermo-Scientific) and β-catenin (#9582; 1:1000; Cell Signaling Technology). Stainings were realized in the Ventana automated stainer from Roche using EnVision+ HRP reagent and DAB (DAB Peroxidase Substrate Kit, SK-4100; Vector Laboratories) for revelation. To assess prolifera-tive index, Ki67-posiprolifera-tive and -negaprolifera-tive nuclei were counted in at least 3 microscopic fields randomly selected from different regions of each tumor section by applying a digital image analysis algorithm created on the ImageJ software platform (NIH). Proliferative index was then expressed as the ratio between positive and total numbers of nuclei. The percentages of β-catenin–positive nuclei were counted using ImageJ within 30 different fields from 8 different tumors per group.
IHC for FES was performed on formalin-fixed, paraffin-embedded material of benign nevi, primary and metastatic human melanomas, and TMA cohorts on the Leica BOND-MAX automatic immunostainer (Leica Microsystems) using primary antibody HPA001376 (1/100 dilu-tion; Sigma-Aldrich). Antigen retrieval was performed onboard using a citrate-based buffer (Bond Epitope Retrieval Solution 1, pH 6.0; Lei-ca) according to the manufacturer’s instructions. Alkaline phosphatase activity was detected with Bond Polymer Refine Red Detection (Leica) as substrate, resulting in pink/red immunoreactivity. TMAs stained for FES were scored semiquantitatively by two researchers (FES negative, cores with melanoma cells showing low-intensity to undetectable cyto-plasmic immunoreactivity; FES positive, cores with melanoma cells showing high- to medium-intensity cytoplasmic immunoreactivity; see Figure 4A for representative cores). Melanoma-specific survival was defined as the interval from diagnosis of the primary tumor to death from melanoma or date of last follow-up.
Cell culture. Melanoma cell lines (ATCC; ref. 72, 73) and
Phoe-nix A cells (ATCC) were maintained in DMEM (Thermo Scientific) supplemented with 10% fetal bovine serum (Eurobio) and 2 mM glutamine (Thermo Scientific). Short-term melanoma cultures were maintained in Ham’s F10 Nutrient Mix (Thermo Scientific) supple-mented with 10% FBS and 4 mM glutamine. Cells were cultured in a
37 °C and 5% CO2 incubator.
For the decitabine experiment, a final concentration of 0.5 μM decitabine (Sigma-Aldrich) was added to the cells and media were
24). DNA samples from NrasQ61K Cdkn2a–/– melanomas (n = 5) were
obtained from cells after tumor dissociation followed by initial expan-sion in nude mice and were provided by Lukas Sommer (University of Zurich, Zurich, Switzerland). Whole-genome DNA libraries were pre-pared using the KAPA HTP Library Preparation Kit (Kapa Biosystems) and either used for low- coverage whole-genome sequencing directly or further prepared for use in exome sequencing.
Exome sequencing, variant calling, validation, and scoring. In order
to perform exome capture, the amplified DNA libraries were hybrid-ized to a complete set of biotinylated long oligonucleotide probes using the SeqCap EZ Library Kit (Roche NimbleGen) for approxi-mately 65 hours. After this, the exome-enriched libraries were washed and recovered using capture beads. The libraries were sequenced on a HiSeq2000 (Illumina) sequencing platform. An existing, in-house– developed pipeline for the analysis and annotation of somatic muta-tions in these samples was used (described below). Raw reads were mapped to the mouse reference genome (GRCm38/mm10) using the Burrows-Wheeler Aligner (v0.5.8a; ref. 75). Duplicate reads were marked using Picard (v1.43). We obtained an average coverage of 62× with on average 94% of the exome covered at least 10×. The Genome Analysis Toolkit (GATK; v2.1-13; Broad Institute; ref. 76) was used to recalibrate base qualities and local realignment around indels. Vari-ant calling was performed using GATK’s Unified Genotyper (GATK, v2.1-13). Small insertions and deletions of less than 50 bp were identi-fied using Dindel (v1.01; ref. 77). Variants were functionally annotated using ANNOVAR (v2013Jun21; ref. 78). Somatic variant identification was performed by comparing tumor genomes with variants present either in the matching or combined normal samples. SNPs and indels reported by the Mouse Genome Project of the Sanger Institute were removed as well, according to the mixed genetic background of our mice. Mutations that were represented with more than 5% alterna-tive reads in the control samples or mutations represented with less than 10% alternative reads in tumor samples were discarded. Result-ing variants were manually inspected usResult-ing the Integrative Genomics Viewer (IGV; v2.3.67; Broad Institute) in order to omit the variants in regions with low mapping quality and variants present but not called in the germline samples. Selected mutations were validated using Sequenom MassARRAY (Sequenom Inc.) genotyping according to the manufacturer’s instructions. Primers were designed with MassARRAY Assay Design software v3.1. Automated genotyping calls were generat-ed with MassARRAY RTTM software v4.0 and were validatgenerat-ed by man-ual review of the raw mass spectra. Raw data were deposited in the ArrayExpress database (www.ebi.ac.uk/arrayexpress; E-MTAB-4917).
CNA analysis. For the analysis of CNAs, we performed low-
coverage whole-genome sequencing of all 70 mouse melanomas on the HiSeq2500 (Illumina) sequencing platform. The sequenc-ing reads were mapped to the reference genome (GRCm38/mm10) using the Burrows-Wheeler Aligner (v0.5.8a). The duplicate reads were removed using Picard (v1.43). After this, the mapped reads were binned in 30-kb windows and corrected for genomic waves using the PennCNV software package (79). The read counts per bin were transformed into logR values, and the data were segmented using ASCAT (80). logR values above 0.1 or below –0.1 were con-sidered as amplified or deleted, respectively. The recurrent CNAs were identified using the GISTIC 2.0 tool (81). The control samples (n = 9) were used to filter out nonsomatic aberrations. Raw data were deposited in the ArrayExpress database (E-MTAB-4921). inhibitor cocktail); the extracts were incubated on ice for 15 minutes
and centrifuged for 15 minutes in 4°C at 20,000 g. Protein concentra-tion was measured by Bradford quantificaconcentra-tion and run on 4% to 12% NuPAGE Novex Bis-Tris Gels (Thermo Fisher Scientific). Membrane blocking (5% milk in TBS, 0.2%Tween-20) was followed by incuba-tion with the appropriate primary antibodies and HRP-conjugated sec-ondary antibody (Cell Signaling Technology). Proteins were detected by ECL and Western blotting (Thermo Scientific). Antibodies used are listed in Supplemental Table 9.
RT-qPCR. To extract RNA, samples were lysed in QIAzol
(QIA-GEN). Tumor samples were additionally homogenized with a Pre-cellys Homogenizer (Bertin Technologies). RNA extraction was per-formed with the mRNeasy Mini Kit according to the manufacturer’s instructions (QIAGEN). RNA was quantified using a NanoDrop 1000 (Thermo Scientific), and 2,000 ng was reverse transcribed with the High-Capacity cDNA Reverse Transcription Kit (Life Technologies). The results shown in Figure 3B were obtained by RT-qPCR reaction on an Applied Biosystems 7500 Fast Real-Time PCR System using SYBR Green PCR Master Mix (Thermo Scientific). Threshold cycle (Ct) val-ues for Fes were normalized to housekeeping gene using the 2ΔCt for-mula. The results shown in Supplemental Figure 4A and Supplemental Figure 10, C and E, were obtained by RT-qPCR reaction on a Roche LightCycler 384 (Life Technologies) using Fast SYBR Green Master Mix (Life Technologies). Data were processed with qbase+ 2.6 soft-ware (Biogazelle) using a normalization method with a minimum of 2 reference genes. RT-qPCR primers are listed in Supplemental Table 10; the reference genes are indicated in the table as RefGen.
Epidermal whole mount. The epidermal whole mount was
per-formed using an adaptation of a previously described protocol (74). Murine tail skin was dissected and spread out on Whatman cellulose filter paper. Pieces of murine tail skin were cut and incubated in 20 mM EDTA in PBS at 37°C for 40 minutes in the dark and subsequently washed twice with PBS. The epidermis was mechanically separated from the dermis as an intact sheet and was fixed in 4% paraformal-dehyde for 30 minutes at room temperature in the dark. Pieces of epi-dermis were rinsed twice with PBS and stored at 4°C or immediately processed for antibody staining. For the staining, pieces of epidermis were incubated in blocking buffer (1% BSA, 10% donkey serum, 0.2% Tween in PBS) for 3 hours at room temperature on a rocking plate (120 rpm) in the dark. Blocked samples were incubated in primary antibod-ies diluted in antibody diluent (1% BSA, 0.2% Tween in PBS) overnight at 4°C in the dark. The primary antibodies used were anti-melanoma gp100 (rabbit, 1:400, Abcam, ab137078). Samples were then washed 3 times in PBS with 0.2% Tween for 1 hour and incubated in appropriate secondary antibodies diluted 1:1000 in antibody diluent for 2 hours at room temperature on a rocking plate in the dark. Nuclei were stained with DAPI solution (0.5 mg/ml) diluted 1:1,000 in PBS for 20 minutes and mounted in VECTASHIELD Antifade Mounting Medium for flu-orescence (VECTOR).
Tissue collection, DNA extraction, and library preparation. In total,
70 mouse melanomas were collected for this study. The RNA/DNA from these lesions was extracted using the AllPrep RNA/DNA Kit (QIAGEN) or the DNeasy Blood & Tissue Kit (QIAGEN) following the
manufacturer’s instructions. The DNA samples from Trp53LSL–R172H/+
BrafLSL–V600E/+ Tyr-CreERT2/° tumors (n = 10) and BrafLSL–V600E/+
Tyr-CreERT2/° tumors (n = 3) were provided by Richard Marais (Cancer