Publisher’s version / Version de l'éditeur:
Vous avez des questions? Nous pouvons vous aider. Pour communiquer directement avec un auteur, consultez la première page de la revue dans laquelle son article a été publié afin de trouver ses coordonnées. Si vous n’arrivez pas à les repérer, communiquez avec nous à [email protected].
Questions? Contact the NRC Publications Archive team at
[email protected]. If you wish to email the authors directly, please see the first page of the publication for their contact information.
https://publications-cnrc.canada.ca/fra/droits
L’accès à ce site Web et l’utilisation de son contenu sont assujettis aux conditions présentées dans le site LISEZ CES CONDITIONS ATTENTIVEMENT AVANT D’UTILISER CE SITE WEB.
Journal of the Acoustical Society of America, 80, 3, pp. 837-845, 1986-09
READ THESE TERMS AND CONDITIONS CAREFULLY BEFORE USING THIS WEBSITE. https://nrc-publications.canada.ca/eng/copyright
NRC Publications Archive Record / Notice des Archives des publications du CNRC : https://nrc-publications.canada.ca/eng/view/object/?id=f868a778-6168-4897-b5b5-170eedf288d0 https://publications-cnrc.canada.ca/fra/voir/objet/?id=f868a778-6168-4897-b5b5-170eedf288d0
NRC Publications Archive
Archives des publications du CNRC
This publication could be one of several versions: author’s original, accepted manuscript or the publisher’s version. / La version de cette publication peut être l’une des suivantes : la version prépublication de l’auteur, la version acceptée du manuscrit ou la version de l’éditeur.
Access and use of this website and the material on it are subject to the Terms and Conditions set forth at
Predictors of speech intelligibility in rooms
Scr
TH1
N21d
no. 1414
National Research
Condl national
c . 2 1
I+
council camcia
tie
d e * e s
a n *
Institute for
lnstitut de
Research in
recherche en
Construction
construction
Predictors of Speech
Intelligibility
in Rooms
by J.S.
Bradley
Reprinted from
Journal of the Acoustical Society of America
Vol.
80,
No.
3,
September
1986
p.
837
-
845
(IRC Paper No.
1414)
NRC
-
CISTIL I B R A R Y
Price
$2.00
NRCC
26493
CNRC-
K S I S T,
,
c
On a compare t r o i s types de mesures a c o u s t i q u e s s e r v a n t
a
p r 8 v o i r 1 1 i n t e l l i g i b i l i t 8 de l a p a r o l e dans d e s locaux de dimensions e t de c o n d i t i o n s acoustiques v a r i h s . Ces mesures p o r t a i e n t s u r l e r a p p o r t s i g n a l - b r u i t , s u r l l i n d i c e de transmission du son t i r e d e s f o n c t i o n s de t r a n s f e r t de modulation, e t s u r l e s r a p p o r t s son u t i l e - s o n n u i s i b l e obtenus 3 p a r t i c dcs r a p p o r t s son initial-son s u b s h u e n t e t des ntveaux d e p a r o l e e t de b r u i t de fond. Pour chaque type de mesure, l e s forrues l e s p l u s u t i l e s o n t permis d l o b t e n i r des prEvisions d epr'ecislon comparable, m i s c ' e e t l a mesure des r a p p o r t s son u t i l e - s o n n u i s i b l e b a s h sur un i n t e r v a l l e de tenpa initial d e
0,08 seconde qul a don& l a p l u e grand@ p r l i s i o n . I1 e x i s t a i t des r a p p o r t s B t r o i t s e n t r e p l u s i e u r s mesures physiques, p o u r t a n t bas6es s u r d e s d t h o d e s de d a l c u l t r 8 s d i f b r e n t e s .
vreaictors
or speecn inrel~igibility
in rooms
J. !
Ins
3. Bradley
titute for Research in Construction. National Research Council of Canada. Ottawa. Lunuuu n l A OR6.
eceived 2 985; accepted for publication 29 April 1986)
ree different types of acoustical measures were compared as predictors or speech intelligibility in rooms of varied size and acoustical conditions. These included signal-to-noise measures, the speech transmission index derived from modulation transfer functions, and useful/detrimental sound ratios obtained from early/late sound ratios, speech, and background levels. The most successful forms of each type of measure were of similar prediction accuracy, but the useful/ detrimental ratios based on a 0.08-s early time interval were most accurate. Several physical measures, although based on very different calculation procedures, were quite strongly related to each other.
PACS numbers: 43.55.Hy, 43.71.G~
Many rooms exist for the sole purpose of speech com- munication from one speaker to a group of listeners. Such rooms include a variety of sizes from small meeting rooms and classrooms to larger auditoria and theatres. The acousti- cal design of such rooms should be based on achieving the highest possible degree of speech intelligibility for all listen- ers in the room. A number of types of acoustical measures are intended to relate to the actual degree of speech intelligi- bility in a room, but no comprehensive comparison of these different methods has been made based on the range of con- ditions to be expected in rooms intended for speech. The present work compares the accuracy of various predictors of speech intelligibility from an extensive set of measurements of both physical quantities and speech intelligibility scores in a wide range of real rooms, so that the most accurate method for assessing the acoustical quality of rooms for speech can be determined.
Three types of acoustical measures were considered. The simplest type of measure is based on steady state signal- to-noise concepts. The articulation index (AI) is a well- known measure of this type.' In this study the overall steady-
state A-weighted signal-to-noise ratio [S/N(A) ] was also
considered. Recently, a newer type of measure, the speech transmission index (STI) has been proposed, based on mo- dulation transfer functions and including the effects of inter-
fering background The third type of measure is
based on the work of Lochner and B ~ r g e r . ~ Although their work is now 20 or more years old, only one previous study5 attempted to thoroughly evaluate their useful/detrimental sound ratios in a number of real rooms. In this work both the original Lochner and Burger useful/detrimental ratios and simplified forms of them that incorporated unweighted early energy sums were calculated. As the early/late-arriving sound-energy ratio for a 0.08-s early sound limit (C,,) has gained considerable acceptance as a correlate of subjective judgments of musical ~ l a r i t y , ~ it was considered likely that the same quantity, or a useful/detrimental ratio derived from it (U,,) would be a successful predictor of speech intel- ligibility scores.
I. PROCEDURE A. The rooms
Acoustical measurements and speech intelligibility tests were performed in five rooms with volumes from 362- 20 000 m3 and l-kHz RT values from 0.8-3.8 s. A wide range of acoustical measures was obtained from pulse re- cordings at 40 source-receiver combinations in the rooms, with 6-14 source-receiver positions in each room.
B. Speech tests
Speech intelligibility scores were obtained using a Fair- banks rhyme test. The procedures and the word lists were very similar to those used by Latham,5 as initially this pro- ject was intended to replicate and expand the work of Latham. The five word lists of 50 words each were tape- recorded in an anechoic room using a male speaker and re- produced using a PSB Alpha-I1 loudspeaker containing a 9- cm and a 2.5-cm driver in a small box and having directional properties similar to a human speaker. For each of the 40 source-receiver combinations, tests were carried out for four different speech levels. The speech levels varied according to the background noise levels in each room. The tape record- ings were calibrated by octave band and overall A-weighted level integrations over each full recording and were present- ed at a rate of 3.0 syllables per second. The test words were
embedded in the carrier phrase, "Word n u m b e r i s -
.
Write that down please." For each receiver position, a group of nine subjects were seated as close as possible to the actual receiver location, and the scores of the nine subjects were averaged to obtain one score representative of that receiver location. With nine subjects at each of the 40 source-receiver combinations repeated at four speech levels, a total of 1440 individual speech-intelligibility tests were performed.
C. Subjects
Subjects received only a few minutes of instruction prior to the test and no hearing tests were performed. However, subjects who reported a known hearing impairment were not used. Subjects were thus not carefully selected listeners, but
were more representative of general listening audiences without obvious hearing-handicapped subjects. Different groups of subjects were used to test each room, with as many as 45 subjects used in one room. Subjects varied in age from approximately 16-year-old high school students to working age adults. No younger children or retirement age adults were included.
D. Acoustical measurements
For each source-receiver combination, pulses were re-\ corded using pistol shots. From these recorded pulses, the earlyAate-arriving sound ratios, early decay times (EDT), and the conventional RT were calculated in octave bands from 125-8000 Hz. The calculation of the measures from pulses and the interrelation of the basic physical measures were considered in a previous paper.'
Background noise level recordings, as well as the pulse measurements, were made at each receiver location. The 1- min integrations of the octave band and overall A-weighted background noise were made from these recordings. By cali- bration of the reproduction system and the recorded test tapes, the speech levels were determined in terms of the inte- grated level of the complete test tape, at a distance of 1.0 m, in an anechoic environment. From the measured source- receiver distances, RT values, and loudspeaker directivity factors, the long-time average speech levels were calculated in octave bands at each receiver position using
S P L = S W L + 10log(Q/4?r? +4/A) +0.1, dB, (1) where SWL is the sound power level of the source, Q is the directivity factor of the loudspeaker source and is a function of frequency and angle, r is the source-receiver distance in meters, and A is the total absorption in the room in square meters. The absorption was calculated from the measured RT values, using the Sabine reverberation equation. Measur- ing the long-time average speech levels would have permit- ted increased accuracy in the speech levels at each receiver, but the procedure used better indicates the uncertainty that would be expected in future attempts to predict speech intel- ligibility scores from the results of the present studies. That is, in such future situations, speech levels would probably not be measured at each receiver. One would want to predict speech intelligibility scores from known or estimated source levels and the properties of the room.
E. Calculation of predictors
Three types of acoustical measure were considered as predictors of speech intelligibility scores: Steady-state sig- nal-to-noise measures; measures derived from earlyAate-ar- riving sound ratios, speech, and background noise levels; and ST1 values derived from modulation transfer functions, speech, and background noise levels. The articulation index (AI) is the best known of the first type and standardized procedures for its calculation are available.' First, 12 dB is added to the long-time average signal-to-noise ratios in each standard octave band from 125-8 kHz. Each signal-to-noise ratio is multiplied by a weighting factor and the weighted ratios are then summed to produce an A1 value between 0 and 1.0. The
+
12 dB is intended to represent the differencebetween the long-time average speech levels and the pe levels. In this study a simple overall A-weighted signal- noise ratio [ S/N ( A )
1
was calculated for each speech leve each receiver.The ST1 values were calculated from pulses as described in an earlier paper,7 ignoring the effects of background noise levels. The octave band weightings suggested by Steeneken and Houtgast3 were used, and the effect of the steady state signal-to-noise ratios was combined with the modulation transfer functions as follows:
m, ( a ) = m(w)
.
(1+
10' -SN'lO'I
- I , (to- l at
where m(w) is the modulation transfer function with interfering noise and m, (w ) is the corresponding value WLLU
noise. The SN is the long-time average steady-state signal- noise ratio in decibels. The ST1 values were calculated bc with and without noise, following the steps outlined Houtgast eta/.'
Lochner and Burger4 introduced the concept of the ra- tio of useful/detrimental sound energy that was intended to relate to speech intelligibility scores. The useful energy wa weighted sum of the energy arriving in the first 0.095 s af the arrival of the direct sound. The detrimental energy v the later-arriving energy from the speech source, plus 1
background noise energy in the room. Such a measure essentially an earlyAate sound ratio, with the backgrou sound energy added to the late-arriving sound. Various 0.-- er forms of this measure could be calculated from earlyAate sound ratios. Such measures would be less complicated to calculate than those using the weighting procedure proposed by Lochner and Burger, which is quite complicated and re- quires the identification of individual reflections in the pulse response. The Lochner and Burger form of earlyAate ratio is referred to as C,, and is given by the following equation:
to- ,th by 1s a ter vas LL
where a is the fraction of the energy of an individual reflec- tion that is integrated into the useful early energy sum. In the present work the early sound energy in each block of 12 points of the pulse response (sampled at 22627 Hz), was summed to create intermediate energy sums. Each of these sums was then treated as an individual reflection. By Lochner and Burger's technique, the weighting of each indi- vidual refelection is determined by its relative amplitude (RA) (relative to the direct sound) and by its arrival time
( T ) after the direct sound (as seen in Fig. 10 in Ref. 4). The curves of this figure were approximated in the present work using the following relationships for a , the fraction of the energy integrated into the useful early energy:
a = A + B . T , (4)
where A = 2.30 - 0.600
.
RA0.7 and B = - 0.0248+
0.00177-
RA1.35. The variable T is the time of arrival after the direct sound in milliseconds, and a values are limit- ed so that they fall between 0 and 1.0. The relative total early useful energy was then obtained by adding up the block ener- gy sums weighted by the appropriate a values.The calculated relative early useful energy and late ener-
ly dividin Lon, an ex] 3r an earl
gy sums m to find the fraction of the t ch
energies that were useful or detrimental. If SL anu DL are he
steady-state long-term rms speech and background levels,
ESL and EBL are the related total speech and background
energies:
Es, cc 10(SL/lo.o)
E~~ oc lo(BL/lO.O)
The useful early energy is then
Useful = [Ee/(Ee
+
E, ) ].
EsL= [Cte/(Cte
+
I ) ] .EsL, (5)where Ee and El are the relative early and late energy sums
from the uncalibrated pulse recordings. The variable Cte is 'he linear earlyAate ratio with an early time limit (te). Simi-
trly, the detrimental energy is given by
Detrimental = [ l/(Cte
+
1 ) ]-
EsL+
EBL.
(6)g Eq. (5) by Eq. (6), and after some simplifica- pression for a useful/detrimental ratio is obtained y souhd limit (te);
u e
= C t e / [ l+
(Cte+
1 ) .EBL/EsL]. (7) Thus useful/detrimental sound ratios can be calculated from the corresponding early/late ratio (C,,) and the ratio of background noise to speech energies.EarlyAate ratios were calculated for 0.035-, 0.050-, 0.080-, and 0.095s early sound limits and are referred to as C,,, C,,, Cs0, and C,,. Of course, C,, is different from the others in that the early energy sum involves the weighting of the individual reflections described above. From these ear- lyAate ratios, useful/detrimental sound ratios were then cal- culated for the corresponding early time limits and are re- ferred to as U,,, U,,, Us,, and U,,. All measures were calculated in the seven octave bands from 125-8 kHz.
II. RESULTS
A. Signal-to-noise measures
Figure 1 plots the results of 160 mean speech intelligibil- ity test scores versus A1 values. The line shown on the figure is the result of fitting a third-order polynomial to the data,
0 0 . 2 0 . 4 0. 6 0 . 8 1 . 0 A R T I C U L A T I O N I N D E X
FIG. 1. Measured speech intelligibility scores versus A1 values and best-fit
third-order polynomial.
839 J. Acoust. Soc. Am., Vol. 80, No. 3, September 1986
- 1 5 - 1 0 - 5 0 5 I
S I N ( A ) , d B A
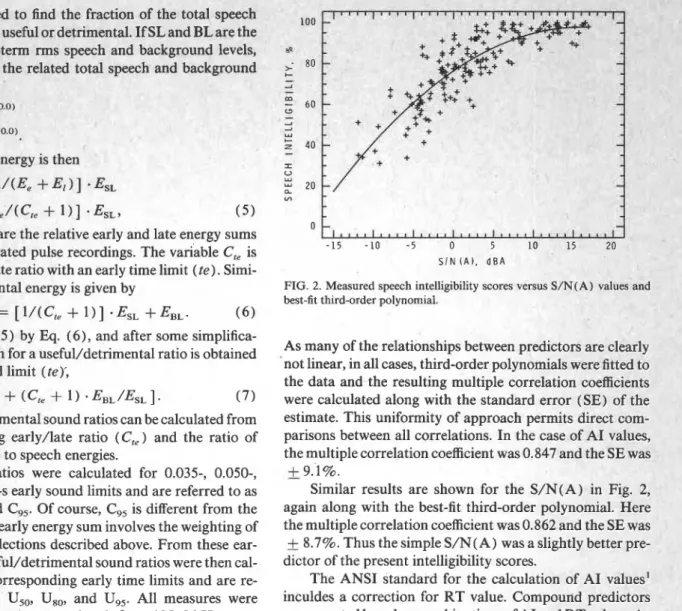
FIG. 2. Measured speech intelligibility scores versus S/N(A) values and best-fit third-order polynomial.
As many of the relationships between predictors are clearly not linear, in all cases, third-order polynomials were fitted to the data and the resulting multiple correlation coefficients were calculated along with the standard error (SE) of the estimate. This uniformity of approach permits direct com- parisons between all correlations. In the case of A1 values, the multiple correlation coefficient was 0.847 and the SE was
+
9.1%.Similar results are shown for the S/N(A) in Fig. 2, again along with the best-fit third-order polynomial. Here the multiple correlation coefficient was 0.862 and the SE was
+
8.7%. Thus the simple S / N ( A ) was a slightly better pre--
dictor of the present intelligibility scores.
The ANSI standard for the calculation of A1 values1 inculdes a correction for RT value. Compound predictors were created based on combinations of A1 and RT values. As EDT relates more closely to subjectively perceived decay time, attempts were made to create compound measures that included it too. Table I summarizes the results for combina- tions of third-order polynomials of both A1 and S/N(A), combined with RT and EDT values. All four results pro- duced similar multiple correlation coefficients, and SE val-
ues. The SE values ranged from f 7.2-7.5%, and wen
slightly smaller for combinations with S / N ( A ) .
B. Modulation transfer function measures
ST1 values were calculated both with and without the influence of background noise levels. Without background noise levels the multiple correlation coefficient was 0.525
and the SE was f 14.6%. Figure 3 shows measured speech
intelligibility scores versus ST1 values that included the ef- fects of background noise levels. The best fit third-order polynomial is also shown; the multiple correlation coeffi-
cient was 0.866 and the SE f 8.6%. Thus, for the present
data, the ST1 is of similar prediction accuracy to the A- weighted signal-to-noise ratio. Steeneken and Houtgast3 re- ported a standard deviation about their best-fit relationship
of & 5.6% for PB-word scores versus ST1 values. Their data
comprised 167 points, some of which included reverbera- tion.
TABLE I. Multiple regression results, compoulru prelucrors of speech intelligibil Independent
variables
ity.
Regres sion coeffici ents
X 1 X 2 X 1 XI2 x i 3 X2 Constant
A1 RT(1 kHz) 273.5 - 316.0 134.3 - 5.744 18.40 1 7.5
A1 EDT( 1 kHz) 273.3 - 319.5 137.8 - 5.326 17.60 - 3 7.5
S / N ( A ) RT( 1 kHz) 2.638 - 0.1222 0.0012g2
-
5.702 88.82 I) ?S / N ( A ) EDT(1 kHz) 3.603 - 0.1205 0.001330 , - 5.267 89.51 1
C. Early/late ratio measures, complete data
EarlyAate ratios, decay times, and useful/detrimental ratios were all considered as predictors of speech intelligibil- ity scores. In all cases, third-order polynomials were fitted to the data relating speech intelligibility scores and the octave band predictors. Table I I ( a ) gives the resulting multiple correlation coefficients and Table I I ( b ) gives the corre- sponding SE values. All useful/detrimental ratios correlated much more strongly with speech intelligibility scores than either the earlyAate ratios or the decay times. In tests such as those in the present study, where the steady-state signal-to- noise ratio was deliberately manipulated as part of the exper- iment, early/late ratios and decay times are inadequate pre- dictors, as they only indicate one aspect of the problem. One must assume that much of the scatter is due to large differ- ences in signal-to-noise ratio between data points. The use- ful/detrimental ratios were much better predictors of speech intelligibility scores, with the highest correlations in the 2-, 4-, and 8-kHz octave bands. The particular early time limit did not seem to have a strong influence on the multiple corre- lation coefficients, but the U,, values, with a 0.08-s early time limit, produced the strongest correlations. The U,, val- ues, using the Lochner and Burger weighting factors in the calculation of the early useful sound energy, were not superi- or to the other less complex measures. The multiple correla- tions in the lowest four octave bands tended to be a little smaller than in the highest three bands.
The SE values in Table I I ( b ) show that speech intelli bility scores could be predicted with a standard error ,, small as & 6.8%. This minimum SE value occurred for the 125-Hz and 2-kHz U,, values. This is smaller than the SE value for A1 values, S/N(A) values, compound A1 and S/ N ( A ) predictors with decay times, or for ST1 values as PI dictors of speech intelligibility scores. Figure 4 plots spee intelligibility scores versus U,, values and also shows t best-fit third-order polynomial. This best-fit curve, for pre- dicting speech intelligibility (SI), is given by the following equation:
SI = 1.219
.
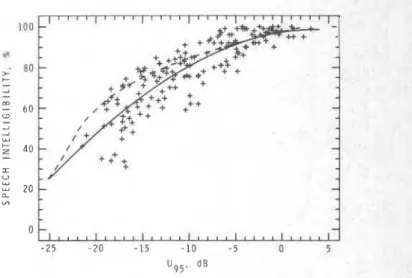
Ux0 - 0.02466 UioFigure 5 is a similar plot in terms of U,, values, and includ both the best-fit third-order polynomial to the measur data and Latham's best-fit curve to his data. The best-fit li on this figure is given by
SI = 0.7348
.
Ug5 - 0.09943.
U;, gi- a '2 re- ch heLatham's curve differs a little from the best fit to the present data. This difference can be attributed to a number of differ- ences in procedures between Latham's work and the present study. ( 1 ) Latham quotes speech levels in terms of long-time mean sound levels, whereas in the present study, speech lev- els are the more usual long-time energy average levels. ( 2 ) Latham measured the attenuation of speech levels from the source to each receiver position, but in the present study these effects were only calculated. ( 3 ) Latham used a mean maximum PNC value as a measure of background levels obtained from sound level meter readings. In the present study, 1-min energy average A-weighted background levels were used. (4) While Latham used one typical value to rep- resent the background levels in a hall, in the present, back- ground levels were measured at each receiver position. Lath- am's use of mean maximum PNC background levels and mean speech levels would produce lower values than the energy average levels in the present study. However, the dif-
0
Y
2 20
-
-
ference between the two quantities, which influences the fi-t ,
, nal useful/detrimental ratios, would probably be similar to
c the values in the present research. ( 5 ) Finally, Latham used
0 C
-
I ~ I I L I i 4 ~ ~ I ~ I I L I ~ I I I I ~ , 1 1 1 ~ I I I I ~ the Schroeder integrated impulse response technique to ob-
0 0 . 1 0 . 2 0 . 3 0 . 4 0.5 0 . 6 0 . 7 tain a smooth decay curve (equivalent to the ensemble aver-
S P E E C H T R A N S M I S S I O N I N D E X V A L U E S
age of a large number of decays from steady-state noise) as
FIG. 3. Measured speech intelligibility scores versus STI values (including an impulse response from which to identify individual reflec- background noise levels) and best-fit third-order polynomial. tions, and then applied Lochner- and Burger-type weighting 840 J. Acoust. Soc. Am., Vol. 80, No. 3, September 1986 J. S. Bradley: Predictors of speech intelligibility 840
TABLE 11.
! I
Independent variable
(a) Multiple correlation coefficients from third-order prediction equations of c 3 5 (0.120)nsa (0.218)ns 0.369 C50 (0.189)ns 0.337 0.404 C80 (0.172)ns 0.329 0.442 c 9 5 0.236 0.234 0.391 RT 0.236 0.315 0.580 EDT 0.268 0.371 0.593 u 3 5 0.866 0.923 0.829 0.884 0.913 0.849 u s 0 0.918 0.907 0.878 u 9 5 0.849 0.870 0.820
'speech intelligibility scores 0.421 0.516 0.475 0.567 0.485 0.582 0.473 0.492 0.609 0.642 0.587 0.624 0.870 0.901 0.874 0.909 0.898 0.919 0.874 0.898 (b) Standard errors, percent
c 3 5 (17.l)ns (16.8)ns 16.0 15.6 14.7 15.2 15.1 C50 (16.8)ns 16.2 15.7 15.1 14.2 14.5 14.9 c s o (16.9)ns 16.2 15.4 15.0 14.0 14.1 14.6 c 9 5 16.7 16.7 15.8 15.1 14.9 14.5 15.1 RT 16.7 16.3 EDT 16.5 16.0 "ns = not significant,p(0.05.
functions to sum the early useful energy. He did not describe how he calculated the weightings of each early reflection. His decays would not be the same as the original impulse response in that they would not contain spikes representing individual reflections. Latham's data, although obtained from seven different rooms, included 95 sets of test data with a more limited range of reverberation times. It is not possible to explain in detail how each of these procedural differences contributed to the final results of each study, but there were enough significant differences to lead to the overall differ- ences, seen from the curves in Fig. 5.
D. Early/late measures, high signal-to-noise ratios The poor correlations between speech intelligibility scores and early/late ratios or decay times were assumed to
FIG. 4. Measured speech intelligibility scores versus 1-kHz U,, values and best-fit third-order polynomial.
be due to the large variance attributed to variations in signal- to-noise ratios. If the signal-to-noise ratio is high enough, then the background noise would have only a minor effect on speech intelligibility. Accordingly a subset of the data was created where S/N(A) ratios were all greater than 10.0 dB. This subset contained 43 cases. For the 500-Hz and 1-kHz octave bands, the data of this subset were then considered as before, by fitting third-order polynomials of the predictor variables to obtain best-fit curves with speech intelligibility
scores. Table I11 gives the resulting multiple correlation co-
efficients. When the detrimental effects of background noise are reduced in this way, the multiple correlation coefficients between speech intelligibility scores and early/late ratios
FIG. 5. Measured speech intelligibility scores versus 1-kHz U9, values, best-fit third-order polynomial (solid lines) and Latham's best-fit curve (dashed line).
equations, I 0 dB.
TABLE 111. Multiple correlation coefficients
..,.,,
u,,Lu-,,u,L pLGulbL,vlrS / N ( A ) Z I I Octave-ba Independent
-
variable S f M lo00 c 3 5 0.706 0.741 csn 0.712 0.725 c80 0.499 0.593 c95 0.547 0.665 RT 0.401 0.537 EDT (0.185)nsa 0.478 u35 0.700 0.813 usn 0.776 0.716 u w 0.567 0.683 u95 0.583 0.767 "ns = not significant,^ < 0.05.were increased and were similar to those with usefuvdetri- mental ratios. Thus speech intelligibility scores are in- fluenced by the strength of the early-arriving sound relative to the strength of the later-arriving sound. However, the ad- verse effects of inadequate signal-to-noise ratios seem to be more critical, and have larger effects on the resulting speech intelligibility. This result may be partly due to the nature of the present experiment, where speech source level was delib- erately varied over a wide range, but at relatively low levels, compared to typical speech. However, even for the limited case described above, where all S/N ( A ) values were greater than 10.0 dB, speech intelligibility scores were still signifi- cantly related to the S/N(A) values.
E. Early/late measures, multiple band combinations
The A1 values, S/N(A) ratios, and ST1 values are broadband measures, incorporating information from the seven octave bands from 125-8000 Hz. Attempts were made to calculate useful/detrimental ratio measures including in- formation from three octave bands. Two different sets of three octave bands were tried and two types of summation were considered. The octave bands included 500, 1000, and
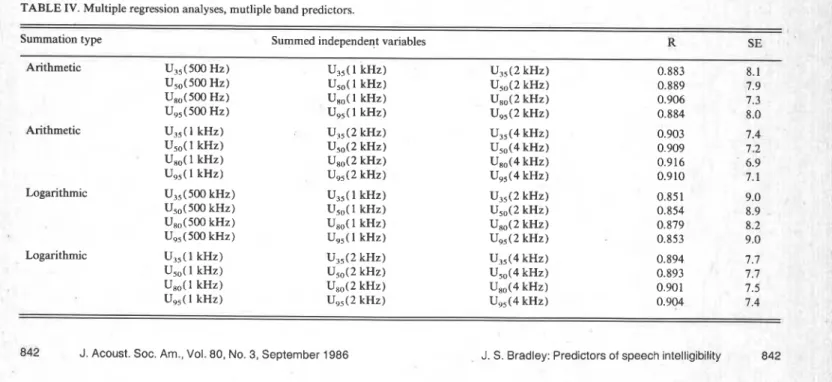
TABLE IV. Multiple regression analyses, mutliple band predictors.
9 m nnr
A100 HZ in U l l L b-c 41111 I-, AWU, auJ 4000 HZ 111 c1lc; "Ll, ase. For one type of summation, the useful/detrimental I
lo values from the three octave bands were simply arithrr --cally summed, while in the other type of summation, t__- useful/detrimental ratios were converted to pressul squared values, added as energies, and converted back decibels. The resulting multiple correlation coefficients a1 associated SE values are given in Table IV. The simple arit metic summations produced more accurate predictions th< the logarithmic summations and the sums that include the kHz octave band produced more accurate predictions t h a ~ those that included the 500-Hz octave band. The results were disappointing in that the created multiple band predic- tors were no more accurate than the best single band predic. tors.
Broadband useful/detrimental ratios were also creat using an A-weighting technique and also using the octa band weighting factors of the A1 procedure. Octave band U,, values were A-weighted and added together as energies to obtain an A-weighted U,, value. Multiple regression anal- ysis was then used to find the best third-order polynomial the A-weighted U,,, as a predictor of speech-intelligibili scores. A multiple correlation coefficient of 0.905 was a tained with an SE of
+
7.3%. Again, this was no better thpn several single-octave band U,, values. When a broadba~ measure was formed by weighting the linear pressu~ squared ratios from U,, values with the octave band weigllL- ings used in the A1 procedure, the result was a less successi predictor. The result of the multiple regression analysis, Iing this new measure as a third-order polynomial predictc was a multiple correlation coefficient of 0.827 with an SE
& 9.7%.
F. Inter-relation of physical measures
In a previous study, various earlyAate ratios and dec, times were quite strongly correlated.' A consideration oft relationships between measures, not considered in the pr vious study, can assist in a further understanding of the prt ent results. Accordingly, Fig. 6 plots C,, values versus me
-a- le- h e of ity lb- 'ul 1s- Ir.
Summation type Summed independent variables R SE
Arithmetic U35( 500 Hz) Um(500 HZ) UBo(500 Hz) U95(500 Hz) Arithmetic U ~ S ( 1 kHz) U5n( 1 kHz) 1 kHz) U95 ( 1 kHz)
Logarithmic U,, ( 500 kHz) u35( 1 kHz) U35(2 kHz) 0.851 9.0
U5,(500 kHz) USo ( 1 kHz) Usn(2 kHz) 0.854 8.9
U,,(500 kHz) U8,( 1 kHz) Usn(2 kHz) 0.879 8.2
U9, (500 kHz) U9,( 1 kHz) U95(2 kHz) 0.853 9.0
Logarithmic U,5(1 kHz) U35(2 kHz) U35(4 kHz) 0.894 7.7
1 kHz) Usn(2 kHz) Usn(4 kHz) 0.893 7.7
Us,( 1 kHz) u8,(2 k ~ z ) Ugn(4 kHz) 0.901 7.5
U95( 1 kHz) U95 ( 2 kHz) U95(4 kHz) 0.904 7.4
FIG. 6. Measured C,, values versus C,, values, both at 1 kHz.
sured C,, values. In spite of the quite different derivations of these two measures, the resulting values are remarkably sim- ilar. Similarly, Us, and U,, values were nearly equal in value. This explains why correlations with U,, and U,, values pro- duced such similar results, and suggests that the complicat- ed weighting procedure involved in the calculating of C,, values is not necessary, particularly since the other useful/ detrimental ratios were at least as accurate as U,,, as predic- tors of speech-intelligibility scores.
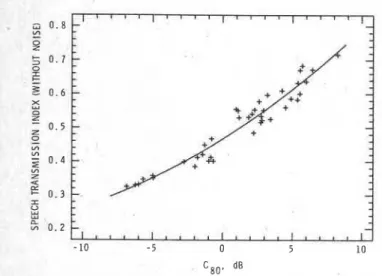
Although ST1 has been strongly promoted as a predic- tor of speech intelligibility, the present results suggest that it is similar, but slightly inferior, to useful/detrimental ratios. Figures 7 and 8 compare values of C,, and no-noise ST1 and values of Us, and ST1 with noise, respectively. Figure 7 shows that no-noise ST1 values are closely related to C,, values: They are essentially another way of measuring al- most the same property of a room. Figure 8 demonstrates that even with the added complexity of added background noise, ST1 values with noise and Us, values are very closely related. Of course the relationship is not exact, but the fact that U,, values are more highly correlated with speech intel- ligibility scores suggests that some of these small differences make
U,,
a more accurate predictor.FIG. 7. Measured C,, values at 1 kHz versus ST1 values excluding the ef-. fects of background noise.
FIG. 8. Measured ST1 values including the effects of background noise VI sus U,, values at 1 kHz and the best-fit third-order polynomi-1
Ill. OPTIMUM CONDITIONS FOR SPEECH
The results of the present study can be used to deduce acoustical design goals for ideal conditions for speech, in terms of specific acoustical measures. Of the various mea- sures considered in this paper, a combination of the A- weighted signal-to-noise ratio, with the RT, is the simplest, and involves only measurements that are readily made with commonly available acoustical measuring equipment. Fig- ure 9 plots curves corresponding to the regression coeffi- cients for this case from Table I for RT values of 1,2, 3, and 4 s. Due to the nature of the rhyme test that was used, a satisfactory minimum speech-intelligibility score must be very high.
Latham5 suggests that speech intelligibility scores should be 97% for excellent speech intelligibility. In this study, the point where the best-fit curves are closest to 100% speech intelligibility is used as an ideal design goal. Using this criterion, the results of Fig. 9 are in agreement with conventional acoustical wisdom: For optimum conditions, an RT of slightly less than 1.0 s and a signal-to-noise ratio of at least 15 dBA are required.
From the optimum signal-to-noise ratios, known speech
0
I l l l l l l . l . l l l l l l l l l I I
- 10 - 5 0 5 10 15
S I N ( A ) , d B A
FIG. 9. Best-fit curves of speech intelligibility versus overall signal-to-noise ratio for RT values of 1, 2, 3, and 4 s.
~m effect, dB TABLE V. Calculation of worst-case room effects.
-
-
Volume, RT, Sour-receiver Roc
m3 seconds distance, m
-
300 0.5 8 - 2 loo0 0.7 8 - 6 3000 0.9 16 - 10 10 000 1.1 16 - 14 30 000 1.3 16 - 17 -levels, and the reduction in levels between source and receiv- er positions in a room, one can also estimate maximum ac- ceptable background noise levels. Pearsons et al., found the
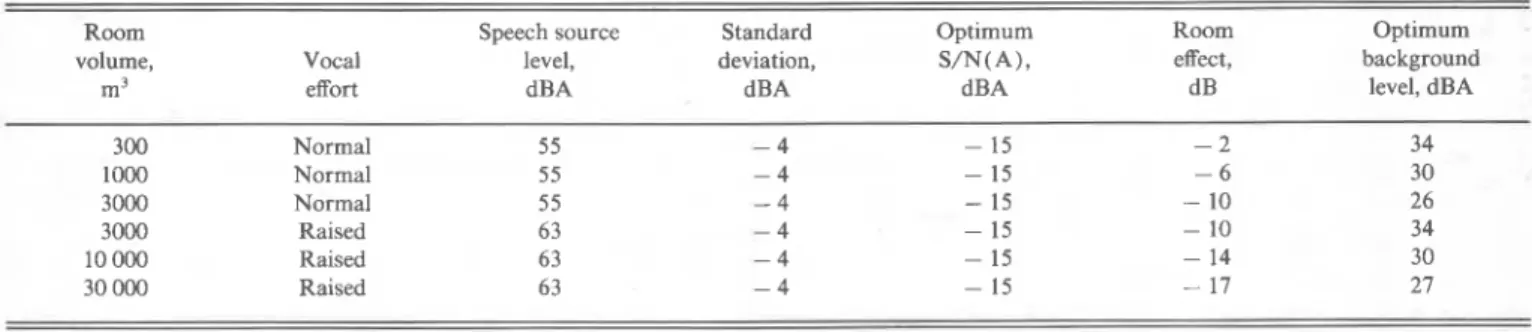
mean and standard deviation of speech levels for groups of people at five different levels of vocal effort. These overall A- weighted source levels were slightly lower for female speak- ers and so the data for females should be used as a worst case. The levels of vocal effort were: casual, normal, raised, loud, and shout. Presumably, the level of vocal effort would vary with room size. In smaller rooms, "normal" vocal effort would be expected, whereas in larger rooms, a "raised" vocal effort would be more likely. The room effect, the reduction in long-term rms speech levels from a one meter source posi- tion to the various receiver positions, would also vary from room to room. This room effect increases with decreasing RT, and with increasing source-receiver distance. By calcu- lating these room effect values, using Eq. ( 1) for a large number of combinations of room size, RT, and source-re- ceiver distance, frequently occurring worst-case room ef- fects were estimated for various room sizes. Table V sum- marizes the calculation of the worst-case room effects, which varied from - 2 to - 17 dB for room volumes of 300- 30 000 m3. To calculate optimum background levels for very good speech conditions, the female speech source levels from Ref. 8 were reduced by one standard deviation to include the majority of speakers. They were then further reduced by the ideal minimum S/N(A) of 15 dBA, and also by the worst case room effect for each size of room. These calculations, summarized in Table VI, suggest ideal maximum back- ground levels of between 27-34 dBA. For smaller rooms of 300-1000 m3, ideal maximum background levels of 30-34 dBA were obtained. For medium sized rooms of 3000 m3, background levels of 26 and 34 dBA were obtained, depend- ing on the level of vocal effort. In large rooms with volumes of 10 000-30 000 m3, ideal maximum background levels of 27-30 dBA were obtained, depending on the room size. Ber- anek9 suggests maximum background levels of 30 dBA for
TABLE VI. Calculation of optimum background levels.
large theatres and auditoria, and 42 dBA for small theatres and auditoria. Thus the present ideal-maximum values for 3000-30 000 m3 rooms are quite close to Beranek's large auditoria values, but the present ideal-maximum values for rooms of 300-1000 m3 are more conservative than Beranek's recommended small-auditoria values.
One would similarly like to estimate minimum U,, val- ues to provide a high-quality speech environment. From the best-fit curve of Fig. 4, a mean score of 100% is reached for a U,, value of
--
+
4 dB for these 1-kHz results. When back- ground noise levels are very low, the C,, will be equal to the U,,. In this special case, one would thus require a minimum C,, of+
4 dB at 1 kHz, for very good speech conditions. From the results of a previous paper,7 this optimum C,, val- ue would correspond to a C,, of approximately+
1 dB or to a Deutlichkeit value of 0.56. (Deutlichkeit is the linear ratio of the early-arriving sound energy in the first 50 ms to the total energy. )For the more realistic situations with some non-negligi- ble background noise, it is of interest to understand how C,, values and background noise levels combine to produce U,, values. Accordingly, Fig. 10 plots calculated 1-kHz U,, val- ues versus 1-kHz C,, values for various A-weighted overall signal-to-noise ratios. A 1-kHz U,, of
+
4 dB can be ob- tained by various combinations of C,, and overall signal-to- noise ratio. For example, a 1-kHz U,, of+
4 dB could be achieved by a combination of a 1-kHz C,, of+
4 dB and a signal-to-noise ratio of 25 dBA, or with a 1 kHz C,, of 6.3 dB and a background signal-to-noise ratio of 15 dBA.To fully utilize U,, values in the design of rooms for speech, it is necessary to predict C,, values in rooms. Recent work by Barronlo has considered the problem of estimating C,, values in rooms. Further work is now required along these lines, combined with studies to gain more familiarity with the use of U,, values, and to determine what values represent satisfactory conditions in particular rooms. IV. CONCLUSIONS
The results of this work suggest that several methods of almost equivalent prediction accuracy can be used for esti- mating expected speech intelligibility scores obtained using a Fairbanks rhyme test. The simplest approach, both in terms of performing calculations or in terms of making measure- ments, would be to obtain the A-weighted signal-to-noise ratio [S/N(A) ] and the 1 kHz RT value and use the regres- sion coefficients in Table I to form a prediction equation, as illustrated in Fig. 9, to estimate the expected speech-intelligi-
Room Speech source Standard Optimum Room
volume, Vocal level, deviation, S/N(A), effect,
m3 effort dBA dB A dBA dB
300 Normal 55 - 4 - 15 - 2 1000 Normal 55 - 4 - 15 -6 3000 Normal 5 5 - 4 - 15 - 10 3000 Raised 63 - 4 - 15 - 10 10 000 Raised 63 - 4 - 15 - 14 30 000 Raised 63 - 4 - 15 - 17 Optimum background level, dBA
10 suring equipment to make measurements UI a I I values from
steady-state test signals, or a quite powerful computer and
5 associated software if values are to be calculated from pulses,
as in this study. O m O ACKNOWLEDGMENTS &, - 5 m 3
The authors would like to thank Reina Lamothe for her considerable efforts in assisting with programming and pro-
-10
cessing of the data, and the National Arts Center for their
- 1 5 cooperation and assistance. This paper is a contribution
from the Institute for Research in Construction, National
-
20 Research Council of Canada.-
15 -10 -5 0 5 10C s O , d B
FIG. 10. Calculated U,, vs C,, at 1 kHz for overall signal-to-noise ratios of 0,5, 10, 15,20,25, and 30 dBA.
bility score. With the present data this method was almost as accurate as useful/detrimental sound ratios, and more accu- rate than ST1 values.
The present data may ovesemphasize the importance of the signal-to-noise ratio, and may influence the success of the combination of S/N ( A ) and RT ( 1 kHz) as a good predic- tor of speech intelligibility. It is safer and more generally reliable to use the 0.08-s useful/detrimental ratio (U,,) as the preferred predictor of speech intelligibility. This has the added advantage that C,, values, from which U,, values are derived, are useful in rooms where music is also to be per- formed. The use of U,, values based on early/late ratios is also desirable, as these values are easily related to the funda- mental physical quantities involved. One can readily grasp that increased or stronger early reflections lead to larger U,, values and hence, to increased speech intelligibility scores, and such increases can be observed directly from the pulse response in a room as displayed on an oscilloscope. The changes to a room can be directly related to changes in the degree of speech intelligibility in the room. The ST1 seems to be a somewhat equivalent, although a little less accurate, predictor. Unfortunately, it requires a separate set of mea-
'"Methods for the Calculation of the Articulation Index," ANSI Standard S3.5-1969 (American National Standards Institute, New York, 1969). 'T. Houtgast, H. J. M. Steeneken, and R. Plomp, "Predicting Speech Intel-
ligibility in Rooms from the Modulation Transfer Function. I. Genera Room Acustics," Acustica 46, 6C72 ( 1980).
3H. J. M. Steeneken and T. Houtgast, "A Physical Method for Measuring Speech Transmission Quality," J. Acoust. Soc. Am. 67, 318-326 ( 1980).
4J. P. A. Lochner and J. F. Burger, "The Influence of Reflections on Audi- torium Acoustics," J. Sound Vib. 1,426-454 (1964).
'H. G. Latham, "The Signal-to-Noise Ratio for Speech Intelligibility-An Auditorium AcousticsDesign Index," Appl. Acoust. 12,253-320 ( 1979). 6W. Reichardt and U. Lehman, "Optimierung von Raumeindruck und Durchsichtigkeit von Musikdarbietungen durch Auswertung von Impuls- shalltests," Acustica 48, 174-185 ( 1981 ).
'J. S. Bradley, "Auditorium Acoustics Measures from Pistol Shots," J. Acoust. Soc. Am. 80, 199-205 ( 1986).
'K. S. Pearsons, R. L. Bennett, and S. Fidell, "Speech Levels in Various Noise Environments," Bolt Beranek and Newman Inc., Report to U. S. EPA (Canoga Park, CA, May 1977), pp. 27M53.
9L. L. Beranek, Noise and Vibration Control (McGraw-Hill, New York, 1971), p. 585.
'OM. Barron and L . J . Lee, "Energy Relations in Concert Auditoria, I." J. Acoust. Soc. Am. (submitted for publication).
T h i s paper