HAL Id: hal-01307042
https://hal.archives-ouvertes.fr/hal-01307042
Submitted on 26 Apr 2016
HAL is a multi-disciplinary open access
archive for the deposit and dissemination of
sci-entific research documents, whether they are
pub-lished or not. The documents may come from
teaching and research institutions in France or
abroad, or from public or private research centers.
L’archive ouverte pluridisciplinaire HAL, est
destinée au dépôt et à la diffusion de documents
scientifiques de niveau recherche, publiés ou non,
émanant des établissements d’enseignement et de
recherche français ou étrangers, des laboratoires
publics ou privés.
Hydrodynamics and particle motion in upward flowing
dense particle suspensions: Application in solar receivers
Pablo García-Triñanes, Jonathan Seville, Benjamin Boissière, Renaud Ansart,
Thomas Leadbeater, David Parker
To cite this version:
Pablo García-Triñanes, Jonathan Seville, Benjamin Boissière, Renaud Ansart, Thomas
Lead-beater, et al.. Hydrodynamics and particle motion in upward flowing dense particle suspensions:
Application in solar receivers.
Chemical Engineering Science, Elsevier, 2016, 146, pp.346-356.
To link to this article : DOI : 10.1016/j.ces.2016.03.006
URL : http://dx.doi.org/10.1016/j.ces.2016.03.006
O
pen
A
rchive
T
OULOUSE
A
rchive
O
uverte (
OATAO
)
OATAO is an open access repository that collects the work of Toulouse researchers and
makes it freely available over the web where possible.
This is an author-deposited version published in :
http://oatao.univ-toulouse.fr/
Eprints ID : 15643
To cite this version :
García-Triñanes, Pablo and Seville, Jonathan
and Boissière, Benjamin and Ansart, Renaud and Leadbeater,
Thomas and Parker, David Hydrodynamics and particle motion in
upward flowing dense particle suspensions: Application in solar
receivers. (2016) Chemical Engineering Science, vol. 146. pp.
346-356. ISSN 0009-2509
Any correspondence concerning this service should be sent to the repository
administrator: staff-oatao@listes-diff.inp-toulouse.fr
Hydrodynamics and particle motion in upward flowing dense particle
suspensions: Application in solar receivers
Pablo García-Triñanes
a,n, Jonathan Seville
a, Benjamin Boissière
b,c, Renaud Ansart
b,c,
Thomas Leadbeater
d, David Parker
daDepartment of Chemical and Process Engineering [J2], University of Surrey, Guildford GU2 7XH, United Kingdom bUniversité de Toulouse, INPT, UPS, Laboratoire de Génie Chimique, 4, Allée Emile Monso, F-31030 Toulouse, France cCNRS, Laboratoire de Génie Chimique, F-31030 Toulouse, France
dPositron Imaging Centre, School of Physics and Astronomy, University of Birmingham, Edgbaston, Birmingham B15 2TT, United Kingdom
H I G H L I G H T S
! An experimental apparatus for the investigation of hydrodynamics of upward-flowing dense phase parti-cle suspensions.
!The effect of fluidisation and
aera-tion flow rate on solid flow stability is presented.
!PEPT was used to visualise particle
trajectories and velocity profiles. ! A novel procedure was used to
obtain vertical solid flux.
G R A P H I C A L A B S T R A C T
Keywords:
Fluidisation
Fine particles (A/B-type) Dense particle suspension Upward flow
Heat transfer media Solar energy
Positron Emission Particle Tracking
a b s t r a c t
Dense gas–solid suspensions have the potential to be applied as heat transfer fluids (HTF) for energy collection and storage in concentrated solar power plants. At the heart of these systems is the solar receiver, composed of a bundle of tubes which contain the solid suspension used as the thermal energy carrier. In the design investigated here, the particles form a dense upward-flowing suspension. Both density of the suspension of these particles and their movement have a strong influence on the heat transfer. An apparatus was designed to replicate the hydrodynamic and particle motion in the real solar energy plant at ambient temperature. The governing parameters of the flow were established as the solid feeding flow rate, the fluidisation velocity, the solids holdup, the freeboard pressure and the secondary air injection (aeration) velocity. In the case studied, aeration was applied with air introduced into the uplift transport tube some way up its length. This study finds that the amount of this secondary air injection is the most important parameter for the stability and the uniform distribution of the solids flow in the tubes. Solids motion was measured using the non-invasive positron emission particle tracking (PEPT) technique to follow the movement of a 60 mm tracer particle, onto which was adsorbed the
positron emitting 18F radioisotope. Analysis of the resulting three-dimensional trajectories provides
information on solids flow pattern and solids velocity. Results show the overall behaviour of the bulk material in detail: small step-wise movements associated with bubble motion superimposed on a gen-eral trend of upward flow in the centre and downward flow close to the walls. These findings suggest that this particular type of flow is ideal for transporting energy from the walls of the solar receiver tubes.
http://dx.doi.org/10.1016/j.ces.2016.03.006
n
Corresponding author.
1. Introduction
Concentrated solar energy has received much attention in recent years due to its potential economic return, energy supply impact, and environmental benefits. In concentrated solar power plants, solar energy is focussed by means of arrays of sun-tracking mirrors onto a tower receiver, which is usually a set of tubes through which a heat transfer medium flows throughWO/2012/ 052661. The medium is heated and can then exchange this heat with a conventional steam cycle to generate power. The choice of the heat transfer medium is important since it is one of the critical components for storing and transferring thermal energy in
con-centrated solar power systems. Molten salts are traditionally used,
but have major disadvantages. These include, for example, the large electricity demand associated with pumping the salt to the top of the tower, practical upper temperature limit, maintenance costs, corrosion, spillage, toxicity and safety issues.
An alternative approach is necessary and we propose the use of a suspension of particulate solids as an advantageous heat transfer medium. In solar energy capture systems, the heat is captured at the outside tube wall, and subsequently transferred to the circu-lating solids. Few studies have been reported on dense-phase transport of this kind, in which particle motion is constrained by the high degree of particle–particle contact. This is recognised as a difficult regime in which to maintain stable flow conditions due to difficulties (i.e. choking, severe slugging) is hard to achieve (Bi and Grace, 1995).
This particular type of flow is distinct from that normally encountered in conventional circulating fluidised beds. In these beds the gas velocity is much higher and the solids are normally in a dilute suspension, either uniformly across the tube or in a combination of a dense annulus near the wall and a dilute core, with exchange between them.
In general, gas–solid suspensions can be classified according to their particle concentration distribution and the differences in gas and particle phase movement; bubbling fluidisation, fast fluidisa-tion and dilute phase pneumatic conveying are recognised as distinct states. Since the particles are moving relative to each other and there is great agitation, heat transfer from solid to gas in the dense phase should be higher than in a fixed bed at the same gas velocity and void fraction. However, the particle Reynolds num-bers are often less than 1, and fixed bed correlations are not reli-able in this region.
The concentration of particles and their motion play a decisive role in the heat transfer and are directly affected by the operating parameters (i.e. gas velocity, bed pressure, bed temperature). Particle convection to the wall is the dominant heat transfer mechanism (Flamant et al., 1992), and the extent of this depends on the local solids density and the rate at which particles are replaced at the wall (i.e. their renewal rate). An increase in gas velocity affects these two parameters in different ways; as the gas velocity is increased, the heat transfer coefficient rises because of the increased renewal of solids at the surface, reaches a maximum and subsequently decreases as the surfaces become blanketed by excess gas (Botterill, 1975).
The conditions for stable flow of particles in these suspensions have been established by previous work at the University of Toulouse (Boissiere et al., 2015). For the present investigations, experiments were carried out at the Positron Imaging Centre (University of Bir-mingham, BirBir-mingham, UK), using an ambient temperature model constructed specially for this purpose and reproducing the conditions of the Toulouse experiments. In order to obtain sufficient experi-mental data it was necessary to operate this apparatus in a
con-tinuous circulation mode so that sufficient passes of the radioactive
tracer could be observed. For this reason a return leg was designed so that solids could circulate in a closed-loop. A stable solids flow was
obtained by the same method as employed in the previous work, i.e. by submerging the bottom end of the conveying tube into a slightly pressurised fluidised bed. The solids fraction in the tube is close to that of a dense fluidised bed and a bubbling regime is ensured by its aeration (Flamant et al. 2014).
The present work improves the understanding of the hydro-dynamics in dense upward-flowing gas-particle suspensions by
quantitative characterisation of single particle motion in the solids
flow. We describe the particle motion in a vertical tube of the same diameter as those used in a solar receiver, investigated through the use of the Positron Emission Particle Tracking (PEPT) measure-ment technique and providing a comprehensive description of how the particles behave inside the uplift transport tubes. Since the movement of the particles controls the effective thermal conductivity of the suspension, the particle velocities were determined under a range of conditions in order to quantify the exchange rate between the wall and the bulk of the suspension.
2. Experimental
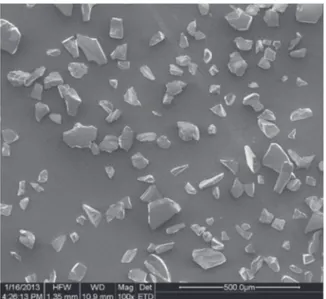
The selection of the particulate solid was based on its size and its other physical properties. In this application, the powder must have good heat capacity, capability of working at a high tem-perature (over 750 °C), good thermal conductivity, very low attri-tion and low cost. In addiattri-tion the absence of any phase transiattri-tion or chemical reaction in the temperature range of interest is favoured. Based on these criteria, silicon carbide was selected (Navarro SiC S.A.). A 100 " magnification SEM image of the selected solid (designated F220) is shown inFig. 1.
The particle size must favour good fluidisation at low gas velocities, meaning low gas-compression energy consumption in the solar application. The association of requirements suggests a choice of size and density corresponding to particles that straddle the boundary between A and B groups of Geldart's classification. In practice, a size of 60
μ
m was found suitable considering that the particle density of F220 silicon carbide is 3210 kg m# 3.Volume-based and cumulative particle size distribution measured using a Mastersizer 2000 (Malvern Instruments Ltd.) are shown inFig. 2.
The minimum fluidisation velocity Umf, the minimum bubbling
velocity Umband their associated void fractions
ε
mfandε
mbwereexperimentally determined in a separate column using standard techniques (Seville et al, 1987) and are reported inTable 1.
Fig. 1. Scanning electron microscopy picture corresponding to the SiC powder sample.
In the application, the heat transfer medium flows through multiple parallel vertical tubes. In the present study, a single tube with similar dimensions, aeration conditions and a configuration that mimics the receiver concept was used to circulate the powder at ambient temperature for detailed examination of particle motion (shown inFig. 3). The vertical tube of 1.1 m in length and 0.03 m in diameter was partially submerged in a bubbling flui-dised bed known as the dispenser fluiflui-dised bed (DiFB). For upward flow to occur in the tube, the DiFB must be pressurised, this pressurisation being controlled by use of a Bronkhorst type pneu-matic valve that uses an integrated pressure control connected to a PID controller.
The dense upward-flowing suspension rises up the transport tube, which has additional aeration located 0.25 m above the bottom of the uplift tube, and terminates in a cyclone-like disen-gaging zone. From here the disengaged solids fall under gravity into a downcomer. An outlet tube is connected to a cyclone in order to prevent loss of particles to the environment.
Pressure sensors are placed at different heights on the tube, from which the local pressure drop of the suspension can be measured and thus the suspension void fraction is calculated.
In operation, the DiFB is fluidised at a gas velocity Ufslightly
higher than the minimum bubbling velocity. Pressurising the DiFB bed induces the solids to rise in the tube, transforming the system into an Upflow Bubbling Fluid Bed (UBFB). The operating para-meters are the fluidisation flow rate of the dispenser fluidised bed (Qf), the aeration flow rate in the tube (Qae) and the relative
pressure of the DiFB freeboard (Pfb). Helium gas tracer was injected
in the different gas injection points and the helium concentration was measured at the top of the bed as a function of time with a micro-volume thermal conductivity detector. Only 5% of the gas injected at the bottom of the fluidised bed travels up the transport tube since 95% is released through the pressure regulator valve. The helium tracing of the gas phase demonstrated that the gas flow in the transport tube is only upward.
The operating parameters of the reference test case are repor-ted inTable 2.
Fig. 3 shows the (single tube 30 mm ID, circulating) experi-mental rig highlighting the measurement region.
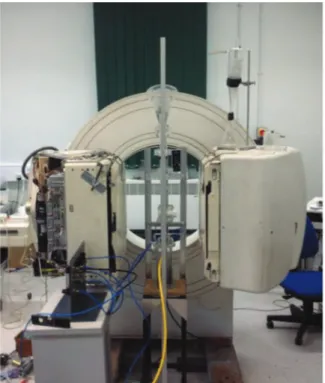
Fig. 4shows a photograph of the experimental apparatus and its arrangement during the PEPT experiments between the two detector arrays of the positron camera.
Fig. 2. Particle size distribution of the SiC powder. Table 1
Physical and hydrodynamic properties of F220 silicon carbide.
Physical properties Hydrodynamic properties
d10[μm] d50[μm] d90[μm] d32[μm] ρp[kg m# 3] λ[W m# 1K# 1] cp,m[kJ kg# 1K# 1] Tmelting[K] Tmax[K] Umf[m s# 1] εmf Umb[m s# 1] εmb 44 79 130 64 3210 114 (300 K) 0.67 (300 K) 2730 1300 0.005 0.57 0.008 0.59
35 (1300 K) 1.26 (1300 K)
Fig. 3. Detailed drawing of the experimental setup (Scale 1:4).
Table 2
Operating parameters of the reference test cases.
Fluidisation flow rate (Qf) Aeration flow rate (Qae) Pfb
Qf¼ 3.5–4.3 Nm3h# 1 150–225 NL h# 1 15 kPa
Particles from the downcomer are fed into the pressurised DiFB continuously. Attempts were made to achieve this by use of a rotary valve. However, leakage problems were observed when connected in operation with the pressurised fluidised bed. A possible alternative was to use an L-valve but this was dismissed because a preliminary study showed that the pressure over the uplift transport tube made it very difficult to avoid gas leaking upwards through the L-Valve and associated moving bed down-comer. A purpose-designed inclined eductor (see Fig. 5) in an 11 mm inner diameter recycling tube proved to be more satisfac-tory, limiting the flowpath of air up the transport tube but per-mitting the return flow of powder. This approach was adopted for all the experiments recorded here. The amount of air injected at the eductor throat was kept to the minimum, necessary to move
the bulk (48 NL/h). This was favoured by the static head of a dense column of particles maintained upstream which helped to over-come the
Δ
P requirement for flow. The conditions in the uplifttransport tube, in particular density and particle velocity, were not determined by the conditions at the eductor but by the fluidising flow and by the additional aeration.
The advantages of the eductor are multiple because its throat acts as a restriction on the gas flow, reducing the velocity at the downstream solids entry end; these advantages include a favour-able pressure range, dense phase operation, no blowback, no mechanical shearing and absence of moving parts. The system included a mechanical seal (a PTFE plug valve) upstream of the eductor to shut off backflow during the start-up and permit a dense static bed to accumulate in the return tube. The rig was also equipped with a pressure control system and a data logger con-nected to a LabVIEW interface (National Instruments Corporation) in order to obtain pressure readings using pressure transducers at different points in the uplift transport tube. If the system is not fully controlled it can lead to erratic pressure fluctuations in the fluid bed and air can travel up the recycle tube in a slug flow pattern, fluidising powder back up the recycle tube to the disen-gagement section; bridging of powder can also occur in the recycle tube due to this effect.
A regulated air supply from a compressor provided a constant pressure supply (300 kPa). The air was introduced to the system through a sintered brass distributor plate with a pore size of 37
μ
m and a thickness of 6 mm (GKN Sinter Metal Filters GmbH) in order to achieve a homogeneous flow of gas through the full cross sec-tion of the DiFB.For purposes of experimental repeatability and to reach steady-state conditions, it was important to satisfy the condition that the overall mass circulation was in the desired range. This was achieved by using variable area flowmeters connected to the flow loop using large bore flexible piping (8 mm OD) and avoiding over-pressurising the system (controlling the pressure drop along the uplift transport tube and using a back pressure regulator set to control pressure in the emitting fluidised bed at approximately 110 mbar). Analysis revealed a direct correlation between the extent of aeration and the solids mass flow rate. During these experiments the average solids flow rate was 70 kg/h with a par-ticle volume fraction of 25–40%.
Fig. 4. Location of the single tube circulating apparatus (GU1) positioned relative to the PEPT camera.
3. Results and discussion
3.1. Influence of the operating conditions
To establish the operating conditions for stable upward sus-pension flows the governing parameters including aeration flow rate of the uplift transport tube, air flow in the venturi and flui-disation flow rate were appropriate to ensure steady flow of solid in the tubes and comparable with results obtained in the previous work (Boissiere et al., 2015). The flow in the vertical tubes is greatly influenced by the fluidisation flow rate of the DiFB. The fluidisation velocity must be higher than the minimum bubbling velocity to warrant an acceptable stability. The optimal fluidisation velocity ranged between 1 and 1.4 Umbto ensure a steady flow of
solid in the tubes. Therefore, the reference value was chosen as 1.2
Umb (0.096 m/s). Moreover, it was demonstrated that the same
aeration and fluidisation conditions (Uf4Umband Uae45 Umb) are
required to ensure stability. A successful reproducible operating regime was achieved, together with a high particle volume frac-tion which is important for good heat transfer.
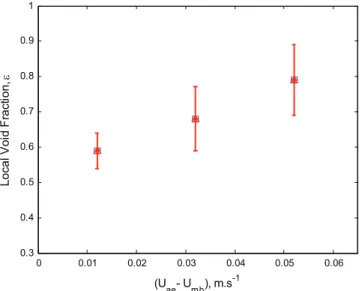
The influence of the aeration flow rate on the local void fraction above the aeration tap was evaluated, using the pressure drop over a section of the pipe to deduce the void fraction. Pressure sensors were placed along the transport tube (y¼ 100 and 300 mm).Fig. 6
gives the local void fraction calculated from Eq.(1). This equation expression is obtained by making a balance between the drag force and buoyancy by neglecting the fiction of the particle at the wall (Boissiere et al., 2015).
ε
¼ 1 # ∆Phydroð
ρ
p#ρ
gÞ∙g∙Lc ð1ÞAs expected, the void fraction in the tube increases with the aeration flow rate. Due to the short distance between the aeration tap and the disengaging zone in this apparatus the void fraction is barely affected by the height, and low effect of gas expansion is observed in this case due to the pressure loss.
3.2. Study of the particle trajectories using PEPT
Positron Emission Particle Tracking (PEPT) is a non-invasive technique which uses a single radioactive particle as a tracer within the fluidised bed (solar receiver tube). The tracer is either identical to or similar in properties to the particles found within the bed in order to avoid any difference in fluidisation properties
(similar approaches in other applications are given byParker et al. (1993);Garcia-Triñanes et al. (2014);Valdesueiro et al. (2015)). The tracer particle was treated with the isotope fluorine 18 (18F), which
emits positrons without any emission of gamma radiation. The single tracer was then mixed with other SiC particles and added to the DiFB. A Geiger counter was used to detect the particle as it entered the uplift transport tube and to check that the tracer particle was circulating. The tracer was then located by triangu-lation of gamma rays arising from the annihitriangu-lation of the emitted positrons, each location being calculated from ' 100 such gamma-ray pairs.
The PEPT tracking experiments were mostly carried out over a 1 m length of the tube starting from the top of the DiFB; the dis-tance from the lowest detection point to the distributor in the experiments reported here is 300 mm (so that the DiFB is below the field of view). The conditions reported here matched the highest solids flowrate reported in related work on a large scale pilot rig (Flamant et al., 2013), corresponding to a specific flow rate of 25 kg/m2
s and an aeration flowrate of 250 NL/h (Uae–
Umb¼ 0.052 m/s).
The raw PEPT data are in the form of a list of x, y, z, time tracer particle coordinates. Each location is accompanied by an attributed error, which is calculated from the set of gamma-rays giving rise to that location. Before the PEPT data can be used for further analysis, outlying gamma-ray pairs are eliminated in order to remove spurious data. An algorithm is available for doing this system-atically but some user intervention is possible in order to refine the selection, taking account of the experimental geometry, tracer activity level and experimental conditions such as typical tracer velocity. f is defined as the fraction of events remaining after removing the gamma-ray pairs which are furthest from the point which has the minimum perpendicular distance from all the tra-jectories. Using a higher value of f will increase the number of locations made per unit time, but if the f used is above the opti-mum these values will have a higher error.
For a set of N detected events, with a fraction f used to locate the tracer, the precision
Δ
of locating a stationary particle is given by:Δ
( wffiffiffiffiffiffif N
p ð2Þ
where w is the spatial resolution of the camera (Seville et al., 2009). It can be seen that the value of ∆ can be made arbitrarily small by making N sufficiently large. Over a long enough time scale (increasing N) a stationary particle can then be located arbitrarily well.
The processed data of a stationary particle has also been explained to show correlation with processed data from a moving particle therefore a stationary file was recorded and processed.
Fig. 7 shows that the combined standard deviation of x, y, z coordinates (3D) for this particular setup is almost constant at f values of 0.3–0.5 (30–50%) and N¼250. For this particular set of data the standard deviation of the error is measured as 0.59 mm and the mean error is 0.85 mm (3D). E represents the standard deviation of the error. This value remains fairly constant with an
'f ' value greater than 20.
Once the parameters of the algorithm are selected, the tracking of a tracer particle for an extended period of time in a closed, circulating system builds up an integrated picture of particle behaviour at each point in space and this allows the visualisation of the particle behaviour and reconstruction of maps of axial and radial movement, circulation times and pseudo-density (using the PEPT occupancy function). The mean interval between successive locations is approx. 20 ms with a very small increase over the duration of the experiment due to the decay of the tracer particle activity. In general the quality of data is extremely high and PEPT is
0 0.01 0.02 0.03 0.04 0.05 0.06 0.3 0.4 0.5 0.6 0.7 0.8 0.9 1 (Uae- Umb), m.s-1 L o c a l V o id F ra c ti o n , ε
working well within its capabilities as regards measurement of particle location, and hence velocity. Particle velocities are calcu-lated considering the “six point” method producing an estimate of the tracer velocity at every point of its path which reduces the error on the results (Stewart et al, 2001).
3.3. Flow structure and solids motion
The overall behaviour of the bulk material can be deduced from analysis of the tracer particle motion. This is applicable provided that the experiment covers a long enough time scale such that the tracer particle exhibits the full range of motion and visits all possible locations in the experimental apparatus a sufficient number of times.
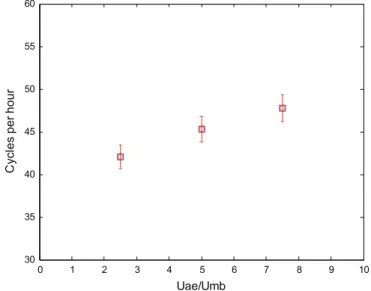
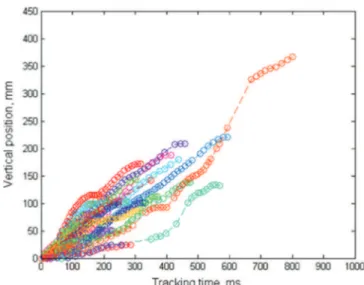
Examples of the excellent location accuracy are given in the following graphs.Fig. 8depicts the vertical coordinate in several different passes. The blanks between successive vertical passes correspond to the time interval spent by the tracer in the rest of the uplift transport tube and in the external recycle loop.Fig. 9
shows the increase in the number of cycles per hour as a function of the aeration rate, other conditions held constant. At each con-dition, the cycle frequency varies by less than 73%. Note that at
Uae¼ 0, no circulation occurs. The cycle time is dominated by the
period outside the transport tube, so that the effect of increased aeration is limited.
Fig. 10 shows a typical example of a tracer particle vertical trajectory where y is the vertical coordinate with respect to the centre of the PEPT camera and x, z are the horizontal coordinates. Vertical jumps are probably associated with particles that are carried by bubbles, as investigated in previous work on bubbling fluidised beds (Stein et al., 2000; Wong, 2006; Lam Cheun U, 2010).
Stein et al. (2000) showed that in bubbling beds, rapid and prolonged vertical movements are directly correlated with bubble rise velocity. Particles are picked up in the wakes of bubbles and rise a certain distance at the bubble velocity before falling out of the wake. They then experience a quiescent period (the “idle time”) before being picked up by another bubble, which may move them further up the tube.
In order to estimate the bubble velocities from the PEPT tra-jectories, “jump” velocities were obtained by selection of portions of trajectory satisfying criteria of sustained vertical movement.
Fig. 11shows the results, averaged over the column cross-section, as a function of vertical distance above the tube entrance. Note that the aeration point is at 250 mm above the bottom of the tube. Two different minimum distance criteria were used: the vertical
0 10 20 30 40 50 60 70 0 0.2 0.4 0.6 0.8 1 1.2 1.4 1.6 1.8 2
Value off parameter (% )
S ta n d ar d D ev iat io n ( m m ) X Y Z 3D E
Fig. 7. Combined standard deviation of x, y, z coordinates (3D) as a function of the f parameter.
Fig. 8. Vertical coordinate against time during several passes.
0 1 2 3 4 5 6 7 8 9 10 30 35 40 45 50 55 60 Uae/Umb C y c le s p e r ho u r
distance travelled by the particle must be at least 50 mm or 100 mm and the tracer particle must be moving upwards con-tinuously over that distance. The results show that the values obtained from PEPT data are in close agreement with predicted bubble rise velocities.
Fig. 12shows a set of twenty “jump” trajectories within the tube, showing the start of jump and the variation in behaviour and average velocity. The tracer comes down continuously close to the wall following a different mechanism.
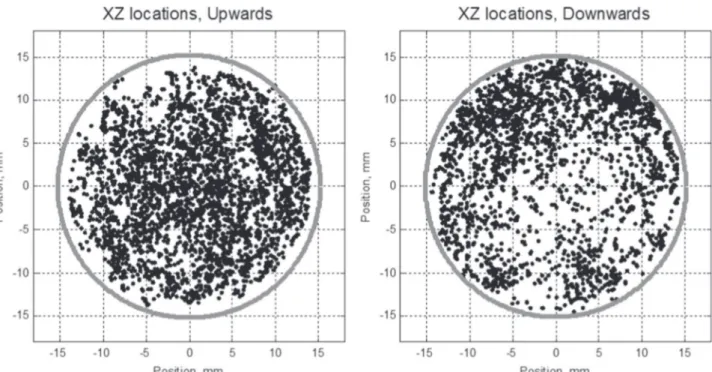
The general pattern of the bulk movement of solids is upward movement in the centre of the bed and downward movement at the walls, which is typical for fluidised beds as the bubble motion concentrates towards the centre (Seville et al, 1987).Fig. 13 illus-trates this effect by plotting the relative number of trajectories moving upwards and downwards as a function of radius, nor-malising for the areas of the annuli considered.
Fig. 14shows the same data plotted to show the locations of upward and downward trajectories in plan view.
Figs. 13and14are evidence of internal circulation in the tube, which favours heat transfer, enabling individual particles to interact with the wall and then move to the centre of the tube and exchange heat with fresh particles that are moving upwards.
3.4. Axial velocity profiles
Velocity calculations for PEPT data were performed using the standardised six-point method, introducing some smoothing (parti-cularly in chaotic/turbulent systems) but reducing the overall error.
Fig. 15 shows the distribution of the vertical component of the velocity (Vy) for trajectories passing through a region of interest in the
central part of the uplift transport tube above aeration (arbitrary height of 200 mm from the aeration point) using a normalised radius. Vertical components of the velocity vectors are averaged per bin. The error bars represent the standard deviation divided by the square root of the number of observations of the sample. Note that both positive and negative velocities are present at all radii. The mean values again demonstrate upwards motion in the centre of the uplift transport tube and downward motion near the walls.
3.5. Solids mixing and dispersion
Particle trajectories provided by the analysis of PEPT data can also be used to characterise solids mixing and calculate dispersion rates. The continuous trajectory can be cut up into many shorter
Fig. 11. Mean jump velocity of the tracer particle (Uae¼ 0.04 m/s).
Fig. 12. Examples of rapid upward vertical motion of the tracer particle (Uae¼ 0.04 m/s). 0 0.1 0.2 0.3 0.4 0.5 0.6 0.7 0.8 0.9 1 -4 -3 -2 -1 0 1 2 3 4 5 6 Normalised radius, r/R P e rc e n ta g e
Fig. 13. Number of trajectories over radius normalised by area for the region 200 mm above aeration- Uae¼ 0.04 m/s (Grey, rising trajectories- White, Falling trajectories).
trajectories, each having its origin in the same reference position (Martin et al., 2007). This is equivalent to tracing the path of many particles from the same location simultaneously (known as the principle of ergodicity). In order to achieve this, each point on a trajectory can be taken as a starting point and the tracer's sub-sequent displacement observed over time.
Fig. 16shows the average timing between six successive loca-tions, showing the expected near linearity.
If several trajectories start at the same point, the distribution of their end points at some specified later time can be obtained. The width of the distribution of their displacements from the starting point is conveniently expressed as mean of mean displacement squared (disp–dispmean)2illustrated inFig. 17.
A diffusive model of axial dispersion would predict that the mean value of (displacement)2increases linearly with time and is
proportional to the axial dispersion coefficient, D given by:
x2
dð Þ ¼ 2Dtt ð3Þ
where xd(t) is the axial distance moved by the tracer from the
starting location after time t and x2
d(t) represents the mean
squared axial displacement of the tracer after time t.
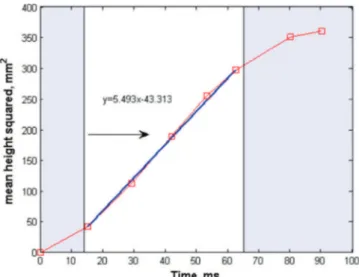
Fig. 18shows the change in variance of vertical displacement of the tracer particle with time after it crosses the reference line (used as the starting location of the particle). The linear, middle part of the graph which shows the max gradient usually with an R value of at least 0.99 is used to calculate the dispersion coefficient. The data indeed shows behaviour which closely approximates to the expected linear relationship. The corresponding dispersion coefficients are shown for various operating conditions inFig. 19.
Fig. 14. Locations according to the direction of particle movement considering a section between y¼100 mm and 300 mm (Uae¼ 0.04 m/s).
0 0.1 0.2 0.3 0.4 0.5 0.6 0.7 0.8 0.9 1 -0.1 -0.05 0 0.05 0.1 0.15 0.2 0.25 Normalised radius v y , m /s
Fig. 15. Average and distribution of vertical velocity with radial position con-sidering a section between y¼ 100 mm and 300 mm (Uae¼ 0.04 m/s).
0 1 2 3 4 5 6 0 10 20 30 40 50 60 70 80 90 Dispersion point m e a n t im e , m s
The dispersion coefficient was calculated from a continuous trajectory of one particle, considering different reference planes above the aeration level. The path of the tracer particle was tracked from the time at which it crossed the fixed reference.
As expected, the dispersion of the tracer increases with vertical position above the aeration point. The magnitude of the axial dispersion coefficient appears to be higher in this system than the values reported in the literature using PEPT as particle tracking method for bubbling fluidised beds. In an early study using fer-romagnetic particles,Avidan and Yerushalmi (1985)reported that the axial dispersion coefficient calculated using the countercurrent flow model increased with gas velocity. Mostoufi and Chaouki (2001) showed that the superficial gas velocity and the axial velocity gradient have a significant effect on the solid diffusivity.
Lam Cheun U (2010)using PEPT reported a maximum value of 0.005 m2
/s at different superficial gas velocities. The calculation of
the axial solids dispersion coefficient has also been addressed by
Zhang (2009) using a steady-state gas tracer. It is worth noting that these values are considerably affected by the superficial gas velocity.Table 3displays the list of reported dispersion coefficients in various systems by different authors.
3.6. Vertical solid mass flux in the tube
The axial flux (vertical component) kg/m2s was calculated using a new approach that takes into account the number of times that the tracer crosses an arbitrary boundary in the desired direction (nupor
ndwn), the mass of the particles, the area of the boundary considered
and the sampling time. Radial profiles of vertical solid mass flux (kg/m2s) were obtained using Eqs.(4)and(5)at a reference height of 200 mm taking into account the total mass of particles circulating (Mpart), the sampling time (tsampling) and Anrepresenting the cross
sectional area of the radial element considered (m2):
Gup¼ Mpart∙nup An∙tsampling ð4Þ Gdwn¼ Mpart∙ndwn An∙tsampling ð5Þ
Fig. 20presents radial profiles above the aeration level of solids mass flux (upward and downward) for the reference aeration velocity (0.04 m/s), again showing higher upward mass flux in the core region of the uplift transport tube.
In order to calculate the net solid flux considering annuli of equal area, the number of times that the tracer appears in the zone (height of interest and radius of interest) for each track is com-puted considering the vertical crossing of boundaries and the direction vector for upwards and downwards trajectories through the volume elements taking into account the total sampling time. The result of integrating over the whole cross-section gives the net up and down flux and it can be found inFig. 21.
Inspection of this graph confirms that there is net upflux over the whole cross-section and downflux near the wall.
0 10 20 30 40 50 60 70 80 90 0 100 200 300 400 500 600 700 mean time, ms m e a n d is p la c e m e n t s q u a re d , m m 2
Fig. 17. Mean displacement squared against time for all the tracks of a set of experiments.
Fig. 18. Mean displacement squared against time after the particle crosses the reference plane which is 200 mm above the aeration inlet (Uae¼ 0.04 m/s).
0 50 100 150 200 250 300 3 3.5 4 4.5 5 5.5 6 6.5 7x 10 -3
Distance above aeration, mm
D is p e rs io n c o e ff ic ie n t, m 2 /s Uae/Umb=7.5 Uae/Umb=5 Uae/Umb=2.5
Fig. 19. Variation of the axial dispersion coefficient with height at different aera-tion velocities.
4. Conclusions
A new pilot plant has been set up in continuous operation to provide a complete understanding of the hydrodynamics and par-ticle motion in upward flowing dense parpar-ticle suspensions. This small scale circulating apparatus with upward dense flow uses an eductor and simulates the flow in a single solar collector tube.
Positron emission particle tracking (PEPT) has been demon-strated to be a technique that can reveal detailed and relevant information about the particle circulation within the uplift trans-port tube. Under the operating conditions retrans-ported here the flow in the transport tube is upwards in the centre and downwards at the wall. This was particularly noticeable in a region situated 200 mm above aeration when using Uae¼ 0.04 m/s since the
upwards trajectories represented 70% of the total.
Analysis of the PEPT data provides valuable information on the particle trajectories, axial velocity profiles, void fraction (25–40%), vertical solid mass flux (25 kg/m2
s) and dispersion coefficients. The calculated axial dispersion coefficients are in the range reported by other earlier studies working with higher velocity systems.
Future experiments will investigate how the results of this study help to provide experimental evidence of how the radial movement of particles controls the suspension effective thermal conductivity, thus the heat transfer from the wall to the dense suspension of particles.
Nomenclature
PEPT Positron Emission Particle Tracking
18F Fluorine-18 radioisotope
UBFB Upflow Bubbling Fluid Bed DiFB Dispenser Fluidised Bed
λ
Thermal conductivity, W/mKCp Specific heat capacity of the solid, kJ/kgK
Tmelt Melting point of solid, K
Tmax Solid sintering temperature, K
Δ
Pbed Bed hydrostatic pressureUg Superficial gas velocity, m/s
Umf Minimum fluidisation velocity, m/s
Umb Minimum bubbling velocity, m/s
Uae Aeration superficial gas velocity, m/s
Uae/Umb Aeration velocity/bubbling velocity m/s
ε
Void Local void fraction∆Phydro Hydrostatic gas pressure drop, mbar
Lc Tube measurement length, m
Ac Cross sectional area of the tube, m2
ε
mf Void fraction at minimum fluidisationε
mb Void fraction at minimum bubblingρ
p Solid particle density, kg/m3dp Average Solid particle diameter, mm
Qf Fluidisation flow rate, Nm3/h
Fp Solids feeding flow rate, kg/h
Qae Aeration flow rate, Nm3/h
Qbt Air flowrate exchanged between the dispenser bed and
the tubes, Nm3/h
D Axial dispersion coefficient, m2/s
Pfb Pressure of the dispenser bed freeboard, mbar
N Number of events
Table 3
Dispersion coefficients in various systems by different authors.
Particle Average particle size (μm) System Authors D (m2 /s) FCC 49 BFB/Ferromagnetic tracer Avidan and Yerushalmi (1985) 0.075–0.15 FCC 70 BFBa/RTPb Mostoufi and Chaouki (2001) 0.001–0.06
FCC 78 FFBc/Gas tracer Zhang et al (2009) 0.01–0.12
Al2O3 48 BFB/PEPT Lam Cheun U (2010) 0.001–0.005
SiC 64 UBFBd/PEPT This work 0.003–0.007
aBFB Bubbling fluidised bed. bRTP Radioactive particle tracking. cFFB Baffle-free fluidised bed. dUpflow Bubbling Fluid Bed.
0 0.1 0.2 0.3 0.4 0.5 0.6 0.7 0.8 0.9 1 -150 -100 -50 0 50 100 150 200 250 Normalised Radius, r/R
Solid mass flux (kg/m
2.s)
Upwards Downwards
Fig. 20. Radial profile of the upward and downward solids mass flux at a reference height of 200 mm (Uae¼ 0.04 m/s). 0 0.1 0.2 0.3 0.4 0.5 0.6 0.7 0.8 0.9 1 -100 -50 0 50 100 150 S o li d s F lu x ( k g /m 2 .s ) Normalised Radius, r/R Specific flow rate ~ 25 kg/m2.s
Fig. 21. Solids flux considering cylinders of equal area considering a section between y¼ 100 mm and 300 mm (Uae¼ 0.04 m/s).
w Spatial resolution of the camera
Δ
Precision of locating a stationary particlef Fraction of events used to locate the tracer
Gup Upwards solid flux, kg/m2s
Gdwn Downwards solid flux, kg/m2s
nup Number of events crossing the section (with positive
velocity)
ndwn Number of events crossing the section (with negative
velocity)
Mpart Total mass of particles circulating, kg
Acknowledgements
This work was developed in the frame of the CSP2 Project -Concentrated Solar Power in Particles. This project has received funding from the European Union's Seventh Programme for research, technological development and demonstration under Grant agreement no 282 932. The authors would like to thank Strata Technology Ltd. for their assistance in the design and manufacturing of the GU1 mock up.
References
Avidan, A., Yerushalmi, J., 1985. Solids mixing in an expanded top fluid bed. AlChE J. 31 (5), 835–841.
Botterill, J.S.M., 1975. Fluid-bed Heat Transfer. Gas Fluidized Bed Behaviour and its Influence on Bed Thermal Properties. Academic Press, New York.
Boissiere, B., Ansart, R., Gauthier, D., Flamant, G., Hemati, M., 2015. Experimental hydrodynamic study of gas-particle dense suspension upward flow for appli-cation as new heat transfer and storage fluid. Can. J. Chem. Eng. 93 (2), 317–330. Bi, H.T., Grace, J.R., 1995. Flow regime diagrams for gas-solid fluidization and
upward transport. Int. J. Multiph. Flow 21 (6), 1229–1236.
Flamant, G., Hemati, M., French Patent No. 1058565, 20 October 2010. PCT exten-sion, 26 April 2012, No. WO 2012/052661 A2,https://patentscope.wipo.int/ search/en/detail.jsf?docId=WO2012052661.
Flamant, G., Fatah, N., Filtris, Y., 1992. Wall-to-bed heat transfer in gas-solid flui-dized beds: prediction of heat transfer regimes. Powder Technol. 69 (3), 223–230.
Flamant, G., Gauthier, D., Benoit, H., Sans, J.L., Garcia, R., Boissière, B., Ansart, R., Hemati, M., 2013. Dense suspension of solid particles as a new heat transfer fluid for concentrated solar thermal plants: on-sun proof of concept. Chem. Eng. Sci. 102, 567–576.
Flamant, G., Gauthier, D., Benoit, H., Sans, J.-L., Boissière, B., Ansart, R., Hemati, M., 2014. A new heat transfer fluid for concentrating solar systems: particle flow in tubes. Energy Proc. 49, 617–626.
Garcia-Triñanes P., Valdesueiro D., Seville J.P.K., Meesters G.M.H., Kreutzer M.T., van Ommen J.R. Gargiuli J., 2014. Enhancing the activation of silicon carbide particles with gas-phase coating of aluminium oxide. In: Proceedings of the 7th World Congress on Particle Technology, Beijing, China.
Lam Cheun U, You Van, 2010. Solids Motion in Fluidised Beds of Fine Particles. University of Birminghamhttp://etheses.bham.ac.uk/809/1/LamCheunU10PhD. pdf.
Martin, T.W., Seville, J.P.K., Parker, D.J., 2007. A general method for quantifying dispersion in multiscale systems using trajectory analysis. Chem. Eng. Sci. 62 (13), 3419–3428.
Mostoufi, N., Chaouki, J., 2001. Local solid mixing in gas–solid fluidized beds. Powder Technol. 114, 23–31.
Parker, D.J., Broadbent, C.J., Fowles, P., Hawkesworth, M.R., McNeil, P.A., 1993. Positron emission particle tracking—a technique for studying flow within engineering equipment. Nucl. Instrum. Methods Phys. Res. Sect. A 326 (3), 592–607.
Seville, J.P.K., Ingram, A., Fan, X., Parker, D.J., 2009. Positron emission imaging in chemical engineering. In: Li, Jinghai (Ed.), Advances in Chemical Engineering, Vol. 37. Academic Press, pp. 149–178.
Stewart, R.L., Bridgwater, J., Zhou, Y.C., Yu, A.B., 2001. Simulated and measured flow of granules in a bladed mixer—a detailed comparison. Chem. Eng. Sci. 56 (19), 5457–5471.
Seville, J., Tüzün, U., Clift, R., 1987. Processing of particulate solids. Series: Particle Technology Series. Vol. 9. Springer.
Stein, M., Ding, Y.L., Seville, J.P.K., Parker, D.J., 2000. Solids motion in bubbling gas fluidised beds. Chem. Eng. Sci. 55 (22), 5291–5300.
Valdesueiro, D., Garcia-Triñanes, P., Meesters, G.M.H., Kreutzer, M.T., Gargiuli, J., Leadbeater, T.W., Parker, D.J., Seville, J.P.K., van Ommen, J.R., 2016. Enhancing the activation of silicon carbide tracer particles for PEPT applications using gas-phase deposition of alumina at room temperature and atmospheric pressure, Nuclear Instruments and Methods in Physics Research Section A: Accelerators, Spectrometers. Detectors and Associated Equipment 807, 108–113.http://dx. doi.org/10.1016/j.nima.2015.10.111.
Wong, Y.S., 2006. Particle motion in relatively thin fluidised bed models. Chem. Eng. Sci. 61 (18), 6234–6238.
Zhang, Y., Lu, C., Shi, M., 2009. Evaluating solids dispersion in fluidized beds of fine particles be gas backmixing experiments. Chem. Eng. Res. Des. 87, 1400–1408.