Publisher’s version / Version de l'éditeur:
Vous avez des questions? Nous pouvons vous aider. Pour communiquer directement avec un auteur, consultez la première page de la revue dans laquelle son article a été publié afin de trouver ses coordonnées. Si vous n’arrivez pas à les repérer, communiquez avec nous à PublicationsArchive-ArchivesPublications@nrc-cnrc.gc.ca.
Questions? Contact the NRC Publications Archive team at
PublicationsArchive-ArchivesPublications@nrc-cnrc.gc.ca. If you wish to email the authors directly, please see the first page of the publication for their contact information.
https://publications-cnrc.canada.ca/fra/droits
L’accès à ce site Web et l’utilisation de son contenu sont assujettis aux conditions présentées dans le site LISEZ CES CONDITIONS ATTENTIVEMENT AVANT D’UTILISER CE SITE WEB.
Internal Report (National Research Council of Canada. Institute for Research in
Construction), 1995-06
READ THESE TERMS AND CONDITIONS CAREFULLY BEFORE USING THIS WEBSITE.
https://nrc-publications.canada.ca/eng/copyright
NRC Publications Archive Record / Notice des Archives des publications du CNRC :
https://nrc-publications.canada.ca/eng/view/object/?id=077c0b77-2fd7-4219-a189-25df18768385 https://publications-cnrc.canada.ca/fra/voir/objet/?id=077c0b77-2fd7-4219-a189-25df18768385
NRC Publications Archive
Archives des publications du CNRC
For the publisher’s version, please access the DOI link below./ Pour consulter la version de l’éditeur, utilisez le lien DOI ci-dessous.
https://doi.org/10.4224/20375572
Access and use of this website and the material on it are subject to the Terms and Conditions set forth at
Procedures to Predict Long-Term Thermal Performance of Boardstock
Foam Insulations: Supplementary Report on Expanded Polystyrene
Bomberg, M. T.; Kumaran, M. K.
'TET
National Research Conseil national 1 R 4 2 71
Council Canada de recherches CanadaBLDG C Q P . 2
n a .
6 9 4J u n e
Institute tor lnstitut de
Research in recherche en
Construction construction
Procedures to predict long-term
thermal perforkance of boardstock
foam insulations
Supplementary report on expanded
polystyrene
by Dr. Mark Bornberg and Dr. Mavinkal Kurnaran
C I S T I / I C I S T NRC/CNKC
I R C
S e r
Internal Report No.
694
Date of issue: June
1995
R e c e i v e d
o n :
05-01-98I n t e r n a l r e p o r t .
r e p o r t ( T n s t i t u t e
fThis internal report, while not intended for general distribution, may be cited or referenced in other publications.
National Research Council of
Canada
Institute for Research in Construction
Building Performance Laboratory
FINAL REPORTS ON THE JOINT NRC I SPI RESEARCH PROJECT:
PROCEDURES TO PREDICT LONG-TERM THERMAL PERFORMANCE OF
BOARDSTOCK FOAM INSULATIONS
AND
SUPPLEMENTARY REPORT ON EXPANDED POLYSTYRENE
Mark Bomberg and Mavinkal Kumaran
TABLE OF CONTENT
PROCEDURES TO PREDICT LONG-TERM THERMAL PERFORMANCE OF BOARDSTOCK FOAM INSULATIONS
PART I. THE ISSUES
1. Introduction
2. Objectives and scope of SPI 1 NRC projects 3. Proposed methodology for LTTP evaluation 3.1. The concept of integrated mett-odology 3.2. The reference period for LTTP
3.3. The effect of environmental factors on aging rate
PART 11. USE OF THE SCALING TECHNIOUE
4. Application of a scaling technique for predicting LTTP of a modified resol foam. 4.1. Materials and methods
4.2. Aging full boards under enviromental exposures
4.3. Predicting long-term thermal resistance with the scaling technique 4.4. Comparison of predicted and measured full board thermal resistance
5. Discussion on use of the scaling technique
PART 111. USE OF DlPAC MODEL FOR BOARDSTOCK FOAMS
6. Materials and procedures 7. The DlPAC model of aging
8. Input material characteristics for DlPAC model 8.1. Density distribution in the cross-section
8.2. Specific mass extinction coefficient for 1R radiation 8.3. Effective diffusion coefficient of nitrogen and oxygen
8.4. Solid phase conduction with image analysis characterization of cells 8.5. BA solubility as a function of time and temperature
8.6. BA concentration
8.7. Effective diffusion coefficient of BA (determined with help of DlPAC model) 9. A method to measure thermal resistaice in situ
10. Application of the DlPAC model
10.1. A method to measure thermal resistance in sttu
10.2. Comparison of measured and calculated thermal resistance
10.2.1. Thermal resistance of extruded polystyrene as a function of time 10.2.2. Thermal resistance of polyisocyanurate as a function of time
10.2.3. Thermal resistance of phenolic / modified resole foams as a function of time 11. Discussion on use of the DIPAC model
11.1 Verification of invariable component of heat transfer
11.2 Verification of cell-gas composttion at a given stage of aging 12. Concluding remarks
13. Future research
APPENDIX A.: APPLICATION OF THE DlPAC MODEL TO DATA GENERATED AT DOW CHEMICAL NA ON THE
XPS PRODUCT AJ890823, Mark Bomberg and John Minsker
SUPPLEMENTARY REPORT ON THE EXPANDED POLYSNRENE
1. Introduction
2. Materials and conditions of their exposure 3. Results and discussion
3.1. Laboratory measurements of thermal resistance and dimensional stability 3.2. Measurements of water vapour transmission
3.3. Measurements of compressive and flexural strength
3.4. Comparative measurements of EPS thermal resistance under field conditions 4. Conclusions
APPENDIX 8. COMMENTS ON USE OF MECHANICAL TESTING FOR MATERIAL CHARACTERIZATION OF
ACKNOWLEDGMENTS
The authors express deep gratitude to the Research Steering Committee of the SPllNRC project: John Zacharias (chairman of the Steering Committee) Celfortec. Quebec
John Minsker, Dow Chemical North America, Ohio Gary Chu, Dow Chemical N. A.. Ontario
Patrick Rynd, UCI, Ohio Keith Wilson, OCC, Ontario
Andre St. Michel, BASF Canada Inc., Quebec Marion Axmith, SPI, Ontario.
Other participants during this research project were:
Steve Belej, BASF Canada Inc., Ontario, (past chairman and initiator of the SPF project) Dr. Robert Booth. Hansed I Booth (representing Techi-Therm)
Dr. Michel Drouin. Excel-Therm; Ontario Barbara Fabian, UCI. Ohio
Richard Grunvald and Richard Hargreaves. Jim Walter International, Ontario Martin Hofton, Celfortec. Quebec
Nigel Ravenscroft, Dow Chemical NA. Ohio Frank Tyler, Owens Corning. Ohio.
To derive statistically valid conclusions numerous results are needed, particularly when several types of plastic foam products are examined. A vast number of measurements demanded a very well organized and concentrated effort from two dedicated people. We appreciate in that regard the effort from Mr. John Lackey and Mme. Nicole Normandin at the NRCC.
We would also like to acknowledge the exchange of research results and many hours of technical discussions with Dr. J. Richard Booth, formerly Granville RBD Center of Dow Chemical N.A., Ohio. Prof. David W. Yarbrough. Tennessee Technological University, and Dr. Jan Isberg. Chalmers Technical University, Gothenburg, Sweden.
GLOSSARY OF ABBREVIATIONS
I
DlPACI
distributed parameter continuum (denotes here a specific model) Abbrev.B A CFC
CR
I
EPSI
expanded polystyrene (also called molded expanded polystyrene) Meaningblowing agent (denotes here a captive blowing agent) chlorofluorocarbon
conventional roof (an exposure used to simulate built-up roof)
I
EPDMI
ethylene-propylene-diene monomer GFI glass fibre insulationI
HCFCI
hydrochlorofluorocarbonLTTP long-term thermal performance (here long-term thermal resistance)
I
NlST/
National Institute for Standards and Technology (formerly NBS)HFM HFC IR I A
National Research Council of Canada phenolic foam
heat flow meter (here an apparatus for laboratory R-value test) heat flow comparator (here a technique to measure heat flux) infra red
image analysis (a technique used to characterize foam morphology)
relative humidity
I
I/
The Society of Plastics Industry of Canada PIRPMR PUR
I
SPI Inc.1
The Society of Plastics lndustry in the United States of America polyisocyanurateprotected membrane roof (an exposure used to simulate PMR) polyurethane
sprayed polyurethane foam
extruded polystyrene (also called extruded expanded polystyrene)
1
TDSLI
thickness of destroyed surface layer (denotes here an equivalentPROCEDURES TO PREDICT LONG-TERM THERMAL PERFORMANCE
OF
1.
Introduction
Since 1988, the National Research Council (NRC) of Canada, in collaboration with of the North- American foam industry, has been developing an integrated methodology for the evaluation of long-term thermal performance (LTTP) of foam plastics. This collaboration included two research projects performed jointly by the Society of Plastics Industry and the NRC Canada, that focused on foams manufactured with alternative blowing agents (BAS). The first project (Harris 1989) dealt mainly with the sprayed polyurethane foam (SPF); the second, with boardstock foams. In addition to these projects, research performed by NRC under separate contracts with Du Pont Canada or Owens Corning Canada was also published (Ascough, 1989,1990: Kurnaran eta/.
1989; Bomberg 1993; Bomberg eta/. 1991, 1994) thereby complementing the SPllNRC work.
The objective of the SPI I NRC projects was to develop a short-term laboratory procedure
whereby the long-term, field thermal performance of polyurethane (PUR), polyisocyanurate (PIR), phenolic (PhR) and extruded polystyrene (XPS) foam boards manufactured with any BA can be predicted. Such a laboratory procedure would greatly reduce the time and cost of developing new foam products.
This report deals only with the boardstock foams. It summarizes the key findings of the project and refers to other publications issued during the course of work. Research on sprayed
polyurethane foam has already been presented in two reports: "Report on sprayed polyurethane foam with alternative BAS" published by the Polyurethane Division of the Society of Plastics Industry lnc. in 1989 and "Report on factors affecting the field performance of spray applied thermal insulating foams" published in 1993 by the Polyurethane Foam Contractors Division of the SPI Inc.
This project verified the use of a distributed parameter continuum (DIPAC) model for boardstock roofing insulations. Outside test structures were constructed at the NRC site in Ottawa and samples of different foam products, exposed to the prevailing environment for 2% years, were periodically removed to measure their thermal resistance under laboratory conditions.
Furthermore, a number of samples had their thermal resistance continuously monitored under the field conditions.
An expanded polystyrene (EPS) foam was also included in the boardstock research project for the sake of R-value comparison, since this type of the foam is known for stable thermal resistance. This foam was also used to examine whether testing of specified mechanical and physical properties can be used for characterizing the cellular structure of the tested foam batch. While nobody questions the need for characterization of the foam (More 1992; Boscolo
Boscoletto and Cellarosi 1992), opinions are divided over how to do it. Two particular
techniques, namely the image analysis and the selected mechanical properties were examined in detail. Since EPS samples can be manufactured without density gradients, that are often present in some boardstock foams, and the SPIINRC project was focused solely on the development of test methods, selecting EPS forthis purpose was justified. The information from these
investigations are separately documented in the supplementary report.
2. Objectives and scope of SPVNRC projects
The objective was to develop a procedure for determining long-term thermal performance (LTTP) of either preformed (boardstock) or field-fabricated (spray foam) thermal insulation and to validate this procedure by comparing the predicted results with those measured on samples exposed to laboratory and field conditions. The materials selected for this project may or may not represent commercially manufactured foam products. Therefore, the SPllNRC Research Steering
Committee decided to ensure that all important types of polymers were represented in the study,
SO that when the evaluation methodology is developed, it will be applicable for any combination of BAS and polymers.
This procedure should, during a period of 6 months or less, predict an average thermal resistance over a sewice life. To determine the value of thermal resistance integrated over the selected service life, one must combine testing with an application of a calculational procedure. Either one of two calculational procedures discussed in this report can be used. When unfaced foam is homogenous enough to permit a simple arithmetic operation, known as the scaling technique, it can be used to calculate foam-aging for layers of different thickness. When, however, the cellular structures of skin and core layers differ significantly, or if the foam is protected with impermeable facers, then the use of the scaling technique is not appropriate and the heat and mass transfer processes must be described by a model (the so-called "aging model").
An extrapolative aging model, the DlPAC model, was the subject of the boardstoclc research project. The basic material characteristics, needed as the input for the model, are determined either directly, i.e., from measurements of cell-gas concentration, and oxygen and nitrogen
diffusivity; or indirectly, i.e., from measurements of the changes in thermal resistance of the thin surface and core layers. The precision of calculations from the model depends on the precision of measurements performed to derive these material characteristics. Therefore, a significant part of this research was aimed at improving the techniques used for measuring such material
characteristics as oxygen or nitrogen diffusivities, extinction of radiative heat transfer or BA solubility in the polymer.
To verify the prediction derived from the DlPAC model, samples of different foam products were placed in the outdoor exposure facility for a period of 2% years. During this period, these samples were periodically removed to measure their thermal resistance under laboratory conditions. Furthermore, the thermal resistance of these products was continuously monitored under the field conditions as well.
Generally speaking, to develop a methodology for LTTP evaluation that would be applicable to all thermal insulating foams, independent of their service conditions, polymer composition or BA(s) used, one must recognize the following aspects of the evaluation:
1. A systematic variation of physical properties of the industrially manufactured cellular plastics (Shemlan 1980; Bomberg 1980; Andrews 1984). Because of this variation (batch and board variability), characteristics determined on a small specimen may not represent the product. This aspect of the LTTP evaluation highlights the need for material characterization, (Rhodes 1991) and uncertainty in the measurement of material characteristics used in the model. It is implied that the validity of material characteristics must address during the sampling process.
2. A systematic difference in material characteristics measured on the samples from surface and core layers of the foam (Low 1989; Bomberg and Brandreth 1990). Because of this cross-section variability, characteristics determined for the material core may not represent that of the entire product. This aspect of the LTTP evaluation underlines that this uncertainty may be even higher, if the input characteristics do not represent the surface layers. (Surfaces may control the aging rate of the actual product.)
3. A possible effect of environmental factors on the aging process (particularly temperature, temperature differential and humidity) (Levy 1966; Bomberg and Kumaran 1991; Zarr and Nguyen 1994). Because of these effects, thermal performance measured under isothermal conditions may not represent the actual field performance of the foam.
This aspect emphasizes that environmental factors may further increase the difference between the thermal performance predicted by the model and that measured under field conditions.
The last aspect of evaluation poses two challenges common for all thermal insulating materials. (Bomberg and Kumaran 1993). One challenge is to understand the processes that affect the field performance of the insulation, such as settlement of loose fills, aging of gas-filled foams, the effect of convective air flow on fibrous insulation or the effect of moisture on thermal
performance. The second challenge is to develop evaluation methods that simulate the conditions of field performance for these insulations.
These challenges have not been fully appreciated in North America, where material specifications are developed mainly for comparing different commercial products. Typically, material standards and specifications require thermal resistance to be tested at a 24'C mean temperature, using dry and fresh specimens. On the other hand, the European Union aims to resolve the discrepancy between field and laboratory performance of building materials by introducing concepts of the "declared" and "design" thermal properties (Document 1990; I S 0 1991).
*
The declared value, which is stated with a given confidence level, is the expected value of the thermal characteristic of a building material or product assessed through data measured at a reference temperature and thickness. The design value, however, is a value of the thermal characteristic of a building material or product in conditions representing typical installation, climate and use.
The European approach has been implemented by the SPIINRC project (Bomberg 1993: Bomberg and Kumaran 1994). The average initial R-value of the thermal insulation (a declared initial thermal performance) is determined first. Then, the aging, i.e.. the effect of time on thermal resistance of the product, is established . Finally, the effects of selected environmental factors on aging of the foam product are considered.
The standard predictive procedure, when validated and generally agreed upon, will be used instead of the field testing. However, the effects of environmental conditions (temperature and moisture) on the integrity of the cellular structure (Nguyen eta/. 1993; Zarr and Nguyen 1994) and other physical propelties are currently not known. Furthermore, foam products are constantly evolving. For these reasons, the SPIINRC team agreed on a set of arbitrary
environmental conditions to see whether the specific polymer foam would be significantly affected. (The selected conditions were similar to those recommended by ASTM 02126 for exposure on one surface of the specimen, leaving the other surface at the room conditions.) While these laboratory conditions do not represent field conditions, they may provide information about the relative significance of environmental effects for the specific polymeric foam structure.
3. Proposed methodology for LTTP evaluation
To evaluate long-term thermal performance of cellular plastics, the aging process must be accelerated. This can be done either through elevated temperature or by reducing the thickness of tested foam layers (the so-called "slicing" or "thin-layer" approach). When two or more BAS are used, the first approach changes the permeability and solubility coefficients of different gases so much that foam performance measured under elevated temperature may be too difficult to correlate with the actual performance of the material under setvice conditions. Hence, only the thin-layer approach is used in the SPllNRC projects.
3.1. The concept of integrated methodology
The need for integration of testing methodology was introduced at an early stage of this research (Bomberg and Brandreth 1990), and evaluated during the sprayed polyurethane foam research (Bomberg and Kumaran 1991). This report presents only the experience obtained during the application of the integrated methodology to the boardstock foams.
Predicting L l T P of foams involves three aspects of performance:
1) the initial thermal resistance of the foam product,
2) effect of time on thermal resistance of the foam (aging factor), and
3) effect of environmental factors on the rate of the aging process.
The initial thermal resistance of the foam product is defined by the mean value and standard deviation of thermal resistivity (inverse of thermal conductivity) measured on full thickness boards. In the SPI lNRC projects, a minimum of three specimens sampled from each of three different production batches, i.e., total of nine specimens were used to determine initial thermal resistance of the foam product.
The LTTP evaluation methodology includes measurements of thermal resistivity as a function of time on thin layers cut from the surface and core of the foam. Then, depending on the foam
uniformity, aging of thin layers is related to aging of full boards either by means of the scaling technique (Kumaran and Bomberg 1990) or by using aging models (Bomberg 1988). When unfaced foam is homogenous enough to permit a simple arithmetic operation known as the scaling technique, the technique can be used to calculate foam aging for layers with different thicknesses. When, however, the cell structure of skin and core layers is significantly different, or the foam is provided with facers, then the scaling technique is not appropriate and aging models (models of heat and mass transfer) must be used.
In the next stage of the LTTP evaluation process, one must ensure that the aging under laboratory conditions is similar to that under normal conditions of service. In this respect, one must determine whether the effects of environmental factors, such as thermal gradient either alone or in conjunction with the humidity gradient or with a freeze-thaw cycling, affect the structural integrity of the polymer matrix.
The effect of environmental factors on the aging rate is evaluated by thermal testing performed at the end of a cycle that contains a period of exposure followed by a recovery period in control conditions. [Of course, changing the temperature of exposure or forcing moisture into the test specimen affects the measured thermal resistivity (Bomberg et a/. 1990); such a change,
however, is not a subject of this inquiry]. At the end of the recovery period, the thermal resistivity of the exposed specimens is compared to that obtained in the reference exposure. In doing so. the reduction of thermal resistance caused by the presence of moisture or a change in BA equilibrium conditions is disregarded and only a net effect of the environmental exposure is measured.
3.2. The reference time for LITP evaluation
Design life is defined by the I S 0 task group as "the time interval during which an installed material, product or system should substantially maintain its design performance" (IS0 1991). This definition is frequently misunderstood by assuming that any product should maintain its initial performance throughout its service life. When a manufacturer claims a certain level of the
product performance (accounting for weathering, aging or other time-dependent processes), this manufacturer establishes the design performance level. It is therefore important for the SPIINRC project to establish a reference time to which this "design performance level" should be related.
An analysis performed by Di Lenardo and Bomberg (1995), confirmed an opinion previously expressed by a group of experts in the position paper of the Canadian General Standards Board, (Kabayama 1987). The appropriate reference time for
LTTP
evaluation is 5 years. Thus, the actual thermal resistance of the foamboard at 1825 2 25 days of aging is called the design thermal resistance of the foamboard.3.3 The effect of environmental factors o n aging rate
The exposure and the recovery periods are designed so that the whole test can be completed in
6 months. Periodic measurements of thermal resistance were performed on thin specimens 300 by 300 mm (12"x12") exposed to environmental conditions, such as a thermal gradient either alone or in conjunction with humidity gradient or freezing conditions. This test procedure creates a non-destructive means for evaluating the effects of environmental factors on the thermal performance of foams.
The following exposure conditions were used:
a) Isothermal exoosure. This is the standard exposure at room temperature (humidity between 30 and 50
%RH).
This exposure lasts for a minimum 180 days and includes periodic monitoring of thermal resistivity. The isothermal exposure is considered to be the control exposure.b) Drv-cube exDosur?. The specimens are placed in the sides of a cube dividing two
environments. Controlled room conditions are outside the cube, while ambient air humidity and temperature of 70°C are maintained inside the cube. The dry-cube exposure lasted for 9 0 2 5 days and was followed by an equal period under laboratory conditions, so that both the exposure and recovery intervals were completed in 180 days. This exposure includes periodic monitoring of thermal resistivity.
c) Wet-cube exDosure. The objective of this exposure is to examine the effect on thermal gradient in the presence of moisture. Test conditions are identical to those in the dry-cube, except that the humidity inside the cube is maintained above 95 percent. This exposure lasted for period of 42 2 2 days and was followed by a period of exposure in the laboratory, which included monitoring of thermal resistivity.
d) Freezenhaw cvclino after 7 davs of wet-cube exoosure. The specimens are placed between the laboratory environment and a freezer. Every 6 hour the temperature in the freezer is cycled between freezing at -20+ 2°C and thawing at 8
+
3 "C (ambient air humidity). This exposure relates to the effect of thermal gradient in the presence of water vapour diffusion towards a freezing zone. This exposure lasted for 90+
4 days and was followed by 90+
4 days period of laboratory exposure with periodic monitoring of thermal resistivity.To accept the proposed LTTP methodology instead of the field evaluation, one may require that after the required evaluation sequence, none of the exposed specimens has a thermal resistivity lower than 9Cpercent of the reference value obtained from the control exposure. The 94 percent limit is defined by two standard deviations of the average uncertainty in the ASTM C 518 test method, providing that the testing laboratory is accredited either by the Standards Council of Canada or the National Voluntary Laboratory Accreditation Program of NIST. Furthermore the same HFM apparatus and the same operator must be used for the whole series of tests.
Generally speaking, the environmental factors appear to have a larger impact on PhR and modified resole foams than XPS or PIR foams. For instance, the environmental effects caused reductions to 93 to 94 percent of the reference level for a modified resole. While the impact of the environmental factors cannot be ignored, one must remember that these exposures were introduced solely as a comparative measure.
For a screening test, one may use extreme exposure conditions (thin, partly encapsulated specimen) and allow excessive accumulation of moisture in the wet-cube specimen. One must remember that these results can not be used for more than a comparative screening process. because the test conditions do not represent the typical service conditions.
Different dimensional stability under adverse environmental conditions was observed at NRC (Bomberg and Kumaran 1989, Ascough 1990; Ascough eta/. 1991; Bomberg 1993). In view of these obse~ations, one may conclude that the dry-cube and freeze-thaw cycling (immediately following a 7 day wet-cube exposure) appear suitable for use as the screening test. A method by which the specimen is subjected to interstitial condensation for a prolonged period of time (wet- cube) and accumulation of moisture in thermal insulating materials (Schwarlz et at. 1989), needs furlherinvestigation.
PART
11.
USE OF THE SCALING TECHNIQUE
The scaling technique was initiated in Sweden (Isberg 1988; Sandberg and lsberg 1989) and significantly improved during SPI / NRC research on sprayed polyurethane foams (Edgecombe 1989; Bomberg and Kumaran 1989; Kumaran and Bomberg 1990; Bomberg 1990; Bomberg and Kumaran 1991), as well as under a parallel ORNUPIMA project evaluating polyisocyanurate foams (Yarbrough etal. 1991. Christian etal. 1991). It was further verified by (Bomberg and Kumaran 1991a; Moore 1992; Bomberg and Kumaran, 1994a; Booth and Yarbrough 1995) and is described in drafts of the proposed ASTM and IS0 standards.
The SPllNRC methodology is, however, more precise than those covered by the ASTM or I S 0 standards. The IS0 standard permits deriving of the LTTP of the board on the basis of testing the core slices alone. Even though the IS0 postulates how to determine R-value for a product, neither of these standards require establishing of the declared initial product performance in the manner independent from the aging tests. Neither of these standards take the error in measuring thermal conductivity on thin slices (the so-called thickness effect into account). It was, therefore. considered appropriate to include an example showing the application of the SPIINRC scaling methodology to a boardstock foam in this final SPIINRC report.
4. Application of the scaling technique for predicting LTTP of a modified resole foam.
4.1. Materials and methods
Three batches of modified resole foams (product 1 ) . were sampled over a period of two months and coded as IC 791, IC 792, and IC 793.
To quantify the effects of environmental factors, thermal resistance tests were performed on specimens exposed to the following conditions:
1) Isothermalaging in the laboratory (referred to as 20% or "control exposure"),
2) Effect of temperature gradient alone. Exposure to 80°C on the warm side and room
conditions (20'~. 45
+
5 %RH) on the other side of the board resulting in a thermal gradient of approximately 1500 Wm. The same absolute humidity was maintained on both sides. Four specimens were simultaneously placed in a cube and Sewed asdividers between the environment maintained inside the cube and an air-conditioned room (referred to as "dry-cube").
3) Effect of moisture in the presence of temperature gradient. This exposure comprised a high relative humidity and a high temperature on the warm side (70°C and relative humidity between 98 and 100 percent RH) and room conditions on the other side, creating a thermal gradient of approximately 1250 Wm, (referred to as "wet-cube").
Evaluation of long-term thermal performance involved cutting thin slices of material. They were prepared in two stages. First, a thin sheet about 2 mm thicker than the required thickness was cut using a horizontal band-saw. This sheet was then mounted on a vacuum table and smoothed with a vertical-spindle surface grinder equipped with a carborundum disc. Suction kept the specimen in place while the grinder moved across its surface.
The grinding process may increase the fraction of open cells in the layer adjacent to the surface. A concept of thickness of the destroyed surface layer (TDSL) was therefore introduced to quantify the effect of surface preparation. For a known surface area. TDSL is defined as a difference between the geometrical and closed-cell (effective) specimen volumes divided by the surface area (Edgecombe 1989; Normandin and Kumaran 1992; Bomberg e t a / 1994a).
The effective volume of the specimen is measured using a gas displacement method, and may therefore depend on both the broken cell membranes and on the mean cell size. A change in TDSL may therefore be caused by a change in the cell morphology. Indeed, it was observed for product 1, that the TDSL of surface layers was in the range of 0.16 to 0.20 mm while the TDSL of the core layers was between 0.23 to 0.26 mm.
4.2 Aaina full boards under environmental exoosures
Figure 1 shows aging of full boards of product I exposed to environmental conditions. While aging is somewhat faster under dry-cube (slightly higher thermal gradient applied) than under wet-cube conditions, the difference is not significant. The difference between the isothermal and thermal gradient conditions is, however, substantial.
Figure 1 shows that when one side of the foam is exposed to elevated temperature (dry- and wet- cube exposures), the foam ages much faster. This effect lasts for a period of 6 to
8
months only. After this period, the rate of changes in all the cutves shown in Figure 1 appears to be identical.46
0 90 180 270 380 460 640
tlme, days
20 C + 80/20 dry cube
*
70120 humld cubeFigure 1. Thermal resistivity measured on specimens exposed to three different environmental conditions.
thermal reslstlvlty, m.K/W
0.8
L
I1 10 100 1000
the,
days
4.3.
Predictina lona-term thermal resistance with the scalina techniaueFigure
2
shows normalized aging curves for surface layers (points denote four curves and the dotted line shows their median) and for the core layers (median only). There is a difference between the aging curves for core and surface layers, and one must decide whether this difference is considered significant or not. In accordance with the ASTM(1995),
one considers the difference between surface and core layers small enough to permit use of the scaling approach. The representative aging curve is then produced as the average of surface and core curves. It is shown as a thick, continuous line in Figure2
and used for further calculations.The actual thermal resistivity for product 1 is derived from two LTTP parameters: 1. the mean value of the initial thermal resistivity of the product (Table
I),
and2.
the aging factor (determined from a normalized, representative aging curve)The LTTP is obtained by multiplying the mean initial-thermal-performance by the aging factor (the latter represents the actual thickness of foambords and aging period). The actual board
thickness varied from
40
to42
mm and the mean thickness was approximated as41.4
mm. Table 1. Initial thermal resistivity of batches IC791,
IC792.
IC793
Batchlspecimen codes
791-398-1
9
791
-398-67
793-401
-101
793-
401
-1 04793-401-1
19
791
-398-54
791-398-7
791-398-15
792-398-174
793-401
-110
793-401
-113
791
-398-23
791
-398-31
792-401
-1 28
791
-398-67
793-401-1
01
792-398-1
54
793-401
-119
791
-398-54
total
37
tests mean r-value62.6
Densiy kglm
40.6
40.3
40.5
40.3
40.6
41.0
40.9
41.9
40.4
41.1
40.6
40.6
42.0
40.7
40.3
40.5
40.8
40.6
41.0
r-value, mKNV
63.0
62.7
62.3
62.5
63.3
62.2
62.7
62.9
62.6
62.5
63.3
61.4
61.6
62.3
62.7
62.3
61.9
63.3
62.2
Batchlspec. code791 -398-63
792-398-1
51
792-398-154
793-401-107
791
-398-39
791 -398-3
791 -398-1
1792-398-1
71
792-401
-128
793-398-1
68
793-401
-131
791
-398-27
792-398-35
793-401-110
792-398-151
793-401-104
793-401-107
,791
-398-39
Densi2 kglm40.1
40.2
40.8
40.9
40.6
40.9
41.2
40.6
40.7
40.6
40.8
41.3
42.0
41.1
40.2
40.3
40.9
40.6
r-value m WW63.3
63.2
61.9
63.1
62.0
62.2
62.7
62.6
62.3
63.1
63.4
61.8
62.1
62.9
63.2
62.5
63.1
62.0
After 1600 days of exposure to actual climatic conditions (material installed in an experimental roof), several specimens were cut and their thermal resistance measured in the laboratory. The mean thermal resistance of these specimens will be compared with that predicted by the scaling technique.
To compare the aging of 10-mm (reference thickness) and 41.4-mm thick layers, the scaling factor of (41.4/10)2 = 17.1 is used. For specified period, 1600 days of full thickness board aging the scaling factor of 17.1 will transform it into the period of 1600117.1 = 94 days aging of the reference thickness. The aging factor, found from the representative aging curve at the 94-day period is 0.89. The predicted 4-year r-value is 0.89-62.6 = 55.5 m KNV.
4.4. Comoarison of oredicted and measured full board thermal resistance
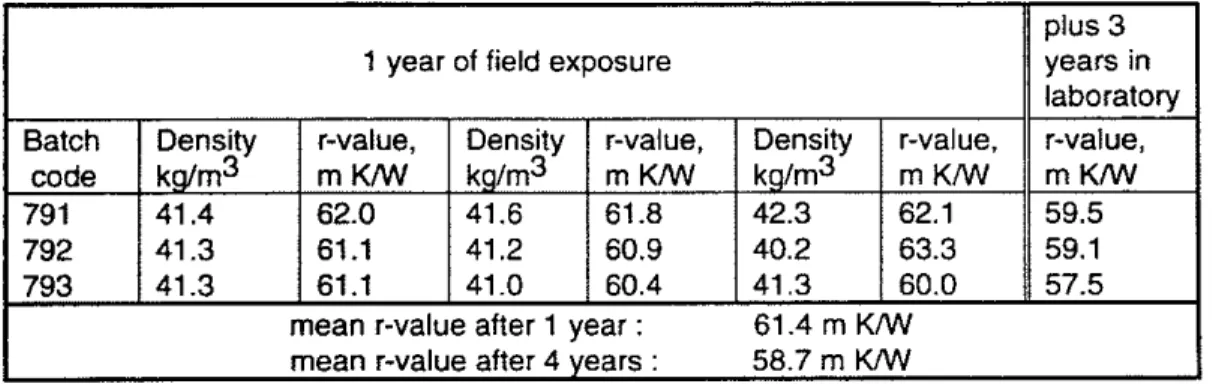
Thermal resistivity measurements performed after 1 and 3 years in the laboratory and after 4 years in the experimental roof exposure are listed in Tables 2, 3 and 4.
Table 2. Thermal resistivity of product 1 after 1 year exposure on the experimental roof and three more years storage in the laboratory.
Table 3. Thermal resistivity of product 1 after 4 years of roof exposure.
plus 3 years in laboratory r-value, m K M I 59.5 59.1 57.5 1 year of field exposure
mean r-value after 1 year : 61.4 m KNV mean r-value after 4 years : 58.7 m WW Batch code 791 792 793 Batch code 791 792 793 Density kglm3 42.3 40.2 41.3
after 4 years, mean r-value 58.8
.
Density kg/m3 42.0 40.6 40.9 r-value, m KNV 62.1 63.3 60.0 Density kg/m3 41.4 41.3 41.3 r-value. mK/W 59.5 58.4 58.4 r-value, kglm 41.9 40.9 40.9 r-value, m KMI 62.0 61.1 61.1 59.8 58.9 57.8 Density kg/m3 41.6 41.2 41 -0 r-value, m KMI 61.8 60.9 60.420
Table 4. Thermal resistivity of product 1 after 4 years of laboratory storage.
Thermal resistivity measured after 1 and 4 years of field exposure and prolonged laboratory storage can be compared with that measured initially. The aging of product 1 is very slow. The mean thermal resistivity changes from the initial value of 62.6 to 61.4 m WW after 1 year of storage and to 58.8
+
0.1 m W after four years (cf. Tables 2, 3 and 4). These results show no significant difference in periormance of product 1 aged in the laboratory or in the field.Batch period, r-value,
code days m
KNV
791 1787 59.5
793 1646 57.9
792 1640 58.5
The prediction of the LTTP based on the initial thermal resistivity determined on full-thickness specimens and aging of thin layers was 55.5 m W . This prediction can be compared with the measured results that were 58.8 m W for product 1 sampled from the field exposure and 58.9 m WW for the laboratory samples. The difference between the predicted and measured values is about 6 percent. This may be acceptable for a preliminary investigation of a boardstock foam. where the effect of densified skin layer is not critical for the aging process. For a more precise evaluation of foamboard aging, one can use the DlPAC model (see Part Ill of this report).
Batch period. r-value,
code days m KM,
791 1764 60.1
793 1642 58.6
5. Discussion on the use of the scaling technique
after 4 years, mean r-value 58.9
It was requested that the LTTP predictive methodology should, during a period of 6 months or less, predict an average thermal resistance over a service life. This can be achieved with the use of either thin (6- to 12-mm thickness) or ultra-thin (2- to 3-mm thickness) layers. The BA
solubility process, however, as discussed in Part Ill of this report, is independent on slice
thickness and requires a prolonged period for achieving the equilibrium between the BA in the cell gas and that in the struts of polymer matrix. As the testing period primarily relates to diffusion of air components through polymer membranes, selecting foam layer so thick that testing period exceeds the response time for BA solubility in the struts (Brodt, 1995) may be necessary. Unless a correction for BA solubility is applied, a 5- to 6-month period of testing may be necessary. For instance using 10- to 12-mm thick XPS and SPF layers may be recommended when the slicing and scaling technique is used for LTTP prediction.
Unlike the ASTM (1995) or I S 0 (1994) standards the SPIINRC methodology requires establishing the initial (declared) product performance by a statistically valid number of tests performed on a full-board thickness (50 mm thick for the sprayed or poured foams).
The effect of time on thermal performance is determined on thin layers cut both from the surface and core of the product and presented on a graph with the dimensionless thermal resistivity and the aging period being the coordinates. This dependence is called a normalized aging curve.
The normalization process serves several purposes:
comparison of aging curves of slices from different locations (surface and core),
comparison of aging curves of slices exposed to different environmental conditions, and reduction of errors caused by the dependence of thermal resistivity on specimen thickness, when the normalization process was used. (Often, this is not possible, because measuring the initial thermal resistivity on a thin layer is difficult.)
A value of dimensionless thermal resistivity at the reference period selected for LTTP evaluation is called the aging factor. Multiplying the aging factor by the mean initial thermal resistance, one obtains the LTTP value. By using a dimensionless aging factor and a mean initial thermal resistance of the product, the SPIINRC methodology introduces statistical averaging of the material variability, thus making this methodology more precise than those covered by the ASTM (1 995) and I S 0 (1 994) documents.
PART
111:
USE
OF
THE
DlPAC
MODEL
While the scaling technique could be applied for an approximate evaluation of some boardstock products (e.g., SPF or XPS), it was not applicable to some other boardstock products (e.g.. some PIR and PhR). Therefore, a general approach applicable to any combination of polymer and BA was sought. This was achieved through improvement of the aging model (Bomberg 1988) resulting in development of the DlPAC model.
6. Materials and procedures
Nine types of either experimental or commercially available foams were tested under both field and laboratory conditions. This number includes seven foam products that were delivered to NRC by their manufacturers, one taken from a warehouse and examined at NRC and one tested entirely by the manufacturer.
The foams delivered to NRC were:
9 four extruded polystyrene (XPS) foams, coded as C, D, F and G products;
one polyisocanurate (PIR) foam, coded as 0 2 product; one phenolic (PhR) foam, coded as B product; and
.
one modified resole foam (PhR), coded as L product.Foam number eight, a PIR product, was taken from a warehouse. This PIR product had been exposed in a built-up roof (Mulhlenkamp and Johnson 1983) and tested in the laboratory under elevated temperature exposure (Bomberg 1988).
Foam number nine, a batch of 25.4 mm thick ~ t ~ r o f o a m ' brand extruded polystyrene foam- boards, provided with natural surface skins, was used in previous research on application of slicing and scaling technique (Booth and Grimes 1993; Bhattacharjee el al. 1994). Ustng this foam batch for LTTP evaluation with the DlPAC model prov~ded an opportunity to compare three different techniques:
LTTP prediction based on application of the DlPAC model to the input data generated by the Dow Chemical NA (see Appendix A).
LTTP prediction based on application of the StyrofoamTM aging model, and slicing and scaling involving thin and ultra-thin material layers (Booth eta/. 1995)
Measurements of thermal resistance were performed on: specimens stored in the laboratory, and
exposed to weather conditions on one side and room conditions on the other side. The latter is referred to as the roof exposure (Bomberg and Kumaran 1994). The roof exposures used in this investigation include a conventional roof (CR) and a protected membrane roof (PMR). Both exposures utilized a single-ply, black EPDM membrane.
Samples of different foam products, either those placed in the conventional roof, the protected membrane roof, or in the laboratory were periodically removed from their respective locations and tested for thermal resistance according to ASTM standard test method C 518. Thermal
resistance measurements for validating the aging model were taken on large specimens, those used for generating material characteristics were taken on partly encapsulated slices and smaller specimens. Two pieces of laboratory equipment were used: a standard 600-mm HFM apparatus and a Cstation HFM, which permits simultaneous but separate testing of four 300-mm square slices.
Both the laboratory measurements and model predictions were then compared with the thermal resistance measured without removing the foam from the test roof. The tested specimens were placed on top of a 25-mm thick, high-density glass fibre insulation (GFI) board. Large specimens of GFI. previously tested in a HFM apparatus and provided with surface thermocouples, were placed within the GFI board. The tested specimens were positioned precisely on top of these GFI standard reference specimens. A new test method (see Section 9 of this report) was developed for testing thermal resistance in situ.
7. The DlPAC model of aging
The objective is to calculate, at any given time, the heat flux through the foam slab exposed to a specific temperature difference (Bomberg 1988). To perform this calculation, the slab is treated as if it were made up of a number of layers, and time is d~vided into number of time-steps.
The most important simplifying assumptions made in the development of the model are that
material properties and boundary conditions remain unchanged during the time step, material properties used in calculation are those calculated in previous time step, and there is no coupling between heat and mass transfer phenomena, except for the correction introduced by the approximate treatment of condensation and evaporation of the BA.
For each time step and each layer, five or six separate transfer equations are solved [Equation (1) is one of them]. All are necessary to determine the composition of the cell gas. As the cell- gas composition changes, so does the thermal conductivity of the cell gas. Adding the other components of heat transfer (solid phase conduction, radiation, and the interaction between solid phase conduction and radiation), which are assumed to be time-independent, the heat flux in each layer of the foam may be calculated.
For each time step and each layer, the model calculates:
1. temperature,
2. partial pressure of oxygen, nitrogen, co-BA and one or two captive BAS,
3. saturation partial pressure of each BA,
4. condensation or evaporation of each BA that occurs to maintain equilibrium with its pressure,
5. heat flux caused by the BA change of phase,
6. equilibrium solubility of BA as a function of its partial pressure, temperature a time from the change of boundary conditions,
7. transfer between dissolved and gaseous fraction of BA to maintain equilibrium, and 8. thermal conductivity of cell-gas mixture.
Thus, except for the addition of steps 6 and 7, the other elements of model formulation and solving procedures remain unchanged (Bomberg 1988). The transfer between the dissolved and gaseous fraction of BA (step 7) Is governed by the solubility function (step 6). This transfer was introduced as a sourcelsink term to the one-dimensional mass conservation equations, namely:
where P = the partial pressure of a gas in the slab. Pa: S =the specific gas storage, kg/(m3.pa),
1
mo = the sink-source term calculated for a unit of volume of the foam, kgl(rn3.s), Pe, = the gas permeability coefficient, kgl(s.m.Pa). The gas permeability coefficient may vary depending on location in the cross-section, i.e., may vary with the coordinate "x". Equation (1) gives the partial pressure of the gas at each node at time step (n+l), using the values of material characteristics (Pe, S
,
mo) from the previous time-step, i.e., at time step "nu.1
Equation (1) represents mass transfer of a BA. Identical equations are written for mass transfer of oxygen, nitrogen and carbon dioxide except that solubility of these gases in the polymer is disregarded and the sourcelsink term omitted.
For heat transfer, the following equation is used:
where C =the specific heat, JI(kgQC), T is the temperature, "C or K; and
h i s the thermal conductivity coefficient, Wl(m K) that contains three components: conduction through the solid phase, cell-gas, and radiative heat transfer.
Finally, four equations for mass transfer and one for heat transfer are simultaneously solved with a procedure that uses Thompson's algorithm for tridiagonal matrix solution (Pantakar 1980).
8. Input: material characteristics and initial and boundary conditions
This section reviews some of the techniques for determining material characteristics, such as effective diffusion coefficients for oxygen or nitrogen or the extinction coefficient of IR radiation
6.1. Densitv distribution in the cross-section
Four 5- to 7-mm thick, square specimens (300 by 300 mm) are cut from each surface and from the middle core of the foam. These specimens are mainly used for thermal resistance testing. However, because densities of test specimens are determined as auxiliary information, the density distribution across the thickness of the slab is also derived by interpolating the data for the 4 slices.
&7. S~ecific mass extinction coefficient for IR radiation
The radiative component of heat transfer is defined by the following equation:
where K is a specific mass extinction coefficient (Kuhn eta/. 1992). The specific mass extinction coefficient is defined as the total extinction coefficient divided by the foam density. Thus,
changes in density. unless associated by significant alterations in cellular structure, are well represented in the heat transfer calculations.
Equation (3) describes thermal conductivity of the foam as a function of specimen thickness (Booth and Grimmes 1994). Note that for optically thick specimens (large x), Equation (2) gives thermal conductivity as defined by the Rosseland's approximation (Ostrogorsky and Glicksman 1986).
8.3. Effective diffusion coefficient of nitroaen and oxvaen
Measurements of the diffusion coefficients of nitrogen and oxygen are performed with a constant volume sorption apparatus described by Schwartz eta/. (1 989). In contrast to the apparatus described by Brehm and Glicksman (1989). the quantity of gas introduced to the chamber is measured. This permits calculation of the final equilibrium pressure in the test chamber.
With nitrogen being the dominant gas in air, the nitrogen diffusion coefficient is always
determined for the surface and core layers. The oxygen diffusion coefficient is determined only for the core layer. The same interpolation used for the nitrogen diffusion coefficient is then used to assign the distribution of oxygen diffusion coefficient across the different layers of the board. This procedure should approximate the oxygen diffusion process, because, for a given foam, a fixed relation between the two diffusion coefficient exists (Ostrogorsky and Glicksman 1986).
The temperature dependence of the diffusion coefficients is needed for the model calculations. The diffusion coefficients are, however, measured at room temperature. Generally, for a given foam, the temperature dependence of the diffusion coefficient for nitrogen and oxygen is similar, (Ostrogorsky and Glicksman 1986; Schwartz et a/. 1989; Booth and Holstein 1993; De Nazzelle 1995). Thus, the temperature dependence is usually estimated from published data.
8.4. Solid ohase conduction with lmaae Analvsis characterization of cells
The DlPAC model permits use of either the cube model or a serial-parallel model based on image analysis (IA) characterization of cell morphology (Rhodes 1991). The serial-parallel model recognizes three parallel heat flow mechanisms: conduction through cell gas, conduction through the continuous polymer and contribution from mass transfer (latent heat transfer). These three mechanisms are in series with heat transfer through a discontinuous part of the polymeric matrix. To use the serial-parallel model of heat transfer through the polymeric matrix, a thinning routine, (Schwartz and Bomberg 1991), is used to divide the polymer matrix into discontinuous and continuous parts. In contrast to the cube model, use of the IA characterization predicts differences in thermal conductivity measured parallel or perpendicular to the foam rise.
@. BA solubilitv as a function of time and temoerature
Since the BA equilibrium appears to change over long periods of exposure (Bomberg etal. 1990), it may be convenient to divide it into two components. The first component of solubility is related to the gaseous phase and defined, for a unit volume, as the partial derivative of mass, m, with respect to gas pressure. For an ideal gas (Ostrogorsky and Glicksman 1986), it becomes S, = 11 (RT).
Instead of the permeability, Pe, and the specific gas storage (void solubility), S,, one measures their ratio. Deff (Den = Pels,), the effective gas diffusion coefficient (Schuetz and Glicksman 1983) and expressed in mzls, and uses this ratio to solve Equation (1).
Equation (1) introduced a sink /source termrelated to a specific gas storage in the polymer matrix, mo, which traditionally has been disregarded (Ostrogorsky and Glicksman 1986). This sinWsource term defines the gas that may either be adsorbed by the polymer surface or may penetrate into the polymer matrix. To describe how the temperature and pressure of BA affect its solubility the Flory-Huggins equation (Flory 1953) is used. This equation is generally accepted for correlation of BAS solubility data and used to generalize the interaction between the solute (BA) and the solvent (polymer) over a wide range of temperatures and pressures (Gorski etal.
where ai = the thermodynamic concentration called activity, @1 =the volume fraction of a solvent, and
x
= the Flory-Huggins interaction parameter.An additional parameter, called the polymer index, p,,, was introduced to multiply the mass of polymer when fitting the experimental data of the BA solubility in the polymeric matrix. This parameter accounts for a number of effects, such as the presence of crystalline segments reducing the fraction of amorphous polymer dissolving the BA or the presence of electro-osmotic forces on the polymer surface that would increase the surface adsorption of the gaseous BA. For an amorphous polymer, e.g., polystyrene and BA with a normal boiling point close to room temperature, the polymer index is equal to 1. For a polymer with a significant fraction of highly organized segments, e.g. polyurethane, it is less than 1. Nevertheless, being an empirical quantity, for some BAS, the polymer index was found to be more than 1, even for an amorphous polymer.
The actual mass of the polymer is multiplied by the polymeric index to give the effective polymer mass. It, when used together with Equation (4), will give the value of S, an equilibrium solubility of the BA in the foam.
One more parameter is introduced to the sinldsource term in Equation (1). It relates to time elapsed since the conditions of temperature and pressure were last changed. This parameter, based on the work by Destephen (1993) is defined as:
where
5
and C are experimentally determined constants.In effect, the sinldsource term, mo , is calculated as a product of equilibrium solubil~ty, S, and the change in elapsed time, A5;during the actual time-step:
The sinklsource term defined by Equation (6) becomes
0
when a period after change in the boundary conditions reaches a prescribed value of tmax.8.6.
BA concentrationThe foam was crushed in a solvent environment and the concentration of dissolved BA is determined by the gas chromatography. The measurements were performed by Du Pont Canada (Ascough 1989).
8.7 Effective diffusion coefficient of BA (determined with he10 of the DIPAC model)
The effective diffusion coefficient for the BA is calculated from the thermal resistance as a function of time. This technique can be applied to foams manufactured with one captive BA, and it permits one to establish the BA diffusion coefficients for both core and surface layers.
However, all other input data for the DIPAC model must be known before this technique can be used to estimate the diffusion coefficients. This usually involves a few iterations. These
Iterations must start always from the time of manufacturing to correctly represent the storage and transfer processes undergone by BA, nitrogen and oxygen. The temperature dependence of the BA diffusion coefficient is once again estimated from data reported by (Ostrogorsky and
Glicksman 1986; Booth and Holstein 1993; Destephen 1993; and de Nazzelle 1995).
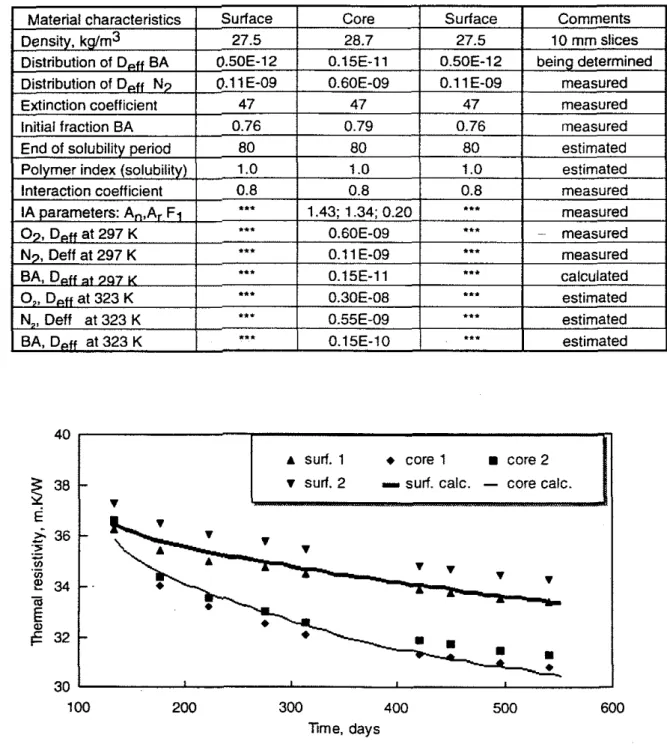
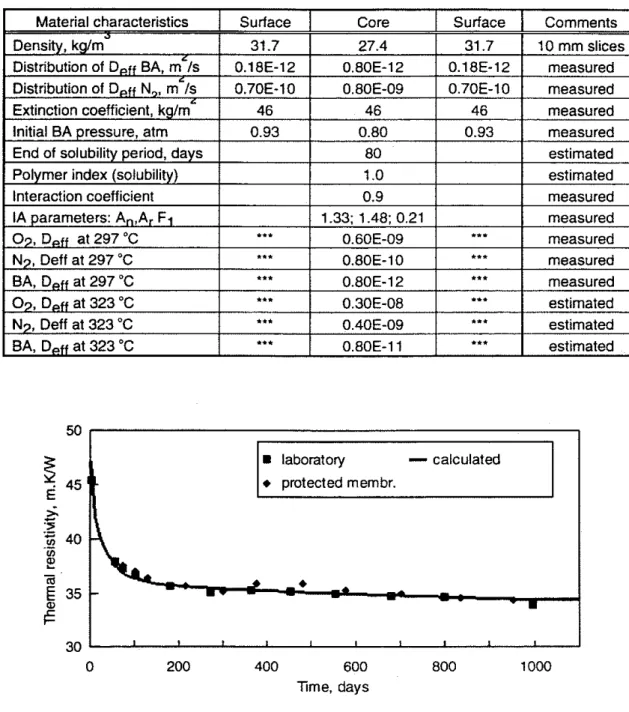
As mentioned above, knowing all other material characteristics, the DIPAC model itself is used to estimate the BA diffusion coefficient. As an example, Table 5 not only shows the input data used in one such calculation, but also indicates whether the material characteristics were measured on the actual foam or estimated on the basis of published data.
In the present example, the BA diffusion coefficients for the surfaces and core are determined as follows. The slices were cut after 140 days into the aging period of the full board. Hence, the initial BA concentration distribution in the full board had to be calculated. From an initial guess of the BA diffusion coefficients for both the surface and core layers, a distribution of BA pressure was estimated after a 140-day period of aging of the full board. From this distribution, the BA pressure in each of the surface and core layers was derived. Then, the DIPAC model was used to calculate the aging curve for each of these layers. These calculations were repeated until the calculated and measured aging cuwes agreed satisfactorily (see Figure 3).
30
Table 5. Characteristics of XPS product D used in the DIPAC model calculations
30 100 200 300 400 500 600 Time, days N7. Deff at 297 K BA, D,ff a+ 707 K
O,,
D,ff at 323 K N,, Deff at 323 K BA, D d f at 323 KFigure 3. Aging curves (thermal resistivity versus aging period) for 7-rnm thick layers cut after about 140 days of aging from the core and surfaces of XPS product D, (code 422-178).
...
...
.*. .**...
0.1 1 E-09 0.15E-11 0.30E-08 0.55E-09 0.15E-10 a** ..* *.* *.* .*. measured calculated estimated estimated estimated9. A method to measure thermal resistance in situ
Numerous factors affect the performance of thermal insulating materials under field conditions. Some of them cannot be easily predicted or tested in a laboratory. As it is difficult to predict how much the foam insulation would be affected by daily and seasonal temperature variations, particularly when these processes affect aging and weathering of the foam, thermal resistance was also measured in situ, when the foam was exposed to actual weather effects.
A method called heat flow comparator (HFC) method was developed for in-situ testing. (Bomberg eta/. 1994). This method requires placement of the test and reference slab in contact with each other and uses temperatures on each surface of these two slabs as the boundary conditions in the heat flow calculations. Both slabs (specimens) are treated as homogenous and their thermal properties (thermal conductivity and specific heat) are assumed to be linear functions of
temperature. Use of Kirchoff's potential function, instead of thermal conductivity, linearizes the equation system for the range of temperature in which the linear relation of thermal conductivity to temperature holds.
The heat flux across the boundary surface between reference and tested specimen is calculated by using a numerical algorithm to solve the heat transfer equation for the reference specimen. By imposing the requirement of heat flux continuity at the contact boundary between test and reference specimens, one can find corresponding values of thermal conductivity and heat capacity of the tested specimen with an iterative technique. The HFC code calculates heat flux at the interface and finds a match within sensitivity and truncation errors of the numerical method. Even though thermal properties of the test specimen are initially guessed, the process of
simultaneous optimization of a few hundred data points (one test series stretches over a few days) results in the most probable set of material properties.
The optimization process that involves the slope, intercept and correlation coefficient of linear regression proved effective for selecting the most probable set of material properties of the test materiai. In effect, the overall uncertainty of the field measurements was estimated to vary between 4 and 7 percent of which 3.5 percent was attributed to the uncertainty in the properties of the reference specimens (Bomberg et a/. 1994).
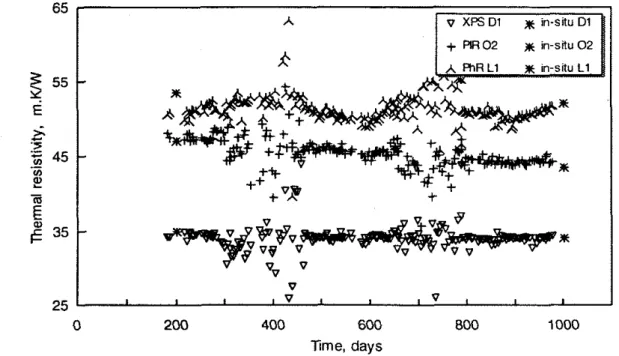
Figure 4 shows results of measurements performed with the HFC method, which are, for the sake of comparison, recalculated to a mean temperature of 24°C. Despite a significant scatter in the results, an overall aging trend may be observed. Extruded polystyrene product
Dl
agesslowly, reducing its thermal resistivity from about 35 m WW at 200 days to about 34 m WW at
1000 days. PIR product 0 2 shows a slightly higher rate of aging, i.e., the thermal resistivity is reduced from 47 m
KMI
at 200 days to about 43.5 m WW at 1000 days. Modified resole foam, productLl.
shows aging from about 53.5 m W at 200 days to about 52 m WW at 1000 days.A
similar plot (not shown here) for phenolic foam, product 0 , indicates a reduction of thermal resistivity from about 53.5 m WW at 200 days to about 50.5 m W at 1000 days.
Xme, days
Figure 4. Thermal resistivity of XPS product Dl, PIR product 02, and modified resole product
Ll
measured in situ and recalculated to the standard laboratory test conditions.
10. Comparison of DlPAC prediction and measured thermal resistance
To establish long-term thermal performance of a foam product, one must first determine its initial thermal resistance. Normally, in the work reported here, three randomly selected specimens from three production batches of each tested material (a total of nine specimens) were used to establish the initial R-value of the foam product. Then, using the DIPAC model with appropriate
material characteristics (see Section 8 ) , one can determine the reduction of thermal performance over a specific period of time.
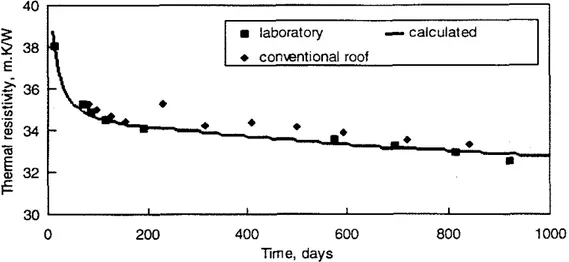
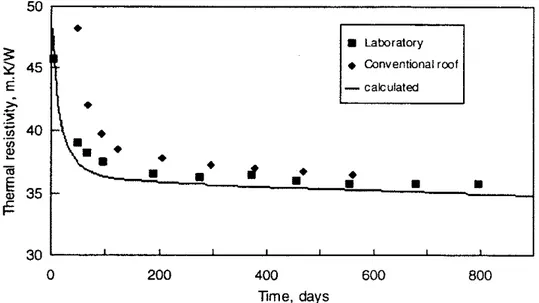
Material characteristics used in the DlPAC model calculations for XPS product C are listed in Table 6 showing whether the particular characteristic was measured or estimated on the basis published data.
Table 6. Characteristics of XPS product C used in the DlPAC model calculations.
This product was exposed on a conventional roof and laboratory and intermittently tested at standard test conditions (mean temperature of 24°C and temperature difference of about 22°C).
To examine if the tested specimen represents average product performance, the initial thermal resistivity was measured on nine specimens selected from three different batches as mentioned above. The mean value of thermal resistivity is 38.1 m KMI; with the standard deviation of 0.12
m
KMI.
Thus, the aging cuwe shown in Figure 7 may be considered representat~ve of the XPS product C.30 0 200 400 600 800 1000 Time, days laboratory -calculated
+
conwnt~onal roof-
+
m
Figure 5. Measured and calculated from the DiPAC model aging curves for full-thickness XPS oroduct C.
Material characteristics used in the DIPAC model calculations for XPS product D are listed in Table 5. Product D is characterized by the initial thermal resistivity of 39.2 m KMI; the standard deviation, 0.32 m WW. 40 30 0 200 400 600 800 1000 Time, days laboratoty
-
calculated o protected membr. x In-situ trendFigure 6. Measured and calculated from the DlPAC model aging of boards of the XPS product D.
Figures 5 and 6 show aging of extruded polystyrene (XPS) products C and D indicating that differences between foam exposed on the roof and stored in the laboratory are small. One may 0bselve agreement between thermal resistivity calculated from the DlPAC model and the values measured in the laboratoty and in situ.
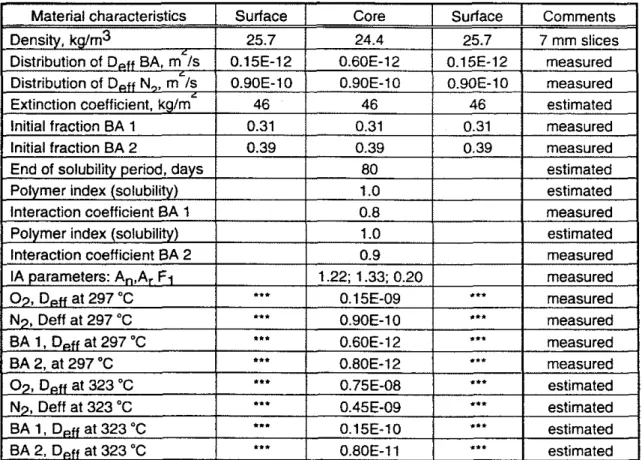
Table 7 lists the material characteristics used in the DlPAC calculation for XPS product F. Table 7. Characteristics of XPS product F used in the DlPAC model calculations.
8 laboratory
-
calculated protected membr. A.-
-.
-
.
*- -
7 T 30 [ 0 200 400 600 800 1000 Time, daysFigure 7. Measured and calculated from the DlPAC model aging curves for full-thickness XPS product F.
Figure 7 shows aging of extruded polystyrene (XPS) product F, exposed on a protected membrane roof (PMR) and in the laboratory. These tests were initiated within a few days after manufacture. The mean thermal resistivtiy for this product is 44.4 rn W . The standard deviation is 1.12 m WW. (The standard deviation does relate to the quality of a product as the change in r-value during the initial tests was as much as 5 percent). There is also a good
agreement of tests and the DlPAC model prediction. Table 8 lists material characteristics used in the DlPAC calculation for XPS product G.
Table 8 . Characteristics of XPS product G used in the DlPAC model calculations
The XPS product G differed from the previous three in that it used two BAS. Hence, the model calculations are more complex. One must have independent information on one of the BA diffusion coefficients. In this case, one of the diffus~on coefficients was estimated on the basis of aging of the same product but manufactured with a single BA. Then the procedure described in Section 8.8 was used to estimate the other diffusion coefficient.
The calculation performed for thin layers showed that the measured initial concentrations of these two BAS were in error. Information for an identical but thinner XPS product was, however,