HAL Id: hal-01139251
https://hal.archives-ouvertes.fr/hal-01139251
Submitted on 3 Apr 2015
HAL is a multi-disciplinary open access
archive for the deposit and dissemination of
sci-entific research documents, whether they are
pub-lished or not. The documents may come from
teaching and research institutions in France or
abroad, or from public or private research centers.
L’archive ouverte pluridisciplinaire HAL, est
destinée au dépôt et à la diffusion de documents
scientifiques de niveau recherche, publiés ou non,
émanant des établissements d’enseignement et de
recherche français ou étrangers, des laboratoires
publics ou privés.
Effects of maleic anhydride grafted ethylene/vinyl
acetate copolymer (EVA) on the properties of
EVA/silica nanocomposites
Thai Hoang, Nguyen Thuy Chinh, Nguyen Thi Thu Trang, To Thi Xuan
Hang, Dinh Thi Mai Thanh, Dang Viet Hung, Chang-Sik Ha, Maëlenn Aufray
To cite this version:
Thai Hoang, Nguyen Thuy Chinh, Nguyen Thi Thu Trang, To Thi Xuan Hang, Dinh Thi Mai Thanh,
et al.. Effects of maleic anhydride grafted ethylene/vinyl acetate copolymer (EVA) on the properties of
EVA/silica nanocomposites. Macromolecular Research, Springer, 2013, vol. 21 (n°11), pp. 1210-1217.
�10.1007/s13233-013-1157-8�. �hal-01139251�
To link to this article: DOI:10.1007/s13233-013-1157-8
http://dx.doi.org/10.1007/s13233-013-1157-8
This is an author-deposited version published in:
http://oatao.univ-toulouse.fr/
Eprints ID: 9578
To cite this version:
Hoang, Thai and Chinh, Nguyen Thuy and Trang, Nguyen Thi Thu and
Hang, To Thi Xuan and Thanh, Dinh Thi Mai and Hung, Dang Viet and
Ha, Chang-Sik and Aufray, Maëlenn Effects of maleic anhydride grafted
ethylene/vinyl acetate copolymer (EVA) on the properties of EVA/silica
nanocomposites. (2013) Macromolecular Research, vol. 21 (n°11). pp.
1210-1217. ISSN 1598-5032
O
pen
A
rchive
T
oulouse
A
rchive
O
uverte (
OATAO
)
OATAO is an open access repository that collects the work of Toulouse researchers and
makes it freely available over the web where possible.
Any correspondence concerning this service should be sent to the repository
Effects of Maleic Anhydride Grafted Ethylene/Vinyl Acetate Copolymer (EVA)
on the Properties of EVA/Silica Nanocomposites
Thai Hoang*,1, Nguyen Thuy Chinh1, Nguyen Thi Thu Trang1, To Thi Xuan Hang1, Dinh Thi Mai Thanh1,
Dang Viet Hung2, Chang-Sik Ha*,3, and Maëlenn Aufray4 1
Institute for Tropical Technology, Vietnam Academy of Science and Technology, 18 Hoang Quoc Viet, Cau Giay, Hanoi, Vietnam
2
Hanoi University of Science and Technology, 1 Dai Co Viet, Hanoi, Vietnam
3
Department of Polymer Science and Engineering, Pusan National University, Busan 609-735, Korea
4
Inter-University Center for Materials Research and Engineering (CIRIMAT), 118 Narbonne, 31077 Toulouse Cedex 04, France
Abstract: Ternary nanocomposites based on ethylene/vinyl acetate copolymer (EVA), maleic anhydride-grafted EVA (EVAgMA), and nanosilica were prepared in a Haake Rheomixer. The structure of the EVA/EVAgMA/silica nanocomposites was characterized by Fourier transform infrared spectroscopy and field emission scanning electron microscopy. The blending sequence was found to have a significant effect on the microstructure of EVA/EVAgMA/silica nanocomposites and the dispersion behavior of the nanosilica in the EVA matrix. The tensile properties (tensile strength and elonga-tion at break), thermal behavior, crystalline structure and weatherability of the nanocomposites were also studied. The results showed that the above properties of the nanocomposites were enhanced remarkably using 1 wt% EVAgMA. Keywords: ethylene/vinyl acetate copolymer (EVA), nanosilica, nanocomposite, mechanical properties, thermal
stabil-ity, weatherability.
Introduction
Ethylene/vinyl acetate copolymer (EVA) is used widely in electrical insulation, cable jacketing, encapsulation, packag-ing and corrosion protection, etc. The low cost and relatively good electrical and barrier properties of EVA have led to the continuous expansion of its applications, replacing other engineering plastics. On the other hand, the low tensile strength, thermal and UV stability of EVA have limited its applica-tions in some fields.1
To overcome these disadvantages, nanoparticles were added to this copolymer to improve the mechanical properties and thermal stability.2-5
The dispersion of silica nanoparticles (SNP) and the interfacial interaction between the SNP and polymer matrix play important roles to determine the properties of nano-composites.6-9
SNP exhibit high surface activity and large agglomeration due to the lack of coordinate atoms on the sur-faces. Moreover, the poor compatibility between the SNP and EVA matrix leads to the formation of nanocomposites that cannot achieve the expected properties. Therefore, it is important to use suitable compatibilizers to improve the
dis-persibility of SNP in EVA, and the interfacial adhesion of SNP and EVA. Several studies related to SNP/polymer composites have focused on using amine and maleic anhydride -modified polypropylene (PP) as compatibilizers in PP/SNP nanocomposites to enhance the mechanical properties of the nanocomposites.9-12
Hitherto, there has been little research on the use of a maleic anhydride modified EVA (EVAgMA) as a compatibilizer in EVA/SNP nanocomposites.
The main aim of this work was to examine the effects of EVAgMA on the rheological, mechanical properties, crystal-line structure, thermal stability and weatherability of EVA/ SNP nanocomposites. The interactions in the EVA/EVAgMA/ SNP nanocomposites might include hydrogen bonding and dipole-dipole interactions between the carbonyl and C-O-C groups of MA in EVAgMA, as well as between the hydroxyl groups on the SNP surface and the carbonyl and C-O-C groups in EVA. These interactions might improve the dis-persion of SNP in the EVA, which would enhance the prop-erties of the EVA/silica nanocomposites.
Experimental
Ethylene/vinyl acetate copolymer (EVA) containing 10 wt% vinyl acetate (VAc) in granular form with a density of 0.93 *Corresponding Authors. E-mails: hoangth@itt.vast.vn or
g/cm3
and melt flow index of 1.3 g/10 min/190o
C/2.16 kg was purchased from Hanhwa Co., Korea. Silica nanoparti-cles (SNP) with a purity of 99.8%, mean particle size of 12 nm, and specific surface area of approximately 175-225 m2
/g (BET) were obtained from Sigma-Aldrich Co. EVA grafted with 0.5 wt% maleic anhydride (MA) was purchased from Hanhwa Co., Korea.
Preparation of EVA/EVAgMA/SNP Nanocomposites (EMS). The nanocomposites containing 2 to 5 wt% SNP and 0 to 2 wt% EVAgMA were prepared by the melt mixing of EVA and SNP in a Haake Rheomixer (Germany) at a mixing temperature of 160o
C, mixing time of 5 min, and rotor speed of 50 rpm. After melt mixing, the nanocomposites were molded using a hot pressured machine (Toyoseiki Co.) at 160o
C at a 15 MPa pressure for 3 min to form samples with a thickness of approximately 1 mm. The samples examined are abbreviated in Table I. The EVAgMA and SNP contents were based on EVA by weight %.
Characterization. The relative melt viscosity, which is expressed as the torque values in the mixing process of EVA, SNP and EVAgMA, was recorded using Polylab 3.1 software connected to a Haake Rheomixer. The Fourier transform infrared (FTIR) spectra were recorded on a FTIR-Nexus infrared spectrometer using thin films of the samples prepared by compression molding in the range, 4000-400 cm-1
, at room temperature. The tensile properties, such as the tensile strength and elongation at break of EVA and EMS were measured on a Zwick Tensile 2.5 Machine according to the ASTM D638 standard. The morphology of the nano-composites was analyzed by field emission scanning electron microscopy (FESEM, S-4800 Hitachi). X-Ray diffraction (XRD, Siemens D5000) was performed using CuKα radiation
(λ=0.154 nm) at 40 kV and 30 mA. The XRD data was col-lected between 5o
and 60o
2θ at room temperature with a scanning speed of 0.7o
/s and a step size of 0.03o
. The thermal properties were measured on a DTG-60H and DSC-60 ther-mogravimetric analyzer (Shimadzu Co.) under an argon atmosphere from room temperature to 600o
C and at a heating rate of 10o
C/min. The relative crystallinity (χc) of the
sam-ples was calculated using the following equation:10,13
χc=∆Hf ×100/∆H*f
where ∆H*f is the fusion enthalpy of the perfectly
polyethyl-ene crystal (298 J/g) and ∆Hf is the enthalpy of fusion of the
samples.
The weatherability of the nanocomposites was analyzed using an accelerated weathering test on a UV-CON 327 (USA) according to the ASTM 793-91 (G32) method. Every cycle of the accelerated weathering test includes: 8 h of UV irra-diation at 70o
C and 4 h of humidity condensation at 50o
C. The total testing time is 168 h (corresponding to 14 cycles). The tensile properties of the nanocomposites were deter-mined before and after 6 and 14 cycles of the accelerated weathering test.
Results and Discussion
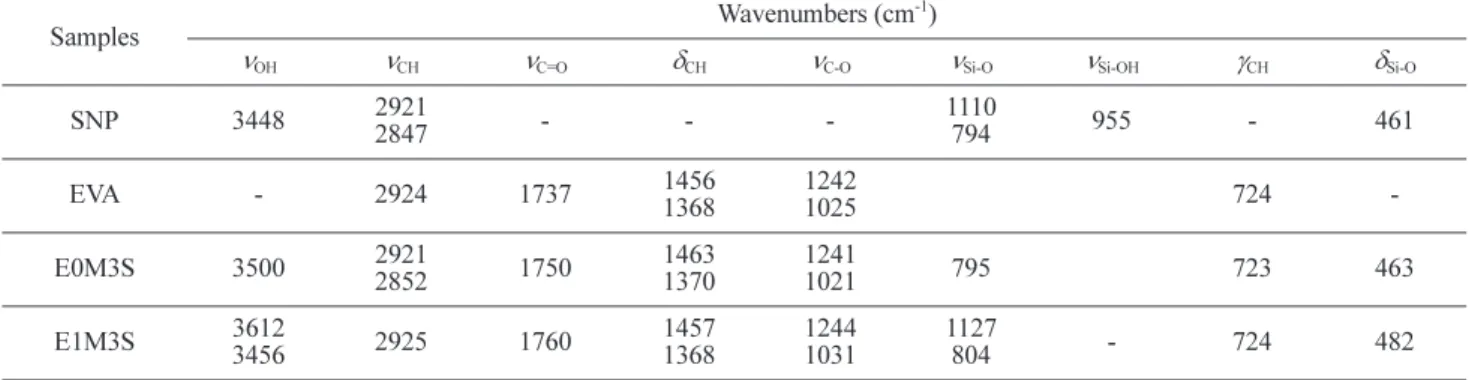
IR Spectra. Figure 1 presents the FTIR spectra of the SNP, EVA, E0M3S, and E1M3S nanocomposites. The spec-trum of SNP showed the characteristic peaks, such as Si-O asymmetric and symmetric stretching vibrations (1110 and 794 cm-1
), Si-O bending vibrations (461 cm-1
) and Si-OH stretching vibrations (955 cm-1
), and the OH stretching and bending vibration (3448 and 1633 cm-1
, respectively).14,15
The spectra of E0M3S and E1M3S clearly showed the
char-Figure 1. FTIR spectra of the EVA and EVA/SNP/EVAgMA nanocomposites.
Table I. Abbreviation of the EVA/EVAgMA/SNP Nanocomposite Samples EVAgMA Content (wt%)
SNP Content (wt%)
0 0.5 1 1.5 2
2 E0M2S E0.5M2S E1M2S E1.5M2S E2M2S 3 E0M3S E0.5M3S E1M3S E1.5M3S E2M3S 4 E0M4S E0.5M4S E1M4S E1.5M4S E2M4S 5 E0M5S E0.5M5S E1M5S E1.5M5S E2M5S
acteristic peaks of EVA, such as the peaks at 1737 cm-1
for carbonyl and 1242 and 1025 cm-1
for C-O groups in the MA and acetate groups, as well as peaks at 2924, 1456, 1368, and 724 cm-1
due to the CH groups.2,5
Some peaks observed at 795 and 804 cm-1
(Si-O-Si symmetric stretching vibration), and 463 and 482 cm-1
(Si-O-Si bending vibration) in the E0M3S and E1M3S spectra, respectively, were assigned to Si-O groups in nanosilica. A slight shift (6-23 cm-1
) was observed in the peaks of Si-O stretching and bending vibrations, and the C-O and C=O stretching vibrations, which was caused by the incorporation of EVAgMA in E1M3S (Table II). This suggests that the C=O and C-O-C groups of MA in EVAgMA interact with the hydroxyl groups on the SNP surface as well as carbonyl and C-O-C groups in EVA by hydrogen bonding and dipole-dipole interactions. Bikiaris et al. con-firmed the aforementioned interactions between the car-boxyl groups of PP-g-MA and the surface hydroxyl groups of SNP.9
Relative Melt Viscosity. Figure 2 shows the relative melt viscosity of the EVA/SNP nanocomposites, which is expressed by the torque in the melt mixing of EVA, SNP, and EVAgMA. The torque of the nanocomposites was higher than that of EVA. The internal friction generated in the mixing process
between the SNP and EVA matrix causes an increase in torque. Normally, the torque of the nanocomposites depends on the SNP content and increase with increasing SNP con-tent. In the presence of EVAgMA, the torque of the nano-composites increased due to the fine SNP dispersion in EVA and the adhesion between the SNP and EVA. The interac-tions between EVAgMA and other components in the nano-composites reduce the mobility of EVA chains. This leads to an increase in the torque of the E1M2S and E1M4S nano-composites compared to EVA.9
At the “equilibrium” state, the stable torque moment of EVA, E0M2S, E0M4S, E1M2S and E1M4S samples approached1.8; 7.3; 9.2; 10.0 and 10.3 MPa, respectively. The stable torque moment of the nano-composites using EVAgMA increased by between 12 and 37% compared to that of the nanocomposites without EVAgMA at the same SNP content.
Morphology. The interactions between the SNP and EVA matrix with and without EVAgMA in the EVA/SNP nano-composites were evaluated by FESEM (Figure 3). FESEM of the cryo-fractured surface of the nanocomposites without EVAgMA (Figure 3(a)-(d)) indicated an irregular dispersion of SNP in the EVA matrix. The SNP agglomerated to form large clusters in the EVA matrix, from 100 nm-2 µm, which causes a decrease in the mechanical properties of the nano-composites presented in Tensile Properties section.
For nanocomposites containing EVAgMA, the particle agglomerate sizes were less than 200 nm (Figure 3(e)-(h)). This suggests that the SNP are well dispersed and adhered to EVA due to the presence of EVAgMA. The decrease in particle agglomerate size can explain the increase in the mechanical properties and thermal stability of the nanocom-posites containing EVAgMA.9,15
Tensile Properties. Figure 4 shows the tensile strength of the EVA/SNP nanocomposites. The tensile strength of the nanocomposites at different EVAgMA and SNP contents was higher than that of the neat EVA (17.3 MPa). SNP can enhance the tensile strength of the nanocomposites due to interactions between the nanoparticles and EVA matrix at the molecular level.7
The tensile strength of the EVA/SNP nanocomposites with EVAgMA was higher than that of the Figure 2. Torque of EVA and the nanocomposites during melt
mixing.
Table II. Characteristic Wavenumbers of the SNP, EVA, E0M3S, and E1M3S Samples
Samples Wavenumbers (cm
-1
)
νOH νCH νC=O δCH νC-O νSi-O νSi-OH γCH δSi-O
SNP 3448 2921 2847 - - -1110 794 955 - 461 EVA - 2924 1737 1456 1368 1242 1025 724 -E0M3S 3500 29212852 1750 14631370 12411021 795 723 463 E1M3S 3612 3456 2925 1760 1457 1368 1244 1031 1127 804 - 724 482
EVA/SNP nanocomposites without EVAgMA. The maximum tensile strength of the nanocomposites was observed at 1 wt% EVAgMA. Similar results were also obtained in the
poly(ethylene 2,6-naphthalate)/silica nanocomposites,6
PP/ SiO2 nanocomposites9,12 and poly(ethyl
methacrylate-co-hydroxyethyl acrylate) (P(EMA-co-HEA))/silica nanocom-posites.11
Presumably, EVAgMA localized at the interface between the SNP and matrix polymer is responsible for the enhanced mechanical properties of the nanocomposites. The interactions and good dispersion between EVA and SNP can improve the mechanical properties of the nano-composites. On the other hand, the tensile strength showed a decrease tendency when the EVAgMA content in the nano-composites exceeded 1 wt%.
Similarly, at a constant EVAgMA content (1 wt%), the tensile strength of the nanocomposites increased with increas-ing SNP content. For example, at 2, 3, 4, and 5 wt% of SNP, the maximum tensile strength of the nanocomposites using 1 wt% EVAgMA was 23.2, 23.7, 24.1, and 25.4 MPa, respectively, showing a corresponding increase of 27.5, 28.8, 25.5, and 30.1%, compared to the samples without EVAgMA. This can be explained by the role of EVAgMA in inducing inter-molecular interactions between EVA and SNP leading to improved compatibility of the EVA and SNP phases. At an EVAgMA content less than 1 wt%, the amount of EVAgMA might not be sufficient to induce inter-molecular interactions between EVA and SNP. Therefore, the change in the tensile strength of the nanocomposites was not great. In contrast, the agglomeration of EVAgMA can occur when EVAgMA content exceeds 1 wt%, leading to an irregular dispersion of SNP into the EVA matrix. Therefore, the tensile strength of the nanocomposites can decrease.
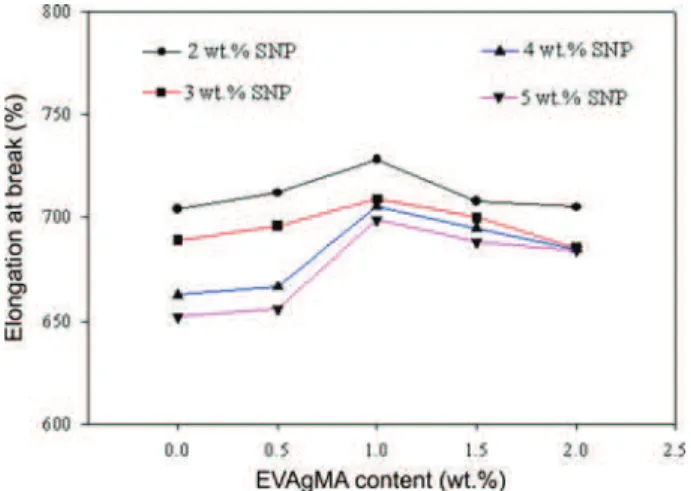
Figure 5 shows the elongation at break of the nanocom-posites with various EVAgMA and SNP contents. The elon-gation at break of EVA/SNP nanocomposites decreased with increasing SNP content in the EVA matrix because the hard and rigid SNP act as stress concentrators, providing less ductility to the nanocomposites. In particular, when the SNP content was increased to 4-5 wt%, the size of the
Figure 4. Eect of the EVAgMA and SNP content on the tensile strength of the EVA/SNP nanocomposites: 2 wt% SNP: (-•-), 3 wt% SNP: (--), 4 wt% SNP: (--), 5 wt% SNP: (- -).
Figure 3. SEM images of the cryo-fractured surface the EVA/ SNP nanocomposites; (a) E0M2S; (b) E0M3S; (c) E0M4S; (d) E0M5S; (e) E1M2S; (f) E1M3S; (g) E1M4S; (h) E1M5S.
Figure 5. Eect of the EVAgMA and SNP content on the elonga-tion at break of the EVA/SNP nanocomposites: 2 wt% SNP: (-•-), 3 wt% SNP: (--), 4 wt% SNP: (--), 5 wt% SNP: (- -).
agglomerated particles increased, indicating a higher stress concentration, more extensive cavitation and faster break-ing.9,11,12
The elongation at break of the EVA/SNP posites with EVAgMA was higher than that of the nanocom-posites without EVAgMA and reached the maximum at 1 wt%. Using a constant EVAgMA content (1 wt%), the max-imum elongation at break of the nanocomposites decreased with increasing SNP content.
Thermal Properties and Thermal Stability. The melting temperature of all EVA/silica nanocomposites with and without EVAgMA was observed at approximately 96o
C with marginal differences, as shown in Table III. On the other hand, when adding SNP and EVAgMA into EVA and the nanocomposites, the chain segments possessing vinyl acetate (VAc) units in the amorphous and ethylene chain segments in the secondary crystallization region could re-arrange.1,10,13,16
This might explain the slight decrease in overall
crystallin-ity (χc %).
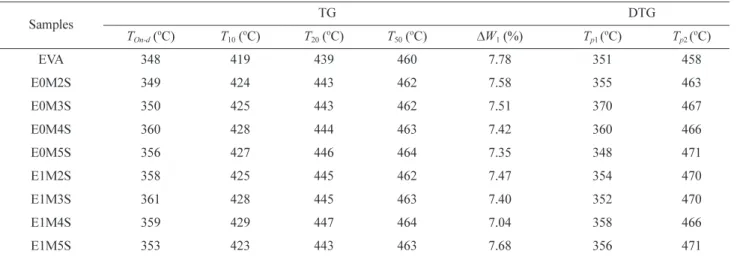
Figure 6 and Table IV respectively show TGA curves and the TG characteristic data of EVA and the EVA/SNP nano-composites. The weight loss of all samples is related to two steps of EVA degradation corresponding two temperatures with the maximal degradation rate (Tp1, Tp2). The first stage
was complete at approximately 400o
C, involving mainly autocatalytic deacetylation in the VAc moieties. The second stage is chain scission of the residual main polyethylene chains within an interval of 405-500o
C.1,10,17
When adding SNP to EVA, the weight loss in the 1st
stage (∆W1) of the
nanocom-posites was lower than that of EVA, and the onset tempera-tures (TOn-d), which are the temperatures corresponding to
10%, 20% and 50% weight loss (T10, T20, and T50), were higher
than those of EVA. This can be explained by the high thermal stability of SNP when the SNP are dispersed regularly in the EVA matrix, which have a protective agent and barrier effect for EVA at high temperature. Therefore, the thermal stability Table III. DSC Data of EVA and the EVA/SNP Nanocompositesa
Samples Tm-m ( o C) ∆Hf (J/g) χc (%) EVA 96.1 67.7 22.7 E0M2S 96.1 61.5 20.6 E0M3S 97.0 64.1 21.5 E0M4S 96.1 62.6 21.0 E0M5S 96.2 63.3 21.2 E1M2S 95.7 55.6 18.7 E1M3S 97.4 66.5 22.3 E1M4S 95.9 59.5 20.0 E1M5S 96.0 55.3 18.6 aT
m-m: melting temperature; ∆Hf: enthalpy of fusion; χc: relative
crys-tallinity.
Figure 6. TGA curves of EVA, E0M4S and E1M4S.
Table IV. TG and DTG Results of EVA and the EVA/SNP Nanocompositesa
Samples TG DTG TOn-d ( o C) T10 ( o C) T20 ( o C) T50 ( o C) ∆W1 (%) Tp1 ( o C) Tp2 ( o C) EVA 348 419 439 460 7.78 351 458 E0M2S 349 424 443 462 7.58 355 463 E0M3S 350 425 443 462 7.51 370 467 E0M4S 360 428 444 463 7.42 360 466 E0M5S 356 427 446 464 7.35 348 471 E1M2S 358 425 445 462 7.47 354 470 E1M3S 361 428 445 463 7.40 352 470 E1M4S 359 429 447 464 7.04 358 466 E1M5S 353 423 443 463 7.68 356 471 aT
On-d: the onset temperature of weight loss (weight loss at about 3%); T10: temperature corresponding to 10% weight loss; T20: temperature
cor-responding to 20% weight loss; T50: temperature corresponding to 50% weight loss; ∆W1: weight loss in the first stage; Tp1: temperature of the
of EVA increases in the presence of SNP.8,10
The TOn-d, T10, T20, and T50 were shifted to higher
tempera-tures, in range of 2-10o
C, due to the presence of EVAgMA in the EVA/SNP nanocomposites (Table IV). This suggests that EVAgMA can enhance the thermal stability of the EVA/ SNP nanocomposites. The EVA/SNP nanocomposites con-taining 1 wt% EVAgMA have lower ∆W1 values and higher
Tp1 and Tp2 than those of the nanocomposites without EVAgMA.
The peak positions of Tp1 and Tp2 (DTG data not shown)
might change with different EVAgMA content.10
X-Ray Diffraction. Figure 7 shows XRD patterns of SNP, EVA and different EVA/SNP nanocomposites, showing that SNP is amorphous. The broad peak might be due to the small size and incomplete inner structure of the particles.18
EVA possesses both crystalline and amorphous regions. Therefore, two sharp XRD peaks at 21.26o
2θ (110 plane) and 23.60o
2θ (200 plane) were observed for EVA. Accordingly, the XRD patterns of all EVA containing nanocomposites showed an intense peak at approximately 21o
2θ, which cor-responds to the crystalline regions, whereas the weak peak approximately 23o
2θ was assigned to the amorphous regions in EVA. The EVA crystalline or amorphous structural state appears to depend on the fraction of components in the nanocomposites. For the nanocomposites, however, the posi-tions of the XRD peaks did not shift significantly compared to those of neat EVA. This suggests that the crystalline struc-ture of EVA remains unchanged upon the addition of differ-ent SNP and EVAgMA contdiffer-ents during preparation of the EVA/SNP nanocomposites. No additional peaks were observed, which suggests no third phase in the nanocomposites.19
The relative intensity of these peaks decreased in all nano-composites, corresponding to a decrease in their overall crystallinity, as reported elsewhere.2,13,18
The change in the relative intensity of the peaks in the nanocomposites might be due to the crystal alignment during the preparation
pro-cess. Interestingly, the relative intensity of the diffraction peaks of the E1M3S samples was higher than the other sam-ples, indicating an enhancement of diffuse amorphous scat-tering and an increase in overall crystallinity. This is in accordance with the DSC results reported above.
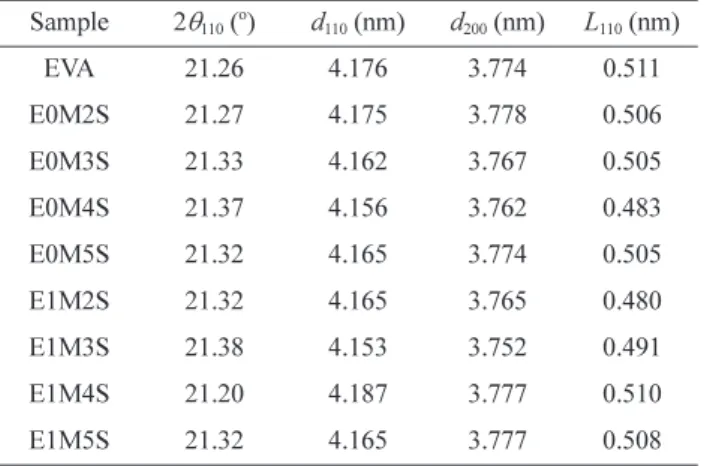
Table V lists the characteristic Bragg angles (2θ) and cor-responding d-spacing (d) determined from the Bragg’s equation (eq. (9) in ref. 13), as well as the lateral crystal size calculated using the Scherrer’s equation (eq. (10) in ref. 13) based on the XRD patterns. The addition of SNP and EVAgMA to EVA can reduce slightly the d-spacing and crystal domain sizes of EVA. The result might also be due to the role of EVAgMA in enhancing the compatibility between the SNP and EVA matrix. The decrease in the bulk crystallization rate and crystal domain sizes might result in a lower degree of crystallinity in EVA.18
Weatherability. Figure 8 shows the FTIR spectra of EVA and the EVA/SNP nanocomposites before and after the Figure 7. XRD patterns of the SNP, EVA and EVA/SNP
nano-composites with and without 1 wt% EVAgMA.
Table V. Diffraction Angle (2θ), d-Spacing (d), and Lateral Crystal Size (L) of SNP, EVA and EVA/SNP Nanocomposites with and without 1 wt% EVAgMA, Obtained from XRD
Sample 2θ110 ( o ) d110 (nm) d200 (nm) L110 (nm) EVA 21.26 4.176 3.774 0.511 E0M2S 21.27 4.175 3.778 0.506 E0M3S 21.33 4.162 3.767 0.505 E0M4S 21.37 4.156 3.762 0.483 E0M5S 21.32 4.165 3.774 0.505 E1M2S 21.32 4.165 3.765 0.480 E1M3S 21.38 4.153 3.752 0.491 E1M4S 21.20 4.187 3.777 0.510 E1M5S 21.32 4.165 3.777 0.508
Figure 8. FTIR spectra in the range 2000-1550 cm-1
of EVA and the nanocomposites after the 168 h accelerated weath-ering test.
accelerated weathering tests. The change in the characteristic peaks of the main functional groups in EVA and the nano-composites is related to the UV degradation of EVA initiated by the release of acetic acid from EVA. For the tested sam-ples, the growth in the absorption shoulder at approximately 1715 cm-1
was assigned to the carbonyl C=O stretching vibration in the rapidly forming ketone structure. The absorp-tion band at approximately 1630 cm-1
was assigned to the C=C stretching mode. This might be obtained during the acetaldehyde evolution process in the Norrish III photolysis reaction (Scheme I in ref. 10), or it might be obtained during the Norrish II reaction procedures forming vinyl, vinylidene and trans-vinylene unsaturated groups (Schemes I and II, IV in ref. 20 and ref. 10). The emergence of a new carbonyl
shoulder vibration at 1780 cm-1
was attributed mainly to lac-tone formation, as reported by Allen.21
A comparison of the non-polar ethylene chain segments showed that the VAc units are more vulnerable to heat, oxy-gen and UV light radiation, which can form reactive radi-cals or unstable hydro peroxide easily, and facilitate further irreversible chemical reactions. Along with the accumula-tion of unstable structures and oxygen penetraaccumula-tion, degrada-tion of the molecules extends from the surface to the entire sample (see Figure 10 later).
Figure 9 shows the retention of the tensile strength of the nanocomposites after the 72 and 168 h accelerated weathering test. The addition of EVAgMA and SNP to EVA led to an increase in the percentage retention of the tensile strength of Figure 9. Retention of the tensile strength after the 72 h (a) and 168 h (b) accelerated weathering test; 2, 3, 4, 5: 2, 3, 4, 5 wt% SNP.
Figure 10. SEM images of the nanocomposites after the accelerated weathering test; (a) EVA; (b) E0M3S; (c) E1M3S (magnification 100 times); (d) EVA; (e) E0M3S; (f) E1M3S (magnification 10,000 times).
the nanocomposites compared to that of neat EVA (24.3% after 72 h and 10.5% after 168 h compared to that of neat EVA before testing (17.3 MPa)).
At low EVAgMA contents (0-0.5 wt%), the retention in the tensile strength of all nanocomposites was similar. The retention of the tensile strength of the nanocomposites using EVAgMA tended to decrease except for the nanocomposites containing 3 wt% SNP. The increase in the accelerated weathering test time resulted in a decrease in retention in the tensile strength of all nanocomposites. This can be explained by a rearrangement in the crystalline region leading to cracks on the surface of the material (Figure 10). The chain scission gives rise to a stress concentration and crack propa-gation in the material, which leads to a further decrease in the mechanical properties.10,22
The nanocomposites contain-ing 3 wt% SNP at all EVAgMA contents showed the high-est retention in tensile strength due to the highhigh-est crystalline percentage, as shown in Table III.
Figure 10 presents FESEM images of the surface of the nanocomposites after the 168 h accelerated weathering test. The EVA film showed large, deep and linear cracks on both the surface and deep inside of the sample (Figure 10(a) and (d)). The E0M3S and E1M3S samples, however, showed some niches on the surface (Figure 10(b) and (e), Figure 10(c) and (f)). This suggests that the SNP can limit the decompo-sition of the EVA in the presence of UV radiation. In addition, the E1M3S sample showed no niches, whereas the E0M3S sample showed only a few small niches. Therefore, the E1M3S sample has better weatherability than that the E0M3S and EVA samples (Figure 9).
Conclusions
This study examined the effects of the addition of EVAgMA on the rheological, mechanical properties, thermal stability, crystalline structure and weatherability of the EVA/SNP nanocomposites. The use of EVAgMA produced remarkable enhancement in the relative melt viscosity, tensile strength, elongation at break, thermal stability and weatherability of the EVA/SNP nanocomposites. The overall crystallinity of EVA decreased when SNP and EVAgMA were added. Furthermore, the SNP dispersed evenly into EVA in the presence of EVAgMA might act a good UV stabilizer for EVA. In particular, the weatherability of the EVA/SNP nanocom-posites was clearly improved using only 1-1.5 wt% EVAgMA and 3 wt% SNP.
Acknowledgments. The authors would like to thank the National Foundation for Science and Technology Develop-ment of Vietnam (NAFOSTED, 104.04-2010.02) and
Viet-nam Academy of Science and Technology (VAST-CNRS of France Project of Corrosion and Protection of Materials in period 2011-2012) for the financial support. CSH also thanks to the National Research Foundation of Korea (NRF) Grant funded by the Ministry of Science, ICT & Future Planning, Korea (Acceleration Research Program (2013) and Pioneer Research Center Program (2013)).
References
(1) B. Wang, X. Wang, Y. Shi, G. Tang, Q. Tang, L. Song, and Y. Hu, Radiat. Phys. Chem., 81, 308 (2012).
(2) M. Sadeghi, G. Khanbabaei, A. H. S. Dehaghani, M. Sadeghi, M. A. Aravanda, M. Akbarzadec, and S. Khatti, J. Memb.
Sci., 322, 423 (2008).
(3) P. Cassagnau, Polymer, 44, 2455 (2008).
(4) S. Hui, T. K. Chaki, and S. Chattopadhyay, Polym. Eng. Sci., 50, 730 (2010).
(5) J. Kruenate, R. Tongpool, and P. Kongrat, J. Metastable
Nanocryst. Mater., 23, 227 (2005).
(6) S. H. Ahn, S. H. Kim, B. C. Kim, K. B. Shim, and B. G. Cho,
Macromol. Res., 12, 293 (2004) .
(7) S. H. Ahn, J. T. Park, J. H. Kim, Y. Ko, and S. U. Hong,
Macro-mol. Res., 19, 1195 (2011).
(8) E. S. Jang, S. B. Khan, J. Seo, K. Akhtar, J. Choi, K. I. Kim, and H. Han, Macromol. Res., 19, 1006 (2011).
(9) D. N. Bikiaris, A. Vassiliou, E. Pavlidou, and G. P. Karayan-nidis, Eur. Polym. J., 41, 1965 (2005).
(10) J. Jin, S. Chen, and J. Zhang, Polym. Degrad. Stab., 95, 725 (2010).
(11) A. Vallés-Lluch, G. G. Ferrer, and M. M. Pradas, Eur. Polym.
J., 46, 910 (2010).
(12) J. H. Chen, M. Z. Rong, W. H. Ruan, and M. Q. Zhang, Compos.
Sci. Technol., 69, 252 (2009).
(13) A. Shahin, S. Alireza, K. Mohammadreza, E. Alireza, P. Moham-madhadi, S. Mazinani, and A. Mehdi, Mater. Des., 33, 273 (2012).
(14) P. Liu, Q. Wang, X. Li, and C. Zhang, Colloids Surf. A:
Phys-icochem. Eng. Asp., 334, 112 (2009).
(15) H. J. Zhou, M. Z. Rong, M. Q. Zhang, and K. Friedrich, J.
Mater. Sci., 41, 5767 (2006).
(16) F. Laoutid, L. Ferry, E. Leroy, and J. M. L. Cuesta, Polym.
Degrad. Stab., 91, 2140 (2006).
(17) C. Nyambo, E. Kandare, and A. W. Charles, Polym. Degrad.
Stab., 94, 513 (2009).
(18) M. Jafarzadeh, I. A. Rahman, and C. S. Sipaut, Ceram. Int., 36, 333 (2010).
(19) M. Madani, Bull. Mater. Sci., 33, 65 (2010).
(20) R. Scaffaro, L. Botta, and G. Gallo, Polym. Degrad. Stab., 97, 653 (2012).
(21) N. S. Allen, M. Edge, M. Rodriguez, C. M. Liauw, and E. Fontan, Polym. Degrad. Stab., 68, 363 (2000).