HAL Id: hal-01724662
https://hal.insa-toulouse.fr/hal-01724662
Submitted on 23 Mar 2018HAL is a multi-disciplinary open access
archive for the deposit and dissemination of sci-entific research documents, whether they are pub-lished or not. The documents may come from teaching and research institutions in France or abroad, or from public or private research centers.
L’archive ouverte pluridisciplinaire HAL, est destinée au dépôt et à la diffusion de documents scientifiques de niveau recherche, publiés ou non, émanant des établissements d’enseignement et de recherche français ou étrangers, des laboratoires publics ou privés.
Optimising an expansion test for the assessment of
alkali-silica reaction in concrete structures
Xiao Xiao Gao, Stéphane Multon, Martin Cyr, Alain Sellier
To cite this version:
Xiao Xiao Gao, Stéphane Multon, Martin Cyr, Alain Sellier. Optimising an expansion test for the assessment of alkali-silica reaction in concrete structures. Materials and Structures, Springer Verlag, 2011, 44 (9), pp.1641-1653. �10.1617/s11527-011-9724-y�. �hal-01724662�
Optimizing
an expansion test for the
1assessment of alkali silica reaction in
2concrete structures
34
Xiaoxiao Gao, Stéphane Multon, Martin Cyr and Alain Sellier 5
Université de Toulouse; UPS, INSA; LMDC (Laboratoire Matériaux et Durabilité 6
des Constructions) 135, avenue de Rangueil; F-31 077 Toulouse cedex 4, France 7 8 Tel. +33-5-61-55-66-97 9 Fax +33-5-61-55-99-49 10
E-mail address: multon@insa-toulouse.fr 11 12 13 14 Abstract 15
This work is part of an overall project for the reassessment of concrete structures damaged by 16
ASR. The paper focuses on developing a laboratory method for expansion tests since the usual 17
tests appear to be difficult to use in expert assessment. The development involves optimizing the 18
storage conditions and the sizes of the specimen and aggregate. A combined effect of the 19
aggregate and specimen sizes on ASR expansion is thus pointed out: for a given mortar, the 20
expansion is lower in small specimens than in large specimens. Therefore, the ratio ‘specimen size 21
/ aggregate size’ has to be sufficiently high to decrease this scale effect and obtain relevant 22
measurements. The discussion proposes a method for always using comparable conditions during 23
the expansion tests and finally suggests how this test can be optimized to provide fast and relevant 24
results for use in structure reassessment. 25
Key Words: alkali-silica reaction (ASR), expansion test, aggregate size, 26
specimen size, scale effect 27
28 29
1. Introduction
1
Although several decades have passed since the first observations of ASR in 2
concrete, safety of the ASR-damaged structures is still a subject of concern for 3
owners. ASR involves the production of gels leading to an expansion of the 4
concrete. It directly affects the behaviour of the structure such as power dams. 5
However, other effects of ASR (e.g. cracking) should not be neglected, since it 6
can lead to secondary effects (e.g. steel corrosion, freezing and thawing damages) 7
which may be as important for the structure as the expansion achieved. 8
In this work, particular attention is paid to the assessment of future expansion of 9
the concrete in structures such as dams. It will determine whether it is possible to 10
continue to use these structures with or without repair and will help in structural 11
management. The most usual test is the residual expansion test at 38°C in air at 12
95% RH, which is performed on cores drilled from damaged structures [1-5]. 13
However, several criticisms can be made of this usual laboratory test: (1) the 14
reactive silica in the core of the aggregates is never reached in a short time 15
because of the large size of the aggregates used in structures (the asymptotic 16
expansion is not achieved after one year of measurement) [6], (2) the ASR-gels do 17
not have the same composition in accelerated tests as in real structures because of 18
the impact of temperature on chemical equilibrium [7] and the substitution 19
process between alkalis and calcium [8-10], (3) alkali leaching during the tests 20
can have a deleterious effect on the assessment of the asymptotic expansion [11-21
14], (4) the high moisture conditions (higher than 95% RH) are difficult to 22
control, which leads to significant variations of ASR expansions for RH ranging 23
between 95 and 100% [15]. It therefore seems unrealistic to use the ASR-24
expansions obtained on cores in accelerated conditions to assess the future 25
expansion of concrete in the damaged structures. This view has been proved 1
correct in the structural analysis of a French dam (small residual expansion in 2
accelerated laboratory test and significant expansion measured on the dam) [6]. 3
Therefore, a method has been proposed to obtain reliable experimental 4
information and avoid the uncertainty due to imperfect conditions of control in 5
laboratory tests [6]. In this method, the future ASR expansions are determined 6
through a finite elements analysis of the structures using two experimental data: 7
1) measurements performed directly on the structures to determine the 8
amplitude of ASR expansion, 9
2) laboratory expansion tests on aggregate extracted from the structures to 10
assess the expansion kinetics. 11
The laboratory tests are necessary to determine how the reaction advances 12
according to the size of the aggregate [6]. 13
The aim of this paper is to optimize the expansion test in terms of conditions of 14
storage, size of specimens and size of aggregates. Several experimental conditions 15
were assessed in order to rapidly evaluate the totality of the residual reactive 16
silica. The storage of the specimens should guarantee that all the residual reactive 17
silica is consumed in a short period of time. Tests were carried out in NaOH 18
solutions so that there was enough alkali to consume all the reactive silica, and at 19
60°C to accelerate the reaction. Alkalis had to reach all the reactive silica quickly. 20
Therefore, the specimens and the aggregates could not be too large in order to 21
decrease the time for alkalis to diffuse in the specimens and in the whole 22
aggregate. Finally, the tests were performed on several types of rocks to verify 23
whether they could differentiate between the reactivity of different aggregates. 24
2. Background
1
In order to use the results of expansion tests performed on specimens damaged by 2
ASR for structure requalification, it is necessary to understand the effect of the 3
size of the aggregate [16-31] and the size of the specimens [32-34] on the 4
measured expansion. With this in mind, the development of ASR expansion can 5
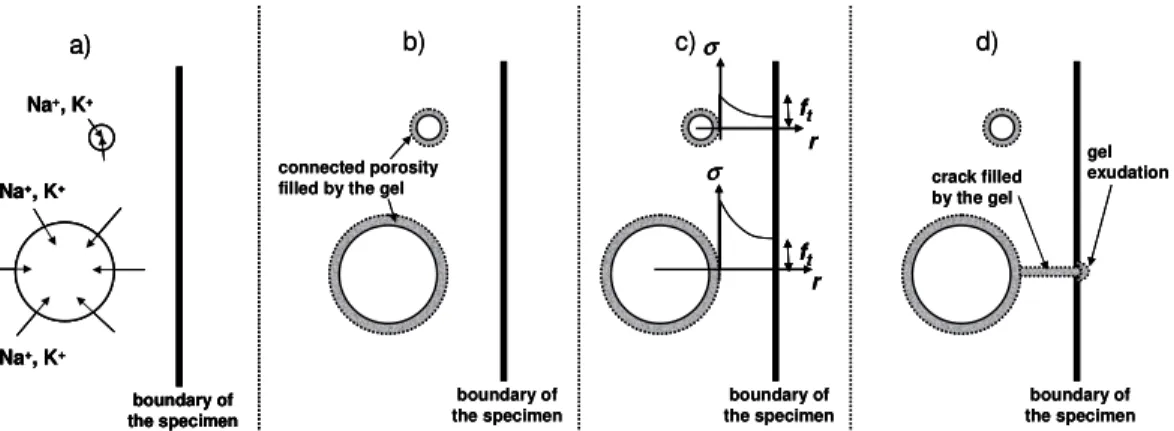
be described in several steps: 6
1. Alkalis present in the cement paste reach and diffuse into the aggregates 7
(Figure 1-a). 8
2. Alkalis react with reactive silica and create ASR gel in and/or around the 9
aggregate. The gel can fill the connected porous volume surrounding the 10
aggregate in a thickness tc without leading to damage [35-37] (Figure 1-b).
11
3. Once the connected porosity is filled, the pressure in the gels increases and 12
causes cracking of the aggregate and the cement paste surrounding the 13
aggregate [37]. The propagation of cracks in specimens with large ‘size of 14
the aggregate’ to ‘size of the specimen’ ratios is rapid and can occur for 15
low pressures whereas it is more difficult for larger specimens and needs 16
higher pressure (Figure 1-c). This scale effect can be justified by fracture 17
mechanics concepts [38, 39]. Indeed, in the framework of the fracture 18
mechanics, the maximal normal stress in the vicinity of an inclusion (e.g. 19
aggregate), which induces a pressure on the cement matrix,is given by: 20
( )
r K r I π σ 2 = (1)where σ is the maximal normal stress at the point M located at r, the distance from 21
the edge of the inclusion (Figure 1-c) and KI is the stress intensity factor obtained
22
from the relation: 23
⋅ = L R f p K a g I (2)
where f is a function increasing with the ratio Ra/L, with Ra, the radius of the
1
aggregate and with L, the dimension of the specimen, and pg, the gel pressure
2
which can be assessed from [37, 40]: 3
(
)
[
3 3]
3 3 4 3 4 a c a mol gel a g g M R sV R t R p = π −ϕ π + − (3)with Mg the gel elastic modulus, s the reactive silica content, Vgelmol the molar
4
volume of the gel, ϕ the concrete porosity, and tc the thickness along which the
5
gel can migrate from the aggregate to the cement paste. 6
Fracture mechanics concepts show that the greater the ratio ‘size of the aggregate’ 7
to ‘size of the specimen’, the larger the normal stress at a given distance from the 8
aggregate. Thus, the greater this ratio is, the smaller the pressure can be in the gel 9
to reach the tensile stress at the boundary of the specimen (Figure 1-c). 10
4. Once cracks have reached the boundary of the specimens, ASR-gels can 11
leach off through the porosity induced by cracking and the pressure in the 12
gels falls, which stops the expansion (Figure 1-d). If the cracks reach the 13
boundary of the specimens at lower pressure, i.e. for experiments with 14
high ‘size of the aggregate’ to ‘size of the specimen’ ratio, lower 15
expansions can be measured, as observed in previous experimental works 16
[31-32]. 17
An analysis of the background shows the importance of the concept of stress 18
intensity factor in the understanding of the development of ASR expansion in 19
concrete. The larger the stress intensity factor KI is, the faster cracks appear and
20
the cracking always leads to reduction of the expansion through gel permeation 21
and exudation. Therefore, for several expansion tests, the stress intensity factor KI
1
has to be constant to maintain comparable mechanical conditions. The aim of this 2
paper is first to optimize the expansion test but also to understand the effect of 3
specimen size and aggregate size on expansion. Thus the study was performed on 4
three sizes of specimens (20x20x160 mm, 40x40x160 mm and 70x70x280 mm) 5
and four sizes of aggregates (0-315 µm, 315-630 µm, 630-1250 µm and 1250-6 2500 µm). 7
3. Experimental conditions
8 3.1 Materials 9The cement used was a standard CEM I 52.5R (specific gravity: 3.1, surface area 10
(Blaine): 400 m2/kg). Its chemical composition is given in Table 1. Five 11
aggregates were used as crushed sands in the experiments: siliceous limestone 12
(SL), quartzite (Q), opal (O), quartz aggregate (QA) and marble (NR). Their 13
chemical compositions are given in Table 1. The first three aggregates are known 14
to be alkali-reactive and thus to develop ASR gels in a concrete environment. 15
They were chosen in different categories of rocks: sedimentary, metamorphic and 16
igneous. The reactive limestone (SL) contained mostly calcite and quartz, with 17
traces of dolomite, feldspars and phyllosilicates. Quartzite contained mainly 18
quartz with traces of muscovite and tridymite, opal contained principally quartz 19
and tridymite. The last two aggregates were considered as reactive. The non-20
reactive marble was almost exclusively composed of calcite. The aggregate in the 21
tests included four classes of reactive aggregates: C1 (0-315µm), C2 (315-22
630µm), C3 (630-1250µm) and C4 (1250-2500µm), and one class of non-reactive 23
aggregate (0-2500µm). 24
3.2 Sample preparation
1
Mortars had a water/cement ratio of 0.5 and a sand (1512 kg/m3) / cement (504 2
kg/m3) ratio of 3. For the reference specimens, the sand was only composed of the 3
non-reactive marble. For all the other specimens, the sand contained 30% of the 4
aggregate under study and 70% of non-reactive marble. Mixtures were adjusted to 5
fixed alkali contents (Na2Oeq) by adding NaOH in the mixing water in order to 6
have an alkali concentration in the pore solution close to the concentration in the 7
storage solution (0.77, 1.0 and 1.25 mol/l). 8
3.3 Expansion measurements
9
Deformation was measured on mortar prisms (20x20x160 mm, 40x40x160 mm 10
and 70x70x280 mm) using the scale micrometer method (specimens had 11
shrinkage bolts in the two extremities). Each length change value was the mean of 12
three values from three replicate specimens. Expansion measurements were 13
performed after the prisms had cooled to 20ºC (~12h) in the NaOH solution. 14
3.4 Specimen storage
15
3.4.1 Procedure 16
After demoulding, the specimens were first kept in sealed bags at 20°C for 14 17
days. Then, they were immersed in NaOH solution for the 14 following days. The 18
aim of this step was to obtain the same concentration of alkali in the pore solution 19
as in the storage solution. It was also intended to decrease the non-ASR expansion 20
due to water absorption. The expansions were measured during this period, and 21
the same amplitudes were obtained for both reactive and reference specimens. 22
Thus, it was deduced that the expansions of the reactive specimens in this period 23
were due to water absorption, and they were therefore neglected in the following 1
analyses. After this period, the temperature of the solutions was increased to 2
60°C. 3
3.4.2 Choice of the solution concentration 4
In order to test the effect of alkali concentration on ASR expansion, mortars 5
containing siliceous limestone were kept in three different concentrations: 0.77, 6
1.0 and 1.25 mol/l. The mortars contained 15% of the size class C2, 15% of the 7
size class C3 and 70% of the non-reactive aggregate. The solutions were changed 8
at about 250 days in order to verify if the alkali concentrations were still sufficient 9
to react with aggregate. 10
The curves of the reactive mortars showed high initial rates of swelling (Figure 2), 11
followed by a low rate of expansion up to a final asymptote. The final expansions 12
for the three concentrations 0.77, 1.0 and 1.25 mol/l were 0.70%, 0.65% and 13
0.60% respectively. The difference between two consecutive concentrations 14
appeared to be negligible considering that the standard deviation for the 15
specimens was in the range of 0~0.02%. Finally, no changes were observed in the 16
expansion rates at 250 days when the solutions had been changed (Figure 2). 17
Thus, the alkali concentrations could be considered to have little influence on 18
ASR expansions in our tests, and a NaOH concentration of 1 mol/l was chosen for 19
the following tests. 20
4. Combined effect of aggregate and specimen
1sizes
2 4.1 Mortar mixtures 3In order to study the effect of the size of the specimens, three kinds of prisms 4
were used: 20x20x160 mm, 40x40x160 mm and 70x70x280 mm. The particle size 5
distributions were obtained by adding 30% of reactive aggregate of the four 6
different size classes:C1 (0-315 µm), C2 (315-630 µm), C3 (630-1250 µm), C4 7
(1250-2500 µm) to 70% of a continuous size distribution (0–2500 µm) of non-8
reactive aggregate, the particle size distributions were different for the five 9
mortars. A previous study on these kinds of mixtures [40] had shown that the 10
effect of the difference of particle size distributions on the porosity of mortars did 11
not appear to be significant. The reference prisms were made with 100% of non-12
reactive aggregate. During the experiments, all mortar prisms were stored at 60°C 13
in the 1 mol/l NaOH solution. 14
4.2 Experimental results
15
In order to assess mass variations and expansions only due to ASR, net values 16
were calculated and used in the following parts of the study. They were obtained 17
by subtracting the measurements of reference mortars (without reactive aggregate) 18
from those obtained on the reactive specimens. Figures 3, 4 and 5 present the 19
mass variations and the ASR expansions obtained on 20x20x160 mm, 20
40x40x160 mm and 70x70x280 mm specimens, respectively. All the curves show 21
a high and increasing initial rate of mass and swelling with time, followed by a 22
decrease of the rate until a long-term asymptote is reached. 23
In addition to the expansion measurement, the cracking patterns were observed 1
and the crack widths were measured at 290 days with a video-microscope (Figure 2
6). Crack widths were assessed on 15 points taken in at least 15 regions of the 3
specimens in order to obtain relevant average values. No cracking was observed 4
for the reference prisms and for the prisms containing the particles of size C1 5
(0~315µm), which is in accordance with the small expansion. For the other 6
specimens, the crack widths are given in Table 2. The largest specimens 7
(70x70x280 mm) presented the widest cracks (Figure 6 and Table 2). The smallest 8
prisms (20x20x160 mm) had the smallest cracks (Figure 6 and Table 2), which 9
were below the measurement limit of the video-microscope (< 10 µm). The 10
differences between crack widths of mortars containing different aggregate sizes 11
were not significant (Table 2). 12
4.3 Effect of specimen size
13
Analysis of the ASR expansions demonstrated the significant effect of the size of 14
specimens. First, the largest specimens showed the slowest rate of ASR-expansion 15
whatever the aggregate size (Figure 7). This can be explained by the diffusion of 16
the alkalis into the specimens. The initial alkali concentration in the pore solution 17
was sufficient to initiate the reaction. Alkalis were quickly consumed by the ASR 18
gel and supplementary alkalis were necessary to maintain gel production. These 19
alkalis came from the solution and diffused into the mortar. Thus, they needed 20
longer to reach the centre of the largest specimens than the small ones. 21
The second effect was on the amplitude of the asymptotic ASR expansion, where 22
the largest specimens showed the highest asymptotic ASR expansion (Figure 7). 23
This was particularly significant on the large aggregate class 1250-2500 µm (ASR 24
expansions were twice as large for the 70 mm size specimens as for the others). 25
This observation shows the significant coupling effect between specimen size and 1
aggregate size and confirms the anticipations explained in the ‘background’ 2
section. 3
For the same size of aggregate, the proportion of aggregate particles close to the 4
surface of the prism compared to the total aggregate increases with decreasing 5
cross section of the prism. The gel created by the aggregate particles close to the 6
surface of the prism is lost more easily than for the inner particles. In 7
consequence, for the same size of aggregate, the smaller the specimen, the more 8
significant the amount of gel lost by the cracks. This would explain the lower 9
expansion measured (Figure 7). 10
In order to quantify the combined effect of the aggregate and the specimen size, 11
the ASR-expansion versus the ratio of the specimen size to reactive aggregate size 12
is plotted in Figure 8. For small aggregates (circled in Figure 8), the ASR-13
expansions were small due to the effect of the connected porous volume as 14
explained in the ‘background’ section. For larger aggregates, the ‘prism size / 15
particle size’ ratio had an important effect on measured expansions even for ratios 16
greater than 100. For example, the 315-630 µm aggregates presented expansion 17
about 20% larger for the 70x70x280 mm specimens (ratio equal to 200) than for 18
the 40x40x160 mm ones (ratio equal to 100 – Figures 7-a and 8). Such ratios are 19
largely higher than usual values, typically between 5 to 10, taken to choose a 20
specimen size according to aggregate size for compressive strength for example. 21
Therefore, it appears to be impossible to break free of this scale effect when 22
performing expansion tests, which leads to part of the expansion being neglected 23
compared to structural conditions. It is thus necessary to take this fact into account 24
when analysing the expansion tests that can be carried out with the theoretical 25
development presented in the background. 26
4.4 Effect of aggregate size
1
The effect of the reactive aggregate size on the ASR expansion has already been 2
extensively studied. Research has shown that the ASR expansion increases as the 3
reactive particle size is reduced. It could be noted that contrary results were found 4
for ACR (alkali-carbonate reaction) [41], since the higher expansions were found 5
for the larger aggregates. The cases of ASR have been researched in the works of 6
Hobbs and Gutteridge [21], Zhang et al. [22] and Kuroda et al. [23], who obtained 7
maximum expansions for size classes of 150-300 µm (opal), 80-150 µm (quartz 8
glass) and 150-300 µm (andesite), respectively. However, when the experiments 9
are performed with particles smaller than a few tens of a µm, it has frequently 10
been shown that the expansion does not increase continuously with the reduction 11
of particle size. Some authors obtained insignificant expansion when the sizes of 12
the reactive particles were under 50 to 150 µm [17, 24, 25]. Only a few exceptions 13
of very small particles led to significant ASR expansions, all involving opal 14
aggregates [16, 26, 27]. Other research works clearly show a pessimum effect for 15
particle size, but for particles much larger than 100 µm [16, 17, 28-30]. These 16
investigations were usually performed on specimens of the same size. The 17
originality of the study presented here is to have used three sizes of specimens 18
with the same aggregate classes. 19
For all the specimens, it can be observed that the prisms containing small reactive 20
particles (0-315 µm) have the lowest expansion (lower than 0.15% - Figures 3 to 21
5). For the three other aggregate sizes, the ASR expansions are significant and 22
higher than 0.5%. The difference of ASR expansions for the small aggregate can 23
be explained by the effect of the connected porosity. For the smallest aggregates, 24
more of the gel can migrate in this connected porosity than for larger aggregates 25
and thus little ASR gel is available to cause expansion [37, 40]. In other words, it 1
is easier for the texture to accommodate a large number of small expansion sites 2
than a small scattered number of larger sites. At 150 days, the ASR expansion 3
presents a pessimum effect whatever the specimen size (Figure 9-a), as already 4
observed during previous investigations. But, after 400 days, when asymptotic 5
expansions had been reached, the pessimum had totally disappeared for the largest 6
specimens (Figure 9-b). For the largest aggregates, part of the difference of 7
expansion can be explained by a delay in the ASR expansion due to the diffusion 8
of the alkali in the aggregate [40]. The results of measurement confirm that the 9
expansion rate was slower in the largest particles whatever the size of the 10
specimens (Figures 3 to 5). However, even when the asymptotic value was 11
reached, ASR expansion remained lower for the largest aggregates in the smallest 12
specimens (Figure 9-b). This result shows that the pessimum effect is not only due 13
to the diffusion of alkalis in the aggregate, meaning that it is not an intrinsic 14
phenomenon but could be due to a scale effect that depends on the ‘specimen size 15
/ aggregate size’ ratio. 16
In addition, the pessimum effect of aggregate size appears to be related to the 17
expansion capacity of the mortars. Compared with a previous study [38] which 18
was performed on mortars kept in saturated atmosphere (R.H. > 95%), the present 19
study showed a pessimum effect moving towards smaller aggregate. The mortars 20
conserved in the alkali solution were more expansive than the specimens in 21
saturated atmosphere due to the presence of sufficient alkali. Thus, it can be 22
concluded that the more expansive the mortar is, the more significant is the scale 23
effect. This can be explained by equations 1 to 3. The mortar is very expansive, 24
which means that more gel is produced (i.e. the gel molar volume is higher), and 25
then the gel pressure is larger than for less expansive mortar (equation 3). The 26
cracks appear for a constant value of the stress factor KI. In consequence, if the
1
pressure increases, the function f referred to Ra/L must become smaller to keep KI
2
constant. This means that the ratio Ra/L decreases and explains why the pessimum
3
moves towards smaller aggregate. 4
5. Tests on aggregates of different types
5
The aim of this part was to study the expansion test on several types of aggregate 6
to verify how it could differentiate between the reactivity of different aggregates. 7
5.1 Mortar mixtures
8
In previous investigations [38], the reactive aggregate of sizes 315-630 µm and 9
630-1250 µm showed the same expansion. Therefore, it was decided to use 10
aggregate of size 315-1250 µm for these experiments. The mortars had the 11
following particle size distribution: 30% of 315-1250 µm and 70% of the non-12
reactive marble of size 0-2500 µm. The test aggregates included four types: 13
siliceous limestone, quartzite, opal and quartz. All the mortars were conserved in 14
a 1 mol/l NaOH solution at 60°C. 15
5.2 Results
16
The ASR expansions obtained for these four aggregates are plotted in Figure 10. 17
After a slight delay, the mortar containing opal appeared to be the most reactive, 18
with rather fast expansion and an asymptotic value of about 1.35%. The expansion 19
of the mortar containing siliceous limestone was also quite rapid, but the final 20
expansion was less (about 0.6%). The mortar with quartzite aggregate presented a 21
slow expansion rate at the beginning but reached a final value about 0.5%, which 22
was quite close to that of the siliceous limestone. ASR expansion of the mortar 23
with quartz aggregate was about 0.14%, which was small compared to the other 1
three (10%~28%). These results are consistent with experimental feedback on 2
these aggregates. Opal is known to be very reactive and to present large expansion 3
if the amount of available alkali is sufficient, while the other two potentially 4
reactive aggregates (siliceous limestone & quartzite) are usually less reactive and 5
present similar ASR expansions. In fact, owing to the large pressure developed by 6
ASR gels, the specimens containing opal were greatly damaged and cracked 7
(crack width of about 425 µm – Figure 11). The analysis performed in the 8
‘background’ section suggests that a great proportion of the ASR gel should have 9
permeated through these large cracks and thus not contributed to the expansion. 10
This was due to the large amount of reactive silica contained in opal, which 11
induced high gel pressure (Equation 3) and thus a greater stress intensity factor 12
(Equation 2) for opal than for the siliceous limestone. 13
6. Discussion
14
The previous observations show the difficulty of obtaining a fast but relevant 15
expansion test on specimens. In expert assessments, the owners of structures often 16
expect fast results. To this end, it is interesting to note that the time necessary to 17
reach the expansion asymptote (assumed here to be reached when the difference 18
between two consecutive measured expansions is lower than 0.015% ) increases 19
with the specimen and the aggregates sizes (Table 3). This influence can be 20
explained by the the diffusion of ionic species into the specimen and the 21
aggregates. Thus, the shortest time necessary to achieve expansion is about 22
56 days (Table 3), obtained for the smallest specimens (20x20x160 mm) and for 23
aggregate class C2 (315-630µm). For larger aggregates and specimens, the time is 24
always longer than 100 days (Table 3). Moreover, it is always difficult to obtain 25
adequate amount of material from existing structures that are still in use. From 1
this point of view, too, working on small specimens is interesting. The most 2
relevant, fast and convenient tests should use small expansive particles (315-3
630 µm) and small specimens (20x20x160 mm). But, in this condition, a part of 4
the expansion is neglected because of the combined effect of aggregate and 5
specimen size (expansions measured on 20x20x160 mm specimens are 30% lower 6
than expansions obtained on 70x70x280 mm specimens). Moreover, section 5 7
showed the effect of the aggregate type on cracking due to differences in reactive 8
silica content. This could influence the analysis of the measured expansions. 9
In order to use expansion tests in predictive calculations, it is necessary to clarify 10
all the phenomena and quantify all the parameters involved during expansion. In 11
particular, the scale effect, which could make the measurements vary wildly 12
according to expansion conditions (storage, reactive silica content), should be 13
carefully considered. The parameters of the scale effect on ASR expansions 14
measured on specimens are defined in equations 2 and 3 of the first part of the 15
paper. In order to decrease the influence of this scale effect on ASR expansion, 16
the stress intensity factor KI (equation 2) should be the same for the different
17
expansion tests, which means that the constants D1 and D2 in equations (4) and 18 (5) should be fixed. 19
(
)
[
]
1 3 3 3 3 4 3 4 D R t R sV Ra gelmol−ϕ π a+ c − a = π (4) 2 D L Ra = (5)Once D1 and D2 are fixed, the aggregate size can be calculated with equation 4.
20
The values of Vgel
mol and tc can be taken from previous papers (Vgelmol of about
20.10-6 m3/mol and t
c of about 10 µm in [37] and [40]). Then the specimen size
1
can be obtained with equation 5. 2
For example, in the case of the expansion tests on siliceous limestone and opal 3
aggregates, the reactive silica content was 3000 mol/m3 for the siliceous limestone 4
and 23000 mol/m3 for opal. For the mortars of siliceous limestone, the aggregate 5
class C2 (315-630 µm) and the specimen size 20x20x160 mm were chosen, thus 6
D1 and D2 were equal to 2.E-12 m3 and 0.012. In order to have the same stress
7
intensity factor for opal as for siliceous limestone, the aggregate size (the mean 8
diameter) obtained by equation 4 should be about 215 µm and the specimen size 9
should be about 10 mm. With such experimental conditions, the ASR-expansions 10
for these two aggregates could be compared with more reliability. 11
7. Conclusions
12
The main aim of this paper was to analyse the expansion test in terms of storage 13
conditions, size of specimens (20x20x160 mm, 40x40x160 mm and 14
70x70x280 mm), and size of aggregate (0-315 µm, 315-630 µm, 630-1250 µm 15
and 1250-2500 µm) in order to obtain fast and relevant expansions. This test is 16
part of an overall methodology using measurements performed directly on 17
structures, finite element calculations and laboratory expansion tests on aggregate 18
extracted from structures to assess the expansion kinetics. The tests are used to 19
assess the residual reactive silica in the aggregates of various sizes used in the 20
structure to determine the advancement of the reaction according to the size of the 21
aggregate and thus to assess the kinetics of future expansions [6]. 22
The following conclusions can be drawn: 23
• The expansion tests in three concentrations of NaOH solution (0.77 mol/l, 1
1 mol/l, 1.25 mol/l) showed that, in the condition of abundant alkalis, the 2
expansion is not influenced by the alkali concentration. 3
• For the same size of aggregate, small prisms needed the shortest time to 4
achieve final expansions. For the same size of specimen, small-sized 5
aggregate took the shortest time to reach the final expansions. These 6
results can be explained by the faster diffusion of ionic species into the 7
porosity of small prisms and into the aggregate. 8
• A combined effect of the aggregate and specimen sizes on ASR 9
expansions has been highlighed. It appears that, even with a ‘specimen 10
size / aggregate size’ ratio higher than 100, the scale effect still exists. It 11
can be explained by the proportion of ASR gels that permeate out of the 12
specimens, causing a decrease of the gel pressure and thus reducing the 13
induced expansion. 14
• The most relevant, fast and convenient tests should use small reactive 15
particles (315-630 µm) and small specimens (20x20x160 mm). But in this 16
condition, a part of the expansion is neglected because of the coupled 17
effect of aggregate and specimen size. So the results should be analyzed 18
through the concept of stress intensity factor in order to take all the 19
parameters into account in the measured ASR expansions 20
• Even if the expansion measurements are used through a finite element 21
analysis, the expansion tests should be performed in comparable 22
conditions. Therefore, nonlinear effects due to connected porosity or 23
cracking should be avoided or well enough understood to be taken into 24
consideration. Under this consideration, a methodology which takes 25
account of this effect has been proposed (in 6. Discussion) to make 1
relevant expansion test. The validity of the method should be evaluated in 2 future experiments. 3 4
8. References
5[1] Bérubé MA, Frenette J, Pedneault A, and Rivest M (2002) Laboratory 6
assessment of the potential rate of ASR expansion of field concrete. J. Cem 7
Concr Aggr (ASTM) 24(1): 13-19 8
[2] Fasseu P and Mahut B, eds (2003) Guide méthodologique : Aide à la 9
gestion des ouvrages atteints de réactions de gonflement interne. LCPC, 10
« techniques et méthodes des LPC » collection, Paris, France (in French) 11
[3] Multon S, Barin FX, Godart B, Toutlemonde F (2008) Estimation of the 12
Residual Expansion of Concrete Affected by AAR. ASCE J Mater Civ Eng 13
20(1): 54-62 14
[4] B.C. A.,(1992) The diagnosis of alkali-silica reaction-Report of a working 15
party, British Cement Association, Wexham Springs, Slough, U.K. 16
[5] I.S.E.,(1992) Structural effects of alkali-silica reaction-Technical guidance 17
appraisal of existing structures. The Institution of Structural Engineers, 11 18
Upper Belgrave Street, London, U. K. 19
[6] Sellier A, Bourdarot E, Multon S, Cyr M, Grimal E (2009) Combination of 20
Structural monitoring and laboratory tests for the assessment of AAR-21
swelling - Application to a gate structure dam. ACI Mater J 106(3): 281-22
290. 23
[7] Urhan S. (1987) Alkali Silica and Pozzolanic Reactions in concrete. Part 1 : 1
interpretation of published results and an hypothesis concerning the 2
mechanism. Cem Concr Res 17(1): 141-152 3
[8] Lagerblad B, Trägardh J (1992) Slowly reacting aggregates in Sweden – 4
Mechanism and conditions for reactivity in concrete, 9th International 5
Conference on Alkali-Aggregate Reaction in Concrete, Concrete Society 6
Publication CS 106, Vol 2, London, Great-Britain, pp 570-578 7
[9] Jensen V (1993) Alkali Aggregate Reaction in Southern Norway, Doctor 8
Technicae Thesis, Norwegian Institute of Tehcnology, University of 9
Trondheim, Norway, pp 262 10
[10] Duchesne J, Bérubé MA (1994) Discussion of the Paper "The effectiveness 11
of supplementary cementing materials in suppressing expansion due to ASR 12
– Part 1, Concrete expansion and portlandite depletion". Cem Conc Res 13
24(8): 1572-1573 14
[11] Rogers CA, Hooton RD (1991) Reduction in Mortar and Concrete 15
Expansion with Reactive Aggregates Due To Alkali Leaching. Cem Concr 16
Aggr 13(1): 42-49 17
[12] Bérubé MA, Duchesne J, Dorion JF, Rivest M (2002) Laboratory 18
assessment of alkali contribution by aggregates to concrete and application 19
to concrete structures affected by alkali-silica reactivity. Cem Concr Res 20
32(8): 1215-1227 21
[13] Rivard P, Bérubé MA, Ollivier JP, Ballivy G (2003) Alkali mass balance 22
during the accelerated concrete prism test for alkali-aggregate reactivity. 23
Cem Concr Res 33(8): 1147-1153 24
[14] Rivard P, Bérubé MA, Ollivier JP, Ballivy G (2007) Decrease of pore 1
solution alkalinity in concrete tested for alkali-silica reaction, Mater Struct 2
40(9): 909–921 3
[15] Poyet S, Sellier A, Capra B, Thèvenin-Foray G, Torrenti JM, Tournier-4
Cognon H, Bourdarot E (2006) Influence of water on Alkali-Silica 5
Reaction: Experimental study and numerical simulations. ASCE J Mater 6
Civ Eng 18(4): 588-596 7
[16] Diamond S, Thaulow N (1974) A study of expansion due to alkali-silica 8
reaction as conditioned by the grain size of the reactive aggregate. Cem 9
Concr Res 4(4): 591-607 10
[17] Zhang X, Groves GW (1990) The alkali-silica reaction in OPC-silica glass 11
mortar with particular reference to pessimum effects. Adv Cem Res 3(9): 9-12
13 13
[18] Vivian HE (1951) Studies in cement-aggregate reaction. XIX: The effect on 14
mortar expansion of the particle size of the reactive component in the 15
aggregate, Australian, J Appl Sci 2: 488-494 16
[19] Xie Z, Xiang W, Xi Y (2003) ASR Potentials of Glass Aggregates in Water-17
Glass Activated Fly Ash and Portland Cement Mortars. J Mater Civ Eng 18
15(1): 67-74 19
[20] Ramyar K, Topal A, Andic O (2005) Effects of aggregate size and 20
angularity on alkali–silica reaction. Cem Concr Res 35(11): 2165-2169 21
[21] Hobbs DW, Gutteridge W (1979) Particle size of aggregate and its influence 22
upon the expansion caused by the alkali-silica reaction. Mag Concr Res 23
31(109): 235-242 24
[22] Zhang CZ, Wang AQ, Tang MS., Wu BQ., Zhang NS., Influence of 1
aggregate size and aggregate size grading on ASR expansion. Cem Concr 2
Res 29(9): 1393-1396 3
[23] Kuroda T, Inoue S, Yoshino A, Nishibayashi S (2004) Effects of particle 4
size, grading and content of reactive aggregate on ASR expansion of 5
mortars subjected to autoclave method, 12th International Conference on 6
Alkali-Aggregate Reaction in Concrete, Tang M. and Deng M. (Editors), 7
Beijing, China, pp 736-743 8
[24] Kawamura M, Takemoto K, Hasaba S (1983) Application of quantitative 9
EDXA analyses and microhardness measurements to the study of alkali-10
silica reaction mechanisms, 6th International Conference of Alkalis in 11
Concrete, Idorn G.M. and Rostam S. (Editors), 310 Copenhagen, Denmark, 12
pp 167-174 13
[25] Kodama K, Nishino T (1986) Observation around the cracked region due to 14
alkali-aggregate reaction by analytical electron microscope. 7th 15
International Conference on Alkali- Aggregate Reaction in Concrete, 16
Grattan-Bellew P.E. (Editor), Ottawa, Canada, pp 398-402 17
[26] McConnell D, Mielenz RC, Holland WY, Greene KT (1947) Cement-18
aggregate reaction in concrete. ACI J, Proceedings 44(2): pp 93-128 19
[27] Kelly TM, Schuman L, Hornibrook FB (1948) A study of alkali-silica 20
reactivity by means of mortar bar expansions. ACI J, Proceedings 45(1): 21
pp.57-80 22
[28] Lenzner D, Ludwig U (1980) Alkali aggregate reaction with opaline 23
sandstone. 7th International Congress on the Chemistry of Cement, Septima 24
(Ed.), Paris, France, 3: pp.VII-119 - VII-123 25
[29] Baronio G, Berra M, Montanaro L, Delmastro A, Bacchiorini A (1987) 1
Couplage d’action de certains paramètres physiques sur le développement 2
de la réaction alkalis granulats, From Materials Science to Construction 3
Materials Engineering. 1st International RILEM Congress on Durability of 4
Construction Materials, Versailles, France, 3: pp 919-926 5
[30] Feng NQ, Hao TY, Feng XX (2002) Study of the alkali reactivity of 6
aggregates used in Beijing. Mag Concr Res 54 (4): 233-237 7
[31] Bakker RFM (1983) The influence of test specimen dimensions on the 8
expansion of reactive alkali aggregate in concrete. Proceeding of the 6th 9
ICAAR, Copenhagen, Denmark, 369-375 10
[32] Zhang C, Wang A, Tang M, Zhang N (1999) Influence of dimension of test 11
specimen on alkali aggregate reactive expansion, ACI Mater J 96(2): 204-12
207 13
[33] Duchesne J, Bérubé MA (2003) Effect of the cement chemistry and the 14
sample size on ASR expansion of concrete exposed to salt. Cem Concr Res 15
33(5): 629–634 16
[34] Smaoui N, Bérubé MA, Fournier B, Bissonnette B (2004) Influence of 17
specimen geometry, direction of casting, and mode of concrete 18
consolidation on expansion due to ASR. Cem Concr Aggr 26(2): 58-70 19
[35] Furusawa Y, Ohga H, Uomoto T (1994) An analytical study concerning 20
prediction of concrete expansion due to alkali-silica reaction, in Malhotra 21
(ed.), 3rd Int. Conf. on Durability of Concrete, Nice, France, pp 757–780. 22
SP 145-40 23
[36] Poyet S, Sellier A, Capra B, Foray G, Torrenti JM, Cognon H, Bourdarot E 24
(2007) Chemical modelling of Alkali Silica reaction: Influence of the 25
reactive aggregate size distribution. Mater Struct 40 (2): 229–239. 26
[37] Multon S, Sellier A, Cyr M (2009) Chemo–mechanical modeling for 1
prediction of alkali silica reaction (ASR) expansion. Cem Concr Res 39 (6): 2
490-500 3
[38] Lemaître J, Chaboche JL (1988) Mécanique des Matériaux Solides, Dunod 4
(Eds.), Paris, France 5
[39] François D, Pineau A, Zaoui A (1993) Comportement mécanique des 6
matériaux : viscoplasticité, endommagement, mécanique de la rupture, 7
mécanique du contact, Hermes (Eds.) 8
[40] Multon S, Cyr M, Sellier A, Diederich P, Petit L (2010) Effect of aggregate 9
size and alkali content on ASR expansion. Cem Concr Res 40 (4): 508–516 10
[41] H.Sommer, P.J. Nixon,and I. Sims (2005), AAR-5: Rapid preliminary 11
screening test for carbonate aggregates, Mater. Struct. 38(8), 787-792 12
1
Table1: Chemical compositions of cement and aggregate (% by mass) 2
SiO2 Al2O3 Fe2O3 CaO MgO Na2O K2O Na2Oeq SO3 LOI
Cement 20.1 5.6 2.0 62.5 3.1 0.2 0.9 0.8 3.2 1.7 Non-reactive marble - - - 54.4 0.5 0.001 - - 0.01 43.0 Siliceous limestone 15.4 1.5 0.7 40.4 1.4 0.4 0.4 0.7 4.2 35.6 Quarzite 87.7 4.0 1.0 0.4 0.2 0.1 0.9 0.7 0.1 1.1 Opal 92.7 -- 0.3 0.2 0.1 0.2 0.1 0.2 1.1 6.0 Quartz 92.2 3.7 1.1 0.1 0.1 - 0.01 0.01 0.2 0.6 3 4
Table2: Crack widths for various aggregate and specimen sizes (µm) 5 Spec. size Agg. size 20x20x160 mm 40x40x160 mm 70x70x280 mm C1/0-315 µm <10 <10 <10 C2 / 315-630 µm <10 50 360 C3 / 630-1250 µm <10 60 335 C4 / 1250-2500 µm <10 55 300 Average <10 µm ~ 55 µm ~ 335 µm 6 7
Table 3: Time necessary to achieve expansion for various aggregate and specimen sizes (days) 8 315-630µm 630-1250µm 1250-2500µm 20x20x160 mm 56 120 148 40x40x160 mm 134 148 302 70x70x280 mm 301 342 393 9 10 11
Na+, K+ Na+, K+ Na+, K+ a) boundary of the specimen connected porosity filled by the gel
b) boundary of the specimen c) boundary of the specimen d) boundary of the specimen r r σ σ ft ft crack filled by the gel gel exudation Na+, K+ Na+, K+ Na+, K+ a) boundary of the specimen Na+, K+ Na+, K+ Na+, K+ a) boundary of the specimen connected porosity filled by the gel
b) boundary of the specimen c) boundary of the specimen d) boundary of the specimen r r σ σ ft ft ft ft crack filled by the gel gel exudation
Figure 1: Development of ASR-gels in four steps: a) Diffusion of alkali in aggregates, b) Filling of connected porosity by ASR-gels, c) Tensile stresses in the cement paste around aggregate compared to tensile strength, d) Permeation of ASR-gels through cracks and exudation on the external boundary 1 2 3 -0.1 0 0.1 0.2 0.3 0.4 0.5 0.6 0.7 0.8 0 100 200 300 400 500 600 Time (days) % s tr a in SL-0.77 SL-1.0 SL-1.25 R-0.77/1.0/1.25
Figure 2: Expansions on specimens with 30% siliceous limestone (SL) and 70% non-reactive limestone (reference R-100% non-reactive limestone) kept in NaOH solutions of different concentrations (0.77, 1.0 and 1.25 mol/l)
4 5
1 0 0.5 1 1.5 2 2.5 0 100 200 300 400 500 Time (days) M a s s v a ri a ti o n s ( % ) (a) 0.0 0.2 0.4 0.6 0.8 1.0 1.2 0 100 200 300 400 500 A S R e x p a n s io n ( % ) Time (days) 0-315 315-630 630-1250 1250-2500 20x20x160 mm 20x20x160 mm (b)
Figure 3: Mass variation (a) and expansions (b) on prismatic specimens 20x20x160 mm with Siliceous Limestone (SL) aggregate kept in NaOH solution (1.0 mol/l)
2 3 4
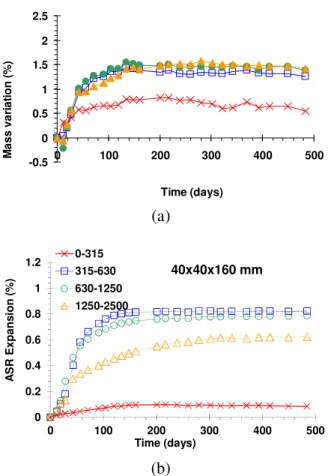
1 2 -0.5 0 0.5 1 1.5 2 2.5 0 100 200 300 400 500 Time (days) M a s s v a ri a ti o n ( % ) (a) 0 0.2 0.4 0.6 0.8 1 1.2 0 100 200 300 400 500 A S R E x p a n s io n ( % ) Time (days) 0-315 315-630 630-1250 1250-2500 40x40x160 mm (b)
Figure 4: Mass variation (a) and expansions (b) on prismatic specimens 40x40x160 mm with Siliceous Limestone (SL) aggregate kept in NaOH solution (1.0 mol/l)
3 4
1 2 -0.5 0 0.5 1 1.5 2 2.5 0 100 200 300 400 500 Time (days) M a s s v a ri a ti o n ( % ) (a) 0 0.2 0.4 0.6 0.8 1 1.2 0 100 200 300 400 500 Time (days) A S R e x p a n s io n ( % ) 315-630 630-1250 1250-2500 0-315 70x70x280 mm (b)
Figure 5: Mass variation (a) and ASR expansions (b) on prismatic specimens 70x70x280 mm with Siliceous Limestone (SL) aggregate kept in NaOH solution (1.0 mol/l)
3 4 5
(a)
(b)
(c)
1
Figure 6: Cracking patterns of specimens cast with siliceous limestone (a) 70x70x280 mm (b) 2 40x40x160 mm and (c) 20x20x160 mm 3 4 5 6 7
1 0 0.2 0.4 0.6 0.8 1 1.2 0 100 200 300 400 500 Time (days) A S R e x p a n s io n ( % ) 70*70*280 40*40*160 20*20*160 315-630 µm (a) 0 0.2 0.4 0.6 0.8 1 1.2 0 100 200 300 400 500 Time (days) A S R e x p a n s io n ( % ) 70*70*280 40*40*160 20*20*160 630-1250 µm (b) 0 0.2 0.4 0.6 0.8 1 1.2 0 100 200 300 400 500 Time (days) A S R e x p a n s io n ( % ) 70*70*280 40*40*160 20*20*160 1250-2500 µm (c)
Figure 7: ASR expansions on prismatic specimens 20x20x160 mm (a), 40x40x160 mm (b) and 70x70x280 mm (c) with Siliceous Limestone (SL) aggregate kept in NaOH solution (1.0 mol/l) 2
3 4 5 6
0 0.2 0.4 0.6 0.8 1 1.2 10 100 1000
Prism size / Particle size
A S R e x p a n s io n ( % ) 70x70x280 40x40x160 20x20x160 small aggregates
Figure 8: ASR expansions according to the ‘Prism size / Particle Size’ ratio 1 2 3 4 0 0.2 0.4 0.6 0.8 1 1.2 0 500 1000 1500 2000
Average particle size (µm)
A S R e x p a n s io n ( % ) 70x70x280 40x40x160 20x20x160 150 days (a) 0 0.2 0.4 0.6 0.8 1 1.2 0 500 1000 1500 2000
Average particle size (µm)
A S R e x p a n s io n ( % ) 70x70x280 40x40x160 20x20x160 400 days (b)
Figure 9: ASR expansions according to the average particle size after 150 days (a) and 400 days (b)
5 6 7 8
1 0 0.2 0.4 0.6 0.8 1 1.2 1.4 1.6 0 100 200 300 400 Time (days) A S R e x p a n s io n ( % ) Opal Silic. limest. Quarzite Quartz 2
Figure 10: ASR expansions according to the nature of the aggregate (reactive aggregate size: 315-3 1250 µm, prism size: 20x20x160 mm) 4 5 6 7 8 9 10 11 12 13 14
Figure 11: Cracking patterns of specimens cast with opal (20x20x160 mm) 15