HAL Id: hal-01577131
https://hal.archives-ouvertes.fr/hal-01577131
Submitted on 24 Aug 2017HAL is a multi-disciplinary open access archive for the deposit and dissemination of sci-entific research documents, whether they are pub-lished or not. The documents may come from teaching and research institutions in France or abroad, or from public or private research centers.
L’archive ouverte pluridisciplinaire HAL, est destinée au dépôt et à la diffusion de documents scientifiques de niveau recherche, publiés ou non, émanant des établissements d’enseignement et de recherche français ou étrangers, des laboratoires publics ou privés.
Lamrabet
To cite this version:
Dominique Schneider, Guillaume Beslon, Santiago F. Elena, Otmane Lamrabet. EvoEvo Deliverable 1.6 : Analysis of phenotypic innovation (part 2). [Research Report] INRIA Grenoble - Rhône-Alpes. 2016. �hal-01577131�
Page 1 of 15
EvoEvo Deliverable 1.6
Analysis of phenotypic innovation (part 2)
Due date: M36
Person in charge: Dominique Schneider Partner in charge: UGA
Workpackage: WP1 (Experimental observation of EvoEvo in action)
Deliverable description: Analysis of phenotypic innovation (part 2): Phenotypic innovation: identification of hub genes that may be targets of viral infections and that result in symptoms; relationships between bacterial regulatory networks and ability to produce stable polymorphisms.
Revisions:
Revision no. Revision description Date Person in charge 1.0 E. coli part 15/09/16 O. Lamrabet and D.
Schneider (UGA)
2.0 TEV part 10/10/16 S.F.Elena (CSIC)
Page 2 of 15
Table of Contents
1.
INTRODUCTION 3
2.
PHENOTYPIC INNOVATION AT THE POPULATION LEVEL IN THE TEV EXPERIMENTAL MODEL 3
2.1.
LOCAL ADAPTATION AND THE EXTENT OF PHENOTYPIC INNOVATION 3
2.2.
DISENTANGLING ECOTYPE-‐SPECIFIC FROM UNIVERSAL DRIVERS OF INNOVATION. 5
2.3.
THE COST OF INNOVATION 7
2.4.
GENERALIST AND SPECIALIST VIRUSES DIFFER IN THE EXTENT OF INNOVATION 8
3.
PHENOTYPIC INNOVATION AT THE REGULATORY NETWORK LEVEL IN THE E. COLI EXPERIMENTAL
MODEL 10
3.1.
EVOLUTION EXPERIMENTS 10
3.2.
EFFECT OF REGULATORY NETWORKS ON THE ARA–2 ADAPTIVE DIVERSIFICATION 11
4.
CONCLUSION 13
Page 3 of 15
1. Introduction
This deliverable will be divided in two sections that will address phenotypic innovation at two different levels using the most appropriate experimental model: phenotypic innovation at the population level in the TEV model and at the regulatory network level in the E. coli model.
2. Phenotypic innovation at the population level in the TEV
experimental model
What do we understand by phenotypic innovation in the case of RNA viruses? The phenotype of a virus is the effect it causes on its host, that is, the ability to infect a host (infectivity) and the severity of symptoms induced (virulence). In this Deliverable, we have proceeded to characterize the interaction between TEV and the host transcriptome, which at the end, is the determinant of the phenotype of infection. Furthermore, the transcriptome itself can be seen as a “molecular” phenotype. We have compared the transcriptomic profiles of different ecotypes of Arabidopsis thaliana, that differ in their susceptibility to infection, after infection with TEV lineages previously adapted to each one of them (Hillung et al., 2014). Some ecotypes had selected for specialist viruses whereas others selected for generalists (Hillung et al., 2014).
2.1. Local adaptation and the extent of phenotypic innovation
The first question tackled was whether the transcriptomic profiles from plants infected with viruses locally evolved were more similar among them than from those observed for plants from the same ecotype but infected with foreign viral lineages. We quantified the similarity between all possible pairs of expression profiles using Pearson’s correlation coefficient. To visualize the similarity in gene expression induced by infection with the evolved viral lineages, Fig. 1.1a shows a dendrogram based on these coefficients. Overall, two significant groups of virus-ecotype interactions exist. In the first group, lineages evolved in Ler-0 and Di-2 formed a cluster, which is subsequently divided into two branches, each one grouping lineages of corresponding ecotype. The second cluster incorporated lineages evolved in Ei-2, St-0 and Wt-1, though they segregated in separated ecotype-defined subgroups. Within this second cluster, Wt-1- and Ei-2-evolved lineages were more similar in their interaction with the hosts than St-0-evolved lineages.
Page 4 of 15
Fig. 1.1. Similarity in the response of local host to their local viruses. (a) Dendrogram grouping transcriptomic responses to infection with each of the evolved viruses on their corresponding local hosts. (b) Dendrogram grouping functional profiles obtained after infecting each of the evolved viruses on their corresponding local hosts. Red numbers represent the approximately unbiased support of each cluster (percentage P-value) computed by multiscale bootstrapping. Green numbers represent the support of each cluster based on a standard bootstrapping. Grey numbers indicate the node label.
Next, a gene set analysis was performed to identify functional categories of altered host genes. Comparing ranked lists of genes in a pairwise manner, we looked for sets of genes whose enrichment was different from a healthy plant. Then, we looked for blocks of overrepresented genes that shared functions and we could identify enriched functional categories (GO terms) for each ecotype. Furthermore, the analyses generated two levels of results: (1) all significant GO terms and (2) a group constituted only by significant more specific non-redundant GO terms. To identify consistent features among lineages and ecotypes we evaluated the intersections of non-redundant functions. For over-expressed genes, the number of ecotype-specific enriched functional categories ranged between 11 (for Wt-1-evolved lineages) and 64 (for St-0-evolved lineages) and there were only 2 functional categories shared by all five ecotypes-evolved lineages (Fig. 1.2a). These categories are response to cadmium ion and photorespiration. For down-regulated categories, the number of ecotype-specific enriched GO terms ranged between 2 (Ei-2-evolved lineages) and 76 (Di-2-(Ei-2-evolved lineages) and there were no common functional categories shared by all ecotypes, but some cases between pairs of ecotypes. The larger similarity in down-regulated GO terms was for Ler-0 and Di-2 (24), while Ei-2, Ler-0 and Wt-1 share 20 up-down-regulated functional categories. The same number is also shared between ecotypes Ei-2 and St-0.
Page 5 of 15
Fig. 1.2. Venn Diagrams of enriched functional categories in ecotypes infected with local evolved viral lineage in contrast to corresponding mock-infected ecotypes. (a) For up-regulated functional categories and (b) for down-regulated functional categories.
To further explore the similarities and differences in terms of functional annotations, we computed Pearson’s correlation coefficients between the lists of enriched GO terms generated for each evolved viral lineage on each plant ecotype. Pairwise correlation coefficients were used to build a dendrogram that shows the similarity among viral lineages in the lists of GO terms generated on each ecotype (Fig. 1.1b). Viral lineages evolved in St-0 had functionally different expression pattern than the other ecotypes, thus forming a clearly independent cluster. The rest of ecotypes form a second cluster whereas no ecotypes were more similar to each other, as the cluster had a nested structure. It is noteworthy that this functional clustering was different from the clustering generated from the transcriptomic profiles, and from the clustering generated using the functional response data of plants infected with the ancestral strain TEV-At17b (Hillung et al., 2012).
From these set of analyses, we concluded that the expression profiles of host’s mRNAs and their corresponding functional profiles were heterogeneous among ecotypes, although a significant degree of parallelism exist among lineages evolved in the same ecotype. Overall, two different types of transcriptomic response could be identified that are similar to the responses observed when plants were infected with the ancestral TEV-At17b (Hillung et al., 2012). These observations suggest that the extent of innovation in virus-host interactions was restricted by the genetic characteristics of the host.
2.2. Disentangling ecotype-specific from universal drivers of innovation.
In this second set of analyses we aimed to identify ecotype-specific and universal drivers of innovation: we are comparing the response of each given ecotype to infection with the locally-adapted viral lineages with their response to the infection with the ancestral TEV-At17b isolate. The lists of host genes whose expression is different in plants infected with the ancestral and the evolved viruses were compared in search of commonalities. Fig. 1.3 shows the number of genes whose expression was significantly different between ecotypes infected with evolved and ancestral lineages. Plants infected with viral lineages evolved in ecotypes Di-2 (37) and Ler-0 (3) have the lowest number of differentially expressed genes compared to infection with the ancestral virus. By
Page 6 of 15 contrast, plants infected with the lineages evolved in Ei-2 showed the largest amount of genes with differential expression/repression (2002). Plants infected with St-0- and Wt-1-evolved viral lineages had intermediate, and similar, numbers of differentially expressed genes as a consequence of viral evolution on these ecotypes (810 and 561, respectively). Noteworthy, in all diagrams shown in Fig. 1.3, the largest amount of altered genes always belongs to the category of genes shared by the three independent lineages, again pointing to a host ecotype-driven outcome of the evolutionary process.
Fig. 1.3. Venn diagrams of genes shared between locally adapted and ancestral viruses when infecting the corresponding local host ecotype. Each circle indicates an independent replicate of viral evolution in each given plant ecotype. Intersection areas indicate the number of common differently expressed genes between independent lineages. In red, number of over-expressed genes, in blue number of under-over-expressed genes.
Summarizing, although in all ecotypes at least one category was directly related to immune response, other functional groups were pervasively affected by the adaptation of the virus to its local host, indicating that general resistance mechanisms of the plant were not the main target for viral adaptation. In terms of changes of virus-host interactions caused by the adaptation of viral lineages to each host ecotype, they were frequent for lineages evolved in Ei-2, St-0 and Wt-1, as demonstrated by a larger number of differently affected genes in these ecotypes. Fewer of such evolved transcriptional modifications were found in Ler-0 and Di-2. This division into two groups reflects the scheme of the similarities in the gene expression of ecotypes infected with ancestral
Page 7 of 15 virus and highlighted the importance of the host genotype for the evolutionary fate of TEV-At17b. The analysis of affected functional categories allows us to fathom what is happening in the hosts while the virus is adapting to them. Specific changes in the interactions, caused by different evolved lineages, had heterogeneous profiles among ecotypes, but also some intersections in affected functional categories were detected, indicating most redundant targets of viral adaptation. There were no intersections between all ecotypes. According to the similarities in functional responses, ecotypes could be classified into disjoint groups. It is worth mentioning that significant changes in functional up- and down-regulated categories were found between Ler-0/2 and the ancestral virus in ecotype Ler-0 despite no mutations were fixed in this lineage, attributing the transcriptomic changes mostly to low-frequency subpopulations of viruses.
2.3. The cost of innovation
We evaluated whether adaptation to each new host ecotype was associated with a change in the way evolved viruses interacted with the ancestral host ecotype Ler-0. In other words, which changes in the way evolved viruses interact with the transcriptome of Ler-0 plants may explain the negative pleiotropic fitness effects observed for some of the evolved lineages (Hillung et al., 2014). To do so, the transcriptomic profiles of Ler-0 plants infected with each of the evolved viral lineages were contrasted to the transcriptome of Ler-0 plants infected with the ancestral TEV-At17b. First, we identified the number of genes with altered expression in Ler-0 plants infected with each of the evolved viruses compared with plants infected with the ancestral virus. Lineage Di-2/3 showed 1 under- and 2 over-expressed genes, lineage Ei-2/1 had 2 over- and 6 under-expressed genes, lineage Ler-0/2 showed 1 and 1 under-expressed genes, lineage Wt-1/2 had 6 over-expressed genes, and lineage Wt-1/3 had 2 under- and 1 over-over-expressed genes. Two genes were shared by more than two lineages. PAP1 encodes for a putative MYB DNA-binding domain containing transcription factor involved in anthocyanin metabolism and radical scavenging and is essential for the sucrose-mediated expression of the dihydroflavonol reductase gene. At1g17147, was shared between lineages Ei-2/1, Ler-0/2 and Wt-1/3 and was under-expressed.
Next, we sought to evaluate how similar was the response of Ler-0 to infection with the different evolved lineages. To do so, we computed Pearson’s correlation coefficients among the transcriptomic profiles obtained for each viral lineage when infecting Ler-0 (Fig. 1.4). In this case, all transcriptomes were significantly and positively correlated. The clustering pattern shown in Fig. 1.4 reflects this high similarity in the response of Ler-0 to all the lineages: in sharp contrast to the clustering-by-local host shown in Fig. 1.1, now clustering does not reflects the local host ecotype in which viral lineages evolved.
Page 8 of 15
Fig. 1.4. Similarity in transcriptomic profiles between plants of the Ler-0 ecotype infected with each of the evolved viral lineages. Red numbers represent the approximately unbiased support of each cluster (percentage P-value) computed by multiscale bootstrapping. Green numbers represent the support of each cluster based on a standard bootstrapping. Grey numbers indicate the node label.
To summarize this section, the changes in virus-Ler-0 interaction caused by subsequent evolution and adaptation to alternative ecotypes were small yet significant. The transcriptomic response was more homogeneous than when different host ecotypes were infected and compared, indicating that the genotype of the host is crucial in the extent of innovation in virus-host interaction and that the cost of adaptation to new hosts is similar for all evolved lineages. Analysis of functional transcriptomics were largely consistent with the analysis for viral fitness in Ler-0, as lineages evolved in ecotypes Ei-2 and Di-2 had affected the expression of less functional gene categories and also paid no fitness cost (Hillung et al., 2014). St-0-evolved lineages showed an average fitness decrease of 8.9% in Ler-0, being lineage St-0/3 the most specialized lineage; it also alters more functional categories than others. No homogeneous groups of evolved viral lineages could be defined according to the similarities in their perturbation of Ler-0 functional profile, and not a clear clustering of lineages evolved in the same ecotype was found (Fig. 1.4).
2.4. Generalist and specialist viruses differ in the extent of innovation
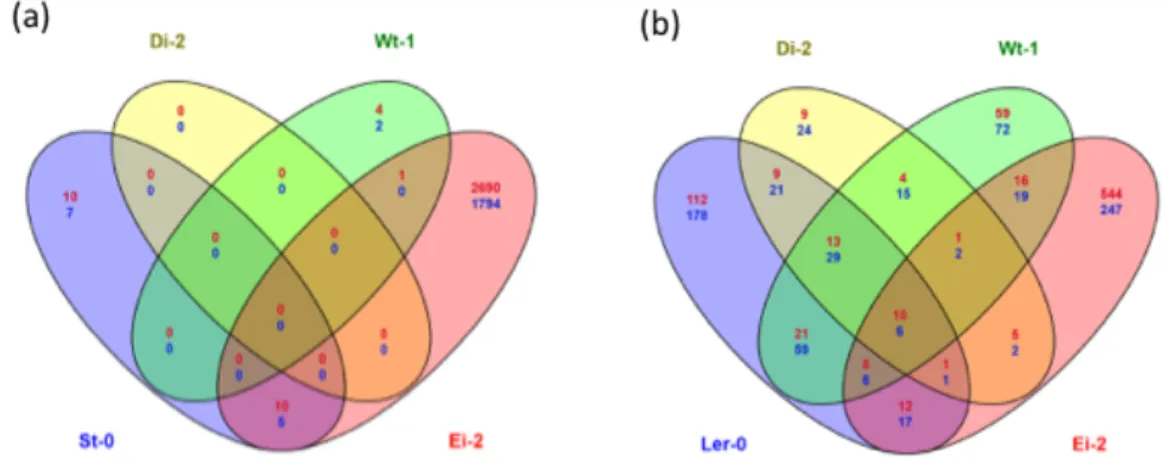
Finally, we were interested in answering the question of whether generalist and specialist viruses interact in a different manner with the different host ecotypes. Our hypothesis is that a specialist virus will show differences between the local and alternative hosts (i.e., more innovation), whereas the generalist virus will interact similarly across all hosts (i.e, less innovation). To test these predictions, we have characterized the transcriptome of plants from all ecotypes infected with the most generalist and the most specialist viruses evolved in our previous experiments (Hillung et al., 2014): lineage Ler-0/1 was found to be a generalist virus, while lineage St-0/3 was qualified as the most specialist one (Hillung et al., 2014). First, we evaluated gene expression differences between plants infected with both viruses. For the more generalist virus, Ler-0/1, the expression values for infected plants from each ecotype were contrasted to the transcriptome of Ler-0 plants (i.e., the local host for this viral lineage). In this way, the specific responses of ecotypes to the Ler-0/1 virus could be compared. As shown in Fig. 1.5a, there are only a reduced number of differentially expressed genes when ecotypes are compared (median of 0, interquartile range 8), except in the case of the infection of ecotype Ei-2, where more than 3000 genes showed altered expression in
Page 9 of 15 an ecotype-specific manner. Following a similar logic, we contrasted the transcriptomic effect of infecting plants from each ecotype with St-0/3 to the transcriptomic effect of this virus on St-0 plants. Fig. 1.5b shows that in this case the number of differentially expressed genes across ecotypes was more variable (median of 29.50, interquartile range 39) with, again Ei-2 showing the largest number of altered genes (791).
Fig. 1.5. Venn diagrams illustrating the similarities in gene expression patterns across host ecotypes upon infection with (a) the most generalist virus lineage Ler-0/1 and (b) the most specialist virus lineage St-0/3. In red, number of over-expressed genes; in blue number of under-expressed genes.
Transcriptomic responses of foreign ecotypes to infection with the St-0/3 specialist virus was different from the response of the local ecotype St-0. Ten over- and 6 under-expressed genes are in common for all ecotypes. These results back up our original hypothesis: generalist virus Ler-0/1 induces very similar perturbations in the transcriptomes of the different ecotypes analyzed. By contrast, the perturbations induced by the specialist virus St-0/3 are divergent among ecotypes. Infection with the specialist lineage St-0/3 mainly activates defense mechanisms and down-regulates metabolic and plant growing processes in all foreign hosts. Specialist lineage St-0/3 induces functionally stronger and more diverse responses in foreign hosts. Many more differentially expressed genes were found in response to the infection of foreign hosts with the specialist virus than with the generalist virus, indicating that the gene expression profiles of the foreign hosts were clearly different from the local hosts in case of infection with the specialist lineage St-0/3, but not if infected with the generalist virus Ler-0/1. However, these differences in gene expression vanished when functional categories were compared between specialist and generalist viruses. From this point of view, the transcriptomic response to infection with the specialist virus is more homogeneous. Ecotype Ei-2 shows an outstanding response profile if infected with Ler-0/1 isolate, whose differential gene expression was thousand-fold higher than in other ecotypes. Nevertheless, as showed in functional profiling, the affected genes were involved in a similar number of biological functions than in other ecotypes, and there were even intersections in most categories. Analysis of enriched functional categories could identify changes in non-local hosts for both lineages. There were more common genes between non-local hosts infected with the specialist lineage St-0/3 than with the generalist lineage Ler-0/1.
To summarize functional analyses, the coordinated response of different plant ecotypes to viral infection was dependent on the infecting viral strain. Plant defense mechanisms were activated
Page 10 of 15 when the infecting virus was a specialist, and they were down-regulated when the infecting virus was a generalist. At the same time some metabolic process and plant growth were also down-regulated during infection with the specialist viral strain, but not with the generalist one. By contrast, cell proliferation and processes involved in DNA replication were up-regulated with the generalist strain but not with the specialist one.
3. Phenotypic innovation at the regulatory network level in the E. coli
experimental model
Bacterial evolution experiments have shown that adaptive diversification associated with phenotypic innovation may occur in almost all tested environments. This evolutionary outcome is expected and even predictable when environments are heterogeneous (presence of spatial structure, different carbon sources…), owing to the availability of different ecological niches (Kassen and Rainey, 2004]). Moreover, and less expected, adaptive diversification also emerged in more homogeneous environments (Le Gac et al., 2012; Rosenzweig et al., 1994), owing to niche construction whereby bacteria generate themselves new ecological opportunities, for instance by secreting metabolites (Laland et al., 1999). Mutations resulting in such outcomes are known mostly only in the case of heterogeneous environments (Bantinaki et al., 2007; Spencer et al., 2007), with few exceptions (Treves et al., 1998). In all cases, a single mutation is enough to generate adaptive diversification and most mutations affect regulatory genes or sequences. A very special case of adaptive diversification occurred in one of the twelve populations, called Ara–2, of the LTEE (Plucain et al., 2014). This polymorphism is the longest known since two phenotypically-differentiated lineages emerged from a common ancestor in a homogeneous environment and co-exist now since more than 50,000 generations. Moreover, three mutations interact epistatically and are responsible for the emergence of one of the two lineages (Plucain et al., 2014).
The objective of this Deliverable was to investigate the relationships between the structure of global regulatory networks and the bacterial ability to produce phenotypic innovation. In particular, clones with different regulatory network structures were propagated under conditions known to promote adaptive diversification and investigated for their ability to produce co-existing lineages of bacterial cells with differential phenotypic abilities. In addition, we investigated the involvement of global regulatory networks in the physiology and mechanism of the adaptive diversification event detected in population Ara–2 of the LTEE.
3.1. Evolution experiments
We initiated new evolution experiments with, as ancestors, strains constructed during the previous tasks to study phenotypic innovation at the regulatory network level in the 12 populations of the LTEE. The objective was to investigate the relationships between the structure of global regulatory networks and the bacterial ability to produce phenotypic innovation. We initiated evolution experiments using clones with different regulatory network structures as ancestors: the ancestor and one evolved clone sampled at 40,000 generations from each of the 12 long-term populations together with each of their crp-deleted counterpart obtained from Task 1.1 Section 2. All strains were propagated by daily transfers for 500 generations (2.5 months) in minimal medium containing glucose and acetate, conditions known to promote adaptive diversification (Le Gac et al., 2008). We investigated their ability to produce co-existing lineages of bacterial cells with differential phenotypic abilities by plating at regular time points (after 100, 200, 300, 400 and 500 generations)
Page 11 of 15 on rich medium-containing plates. All crp+ strains were able to produce small and large colonies, reflecting the presence of two co-existing sub-lineages after diversification in each single population. The sub-lineage of large cells grows on glucose while the small cells switch quickly to acetate consumption. However, after rewiring the regulatory network by deleting crp, no mixture of colony size was detected, showing that the ability to diversify into two sub-lineages (at least based on glucose versus acetate consumption and colony size) was lost upon crp deletion.
These results precluded further analyses of diversification events after crp deletion and showed that deleting crp eliminated the ability to produce a polymorphic population during evolution in these conditions.
3.2. Effect of regulatory networks on the Ara–2 adaptive diversification
The Ara–2 population is characterized by the presence of two lineages, S and L, that diverged at ~6500 generations and coexist ever since for more than 50,000 generations (Plucain et al., 2014). Their co-existence involves niche construction through cross-feeding. Hence, the L lineage grows faster on glucose and secretes by-products that S can better exploit, generating negative frequency-dependent selection. The nature of the by-product was unknown before this work. The emergence of the S lineage requires three mutations, in the spoT, arcA and gntR genes (Plucain et al., 2014). The spoT gene encodes a global regulator involved in nutritional stress in E. coli. The arcA gene encodes a response regulator, which is one of the biggest regulator in E. coli controlling metabolism in particular as a function of the redox state of the cells. The gntR gene encodes a repressor of genes encoding enzymes involved in the Entner-Doudoroff pathway which is an alternative to glycolysis. Therefore, this adaptive diversification event relies on the rewiring of regulatory networks. However, the involvement of this restructuration in the emergence of the polymorphism was unknown before this work.
First, we evaluated the effect of deleting crp on the Ara–2 polymorphism. We deleted crp in one evolved clone sampled from each of the S and L lineages after 40,000 generations of evolution. All phenotypes that are diagnostic of the interactions between S and L (consumption of the L-secreted by-product by S, negative frequency dependence) are lost upon deletion of crp. Therefore, CRP is involved in the rewiring of the regulatory network that culminates in the emergence of the polymorphism.
Second, we investigated the physiological mechanism involved in the emergence of the adaptive diversification event resulting in the co-existence of the two S and L lineages. These results have been published recently (Großkopf et al., 2016). Our aim was to design a computer modelling tool able to predict adaptive trajectories, especially adaptive diversification events, which would be useful for practical applications. Current models use flux balance analysis (FBA) but cannot predict adaptive diversification, whereby an ancestral lineage diverges to fill multiple niches. At this aim, we combined in silico evolution with FBA and applied this modelling framework, evoFBA, to the Ara–2 population of the LTEE.
Not only did the simulations that we ran predict the adaptive diversification that occurred in Ara–2, but it also produced hypotheses about the mechanisms that promoted the emergence and co-existence of the two S and L lineages. Moreover, these predictions were easy to test and we showed that the L-secreted by-product that S uses was acetate. We experimentally showed that diversification involved niche construction and character displacement through differential nutrient
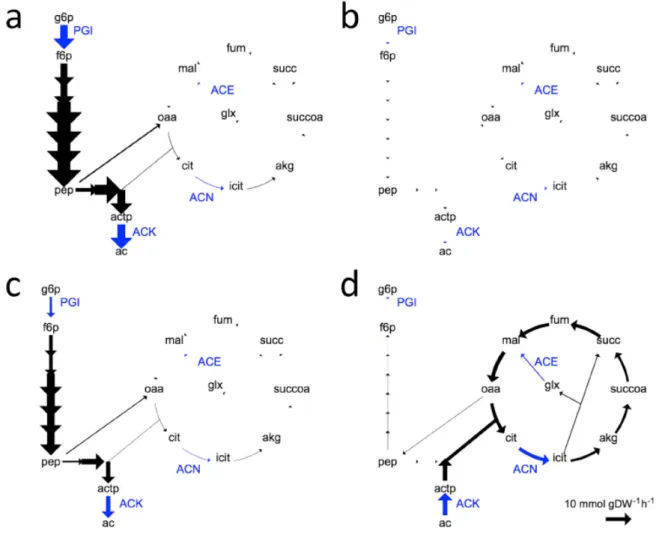
Page 12 of 15 uptake and altered metabolic regulation (Fig. 2.1). Indeed, clones from the L lineage specialized on glucose and were fitter and fitter on glucose, whereas it was not the case for clones from the S lineage which specialized and improved on acetate consumption (Fig. 2.2). We therefore demonstrated that our evoFBA framework can be applied and used to model biochemical evolution and to predict evolutionary and ecosystem-level outcomes.
Fig. 2.1. Metabolite turnover fluxes in glycolysis and TCA cycle. Fluxes in the L-like glucose specialist (A, B) and the S-like acetate specialist (C, D) genotypes during growth on glucose (A, C) and acetate (B, D). The following metabolites and reactions are shown: ac, acetate; actp, acetyl-phosphate; akg, alpha-keto-glutarate; cit, citrate; f6p, fructose-6-phosphate; fum, fumarate; glx, glyoxylate; g6p, glucose-6-phosphate; icit, isocitrate; mal, malate; oaa, oxaloacetate; pep, phospho-enol-pyruvate; succ, succinate; succoa, succinyl-coenzyme a. PGI, ACN, ACE, and ACK are the reactions catalyzed by glucose-phosphate isomerase, aconitate hydratase, malate synthase, and acetate kinase, respectively (shown in blue). Thickness of the arrow indicates the flux over the given reaction; the reference arrow at the bottom right shows a flux of 10 mmol/gDW/h.
Page 13 of 15
Fig. 2.2. Changes in growth rates of S and L on glucose and acetate over evolutionary time. Growth of S and L clones sampled at multiple generations of the LTEE was followed in DM250-acetate (A) and DM250-glucose (B) media. Clone names are shown above the horizontal red and blue bars, which denote S and L clones, respectively. The ancestor (Anc) and a 2000-generation clone (2K4) isolated prior to the divergence of the S and L lineages are also included. Growth rates (1/h) are shown according to the colour scale for 1-h sliding windows over 24-h and 7-h periods in the acetate and glucose media, respectively.
Third, we investigated the molecular and genetic mechanisms linking changes in regulatory networks and phenotypic innovation like adaptive diversification. These results are included in a manuscript that will soon be submitted (Molecular Genetics of a New Ecological Opportunity Exploitation During Long-Term Bacterial Sympatric Adaptive Diversification, Consuegra J, Plucain J, Gaffé J, Lenski RE, Hindré T, Schneider D). We showed that the arcA mutation, which is specific to the S lineage, rewired the transcriptional regulatory network controlling the central metabolic pathways resulting in higher expression of genes necessary for acetate consumption. Therefore, the arcA mutation improved acetate consumption, providing the opportunity for the S clones to invade and then co-exist with the clones from the L lineage.
4.
Conclusion
Phenotypic innovation in RNA viruses results from deep changes in the way different viral genotypes interact with the transcriptome of the host. In short, our study shows:
• Genes and functional categories differentially expressed by plants infected with local TEV isolates have been identified, showing heterogeneous responses among ecotypes,
Page 14 of 15 although significant parallelism existed among lineages evolved in the same ecotype. Adaptation to novel host genotypes results in phenotypic innovations, which are host-specific
• Although genes involved in immune responses were altered upon infection, other functional groups were also pervasively over-represented, suggesting that plant resistance genes were not the only drivers of viral adaptation.
• The transcriptomic consequences of infection with the generalist and specialist lineages were compared. Whilst the generalist induced very similar perturbations in the transcriptomes of the different ecotypes, the perturbations induced by the specialist were divergent. Plant defense mechanisms were activated when the infecting virus was specialist but they were down-regulated when infecting with generalist.
We showed that regulatory networks are essential for phenotypic innovation in bacteria. As a phenotypic innovation, we used the ability to colonize new ecological niches resulting in divergence of bacterial lineages which is an essential trait both in evolutionary biology and in medicine where bacterial diversification results in dramatic public health problems. The involvement of regulatory networks in bacterial divergence was demonstrated at several levels:
• The absence of a global regulator like CRP prevents the ability to diversify. Indeed, deletion of crp both did not allow de novo evolution of divergence and altered a well-established and long-term polymorphism.
• Mutational change in arcA, encoding one of the biggest global regulators in E. coli, that were selected for during the longest-running evolution experiment was essential for the emergence of a long-term polymorphism by providing the opportunity of exploiting a new ecological niche.
Therefore, the structure of regulatory networks is an essential trait in bacterial cells. As was shown since decades, it allows a fast answer to environmental changes by transiently modifying the global expression profiles. We showed here, in the framework of EvoEvo, that the structure of regulatory networks is also essential for the establishment of stable adaptive diversification events in bacteria, which is considered as the first step of speciation.
5.
References
Bantinaki E, Kassen R, Knight CG, Robinson Z, Spiers AJ, Rainey PB. 2007. Adaptive divergence in experimental populations of Pseudomonas fluorescens. III. Mutational origins of wrinkly spreader diversity, Genetics 176:441-453.
Großkopf T, Consuegra J, Gaffé J, Willison JC, Lenski RE, Soyer OS, Schneider D. 2016. Metabolic modelling in a dynamic evolutionary framework predicts adaptive diversification of bacteria in a long-term evolution experiment. BMC Evol. Biol. 16:163.
Hillung J, Cuevas JM, Elena SF. 2012. Transcript profiling of different Arabidopsis thaliana ecotypes in response to tobacco etch potyvirus infection. Front. Microbiol. 3:229.
Hillung J, Cuevas JM, Valverde S, Elena, SF. 2014. Experimental evolution of an emerging plant virus in host genotypes that differ in their susceptibility to infection. Evolution 68:2467-2480.
Page 15 of 15 Kassen R, Rainey PB. 2004. The ecology and genetics of microbial diversity. Annu. Rev. Microbiol. 58:207-231.
Laland KN, Odling-Smee FJ, Feldman MW. 1999. Evolutionary consequences of niche construction and their implications for ecology. Proc. Natl. Acad. Sci. USA 96:10242-10247.
Le Gac M, Brazas MD, Bertrand M, Tyerman JG, Spencer CC, Hancock RE, Doebeli M. 2008. Metabolic changes associated with adaptive diversification in Escherichia coli. Genetics 178:1049-1060.
Le Gac M, Plucain J, Hindré T, Lenski RE, Schneider D. 2012. Ecological and evolutionary dynamics of coexisting lineages during a long-term experiment with E. coli. Proc. Natl. Acad. Sci. USA 109:9487-9492.
Plucain J, Hindré T, Le Gac M, Tenaillon O, Cruveiller S, Médigue C, Leiby N, Harcombe WR, Marx CJ, Lenski RE, Schneider D. 2014. Epistasis and allele specificity in the emergence of a stable polymorphism in Escherichia coli. Science 343:1366-1369.
Rosenzweig RF, Sharp RR, Treves DS, Adams J. 1994. Microbial evolution in a simple unstructured environment – genetic differentiation in Escherichia coli. Genetics 137:903-917. Spencer CC, Bertrand M, Travisano M, Doebeli M. 2007. Adaptive diversification in genes that regulate resource use in Escherichia coli. PLoS Genet. 3:e15.
Treves DS, Manning S, Adams J. 1998. Repeated evolution of an acetate-crossfeeding polymorphism in long-term populations of Escherichia coli. Mol. Biol. Evol. 15:789-797.