Publisher’s version / Version de l'éditeur:
4th Conference on Extreme Programming and Agile Methods, 2004
READ THESE TERMS AND CONDITIONS CAREFULLY BEFORE USING THIS WEBSITE. https://nrc-publications.canada.ca/eng/copyright
Vous avez des questions? Nous pouvons vous aider. Pour communiquer directement avec un auteur, consultez la
première page de la revue dans laquelle son article a été publié afin de trouver ses coordonnées. Si vous n’arrivez pas à les repérer, communiquez avec nous à [email protected].
Questions? Contact the NRC Publications Archive team at
[email protected]. If you wish to email the authors directly, please see the first page of the publication for their contact information.
NRC Publications Archive
Archives des publications du CNRC
This publication could be one of several versions: author’s original, accepted manuscript or the publisher’s version. / La version de cette publication peut être l’une des suivantes : la version prépublication de l’auteur, la version acceptée du manuscrit ou la version de l’éditeur.
Access and use of this website and the material on it are subject to the Terms and Conditions set forth at
The Role of Process Measurement in Test-Driven Development
Wang, Y.; Erdogmus, Hakan
https://publications-cnrc.canada.ca/fra/droits
L’accès à ce site Web et l’utilisation de son contenu sont assujettis aux conditions présentées dans le site LISEZ CES CONDITIONS ATTENTIVEMENT AVANT D’UTILISER CE SITE WEB.
NRC Publications Record / Notice d'Archives des publications de CNRC:
https://nrc-publications.canada.ca/eng/view/object/?id=97c432ea-d540-4095-9fbe-41ca62ebcc27 https://publications-cnrc.canada.ca/fra/voir/objet/?id=97c432ea-d540-4095-9fbe-41ca62ebcc27
National Research Council Canada Institute for Information Technology Conseil national de recherches Canada Institut de technologie de l'information
The Role of Process Measurement in Test-Driven
Development *
Wang, Y., and Erdogmus, H.
August 2004
* published in the Proceedings of the XP-Agile Universe. 4th Conference on Extreme Programming and Agile Methods. Calgary, Alberta, Canada. August 15-18, 2004. NRC 47413. Lecture Notes in Computer Science, No. 3134, Springer, 2004.
Copyright 2004 by
National Research Council of Canada
Permission is granted to quote short excerpts and to reproduce figures and tables from this report, provided that the source of such material is fully acknowledged.
The Role of Process Measurement in Test-Driven
Development
Yihong Wang and Hakan Erdogmus
Software Engineering Group, Institute for Information Technology, National Research Council of Canada
Montreal Road, Building M50, Ottawa, Ontario, Canada K1A 0R6 {hakan.erdogmus,yihong.wang}@nrc-cnrc.gc.ca
Abstract. Test-Driven Development (TDD) is a coding technique in which pro-grammers write unit tests before writing or revising production code. We present a process measurement approach for TDD that relies on the analysis of fine-grained data collected during coding activities. This data is mined to produce abstractions regarding programmers’ work patterns. Programmers, instructors, and coaches re-ceive concrete feedback by visualizing these abstractions. Process measurement has the potential to accelerate the learning of TDD, enhance its effectiveness, aid in its empirical evaluation, and support project tracking.
1 Introduction
Test-Driven Development (TDD) [1-3] is a coding technique that relies on writing tests
before implementation. The tests are written by the programmer using a unit testing
framework such as JUnit [4]. Unit tests are incrementally added and all tests are periodi-cally executed. Consequently, the program is regression tested as it is being developed.
This paper presents an unobtrusive approach for improving the effectiveness of TDD based on an analysis of programmers’ coding and testing activities. First, we formalize the TDD process as a sequence of programming cycles, called a cycle trace. Cycle traces are visualized in different ways to obtain high-level information about the work patterns of programmers. This information in turn supports personal process improvement, educa-tion, empirical evaluaeduca-tion, and project tracking.
A single programming cycle involves writing unit tests and production code, and ends with a successful execution of tests. The formalization of a programming cycle allows a high-level representation of the programmer’s coding and testing activities to be extracted from a record of low-level actions. These actions are captured using a third-party tool [5] that is integrated into the development environment. The logged actions track tool usage (JUnit) and changes to project resources; they are time-stamped and augmented with basic code metrics. Once the cycle trace is extracted in tabular form, further abstractions are
produced that zoom in on different aspects of the process followed by the programmer. These abstractions are presented as charts, which are visualized and interpreted.
Section 2 elaborates on the motivation of the work. Section 3 presents the approach. Section 4 presents the tabular representation of a cycle trace and discusses the interpreta-tion of various charts derived from this representainterpreta-tion. Finally, Secinterpreta-tion 5 presents conclu-sions and discusses future work.
2 Motivation
Inevitably, programmers with different experience levels, preferences, reasoning proc-esses, and established work patterns will apply TDD in different ways. With meaningful feedback, programmers can correlate any changes in productivity and code quality with the way the technique is being applied. In turn, the awareness of the process followed helps programmers discover rhythms and patterns that work best in a given context. In addition, process data can provide useful insight regarding the status of the project, both in terms of progress and in terms of product quality. Johnson et al. [6] stress the impor-tance of process measurement in personal process improvement and project tracking, but not specifically in the context of TDD.
Concrete, measurement-based feedback is also important from a pedagogical point of view. Although students who are exposed to TDD find it useful [7, 8] and obtain better productivity scores [8] and course grades [9], many students find TDD counterintuitive [10] and a majority find it more difficult to apply compared to conventional program-ming. In addition, students with higher skill ratings are able to leverage TDD better, and achieve more dramatic productivity improvements compared to students with lower skill ratings [8]. These findings imply that TDD may initially appear counterintuitive to nov-ices and the effective application of this technique demands both discipline and mastery. Therefore, coaches and instructors can take advantage of process measurement to teach TDD to newcomers and to advance the skill level of veterans.
Discrepancies in empirical findings [8, 9, 11-14] [12] constitute a significant impedi-ment to drawing generalized conclusions, and consequently, the findings remain valid only in the contexts in which they were produced. While several factors may account for the discrepancies (such as differences in populations, experiment tasks, teaching methods and materials, the technique with which TDD is compared), all of the studies mentioned suffer from a common pitfall of empirical software engineering: process conformance [8]. Process conformance is a threat to construct validity [15] related to the ability and will-ingness of subjects to follow a prescribed process. How do we know that the subjects apply TDD in the same way, or in the manner expected, both within and across studies? Although it is impossible to address process conformance in a fully objective manner, measurement should reduce the construct threat that it poses. Researchers often rely on self-assessment through questionnaires to gauge process conformance. Measurement can
complement self-assessment by allowing the comparison of the subjects’ process meas-ures with idealized patterns. In addition, measurement is useful in assessing maturation (achievement of sufficient experience in the investigated technique), which is a concern in TDD studies: productivity and quality measures taken will be more meaningful and valid if the subjects gain reasonable mastery beforehand. Therefore process measurement can play an important role in empirical evaluation, in terms of both enhancing the validity of the results and facilitating the comparison and aggregation of findings from multiple studies.
3 Approach
This section explains the process measurement approach taken. Section 3.1 formalizes the TDD process in terms of a cycle trace. Section 3.2 defines the high-level architecture for data collection and analysis of our prototype implementation. This architecture relies on a third-party tool for data collection. Section 3.3 explains how to mine the process data collected to recognize cycle traces.
3.1 Formalization of TDD Process
We represent the TDD process as a sequence of programming cycles, called a cycle trace. Each programming cycle in turn is composed of more elementary blocks representing three distinct types of activities. A TestCode block is defined as a contiguous sequence of coding activities that involves only writing or revising tests. A TestCode block is typi-cally followed by a ProductionCode block, which is a contiguous sequence of activities that involves only writing or revising production code. The TestCode-ProductionCode sub-cycle can be repeated several times, but usually a ProductionCode block is immedi-ately followed by the execution of a series of tests. A contiguous sequence of test execu-tions is a TestExecution block. A TestExecution block that is (100%) successful (repre-sented by a green bar in JUnit) indicates the end of a programming cycle. An unsuccess-ful, or failing, TestExecution block (represented by a red bar in JUnit) marks the end of a sub-cycle, which we call a CycleElement. Thus, a single programming cycle is composed of several CycleElements, the last of which ends with a successful TestExecution block.
Formally, a cycle trace is defined by the following regular expressions: CycleElement(x) = (TestCode | ProductionCode)+ TestExecution(x) ProgrammingCycle = CycleElement(fail)* CycleElement(pass) CycleTrace = ProgrammingCycle+
Here x ∈ {fail, pass} differentiates between failing and successful TestExecution blocks and CycleElements. Note that the regular expressions describe a generic process that is not strictly TDD-compliant. For example, they recognize variant cycles where the programmer writes the tests after the production code. Such non-compliant cycles should be occasionally expected in TDD, but they are normally not persistent if TDD is faithfully applied. The regular expression pattern also recognizes more legitimate variants such as pure refactoring [16] cycles during which the programmer does not add new functional-ity, but improves the design by typically revising the test code or the production code. Whereas the cycle trace of a faithful TDD programmer will contain a large number of short cycles, the traditional programmer who follows a waterfall-like process will have a cycle trace that contains a fewer number of long cycles.
The formalization assumes that unproductive or dead-end cycles always conclude with the restoration of a former stable state of the code. In a stable state, all tests must run 100% successfully. Once a stable state is achieved, the programmer verifies this condi-tion, thereby delimiting an unproductive or dead-end cycle with a successful TestExecu-tion block.
3.2 Architecture for Data Collection and Analysis
To recognize cycle traces, we need to collect fine-grained data regarding the program-mer’s coding and testing activities. For this purpose we chose Hackystat [5, 17], a light-weight tool available from the University of Hawaii’s Collaborative Software Develop-ment Laboratory. Hackystat client sensors are available for several developDevelop-ment envi-ronments including Eclipse [18]. Once the sensors are installed and configured on the programmer’s computer, they work transparently in the background to collect the data. The Hackystat sensor periodically sends the locally cached data to a Hackystat server, where it is stored permanently and can be retrieved on demand in XML form.
To generate a representation of the cycle trace for a given time period, the client runs the analysis tool locally. The analysis tool downloads the associated logged data from the Hackystat server and generates an Excel spreadsheet containing a tabular representation of the client’s cycle trace as well as the associated charts.
3.3 Mining Hackystat Data
Hackystat sensors collect multiple types of data from the client. We take advantage of the data types Activity, UnitTest and FileMetric. Hackystat logs changes to project artifacts in
Activity data. Unit test executions are logged in UnitTest data along with the test results. FileMetric data contain static structural metrics on project artifacts.
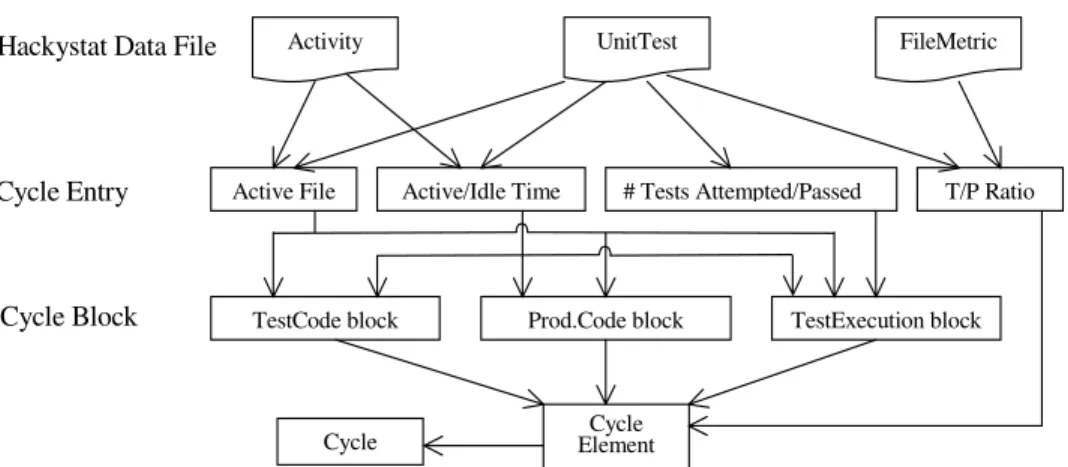
Figure 1 shows how Hackystat data is aggregated to recognize programming cycles. The blocks that make up the cycles (TestCode, ProductionCode and TestExecution
Block) are composed of a set of related cycle entries, where each cycle entry has a dura-tion (Active Time) and an associated project artifact (Active File). For TestCode and ProductionCode blocks, the project artifact is obtained by cross-referencing the test case names recorded in the Hackystat UnitTest data with the file names recorded in the Hackystat Activity data. The project artifacts (i.e., test classes) of a TestExecution block are obtained from UnitTest data alone. The duration of the cycle entry is estimated using Hackystat timestamps. When no Hackystat entries are logged for a project artifact for a certain period of time (e.g., two minutes), the excess time is recorded as “Idle Time,” which is excluded from “Active Time” to account for interruptions.
“T/P Ratio” tracks the amount of test code produced relative to the amount of produc-tion code. This metric is calculated using the UnitTest and FileMetric data. Since a cycle entry may affect the size of a project artifact, T/P Ratio is recomputed at the end of each cycle based on the timestamp of the last modification from the FileMetric data.
The number of tests attempted and the number of tests passed from UnitTest data to-gether identify successful and failing test executions.
Cycle Block Cycle Entry
Hackystat Data File Activity UnitTest FileMetric
Active/Idle Time
Active File # Tests Attempted/Passed T/P Ratio
TestExecution block TestCode block Prod.Code block
Cycle Element Cycle
Fig. 1. Recognizing programming cycles using Hackystat data types.
Aggregation of cycle entries into blocks proceeds in a bottom-up fashion. Since test executions delimit CycleElements, TestExecution blocks are formed first using Activity and UnitTest data types. If there is no Activity entry whose timestamp is between the time-stamps of two UnitTest entries, then the two UnitTest entries are grouped into one Test-Execution block; otherwise, they belong to different TestTest-Execution blocks. Once the TestExecution blocks are identified, remaining activities can be grouped into Production-Code and TestProduction-Code blocks by comparing their timestamps with the delimiting timestamps of the TestExecution blocks. Finally CycleElements and Cycles are constructed based on the sequencing of the blocks. The output of this procedure is illustrated in the next sec-tion.
4. Analysis of Cycle Traces
In this section, we present the output of our prototype analysis tool for Eclipse [18], called TestFirstGauge. We also show with several examples how the output can be inter-preted to support personal process improvement, learning, process conformance, and project tracking. The data used in the examples are collected during various programming tasks from an experienced programmer who was learning TDD. Section 4.1 explains the tabular representation of a cycle trace generated by the tool. Section 4.2 illustrates the analysis of cycle time and T/P Ratio using two different charts. Finally, section 4.3 dis-cusses testing effort analysis.
4.1 TDD Report
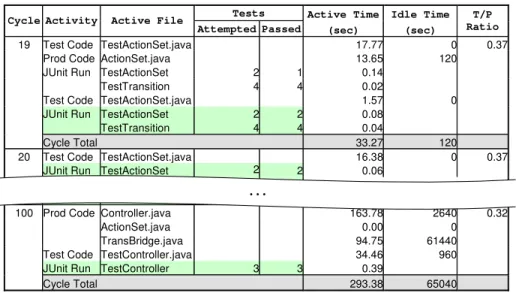
Figure 2 illustrates the cycle trace report generated by the TDD analysis tool. Tests Active Time Idle Time Cycle Activity Active File
Attempted Passed (sec) (sec) T/P Ratio
19 Test Code TestActionSet.java 17.77 0 0.37
Prod Code ActionSet.java 13.65 120
JUnit Run TestActionSet 2 1 0.14
TestTransition 4 4 0.02
Test Code TestActionSet.java 1.57 0
JUnit Run TestActionSet 2 2 0.08
TestTransition 4 4 0.04
Cycle Total 33.27 120
20 Test Code TestActionSet.java 16.38 0 0.37
JUnit Run TestActionSet 2 2 0.06
TestFileMetric 1 1 0.03
100 Prod Code Controller.java 163.78 2640 0.32
ActionSet.java 0.00 0
TransBridge.java 94.75 61440
Test Code TestController.java 34.46 960
JUnit Run TestController 3 3 0.39
Cycle Total 293.38 65040
…
Fig. 2. Sample TDD report.
The first column shows the cycle number. The second column gives the type of the cy-cle entry, which depends on the block to which the cycy-cle entry belongs. (The entries la-beled “JUnit Run” belong to TestExecution blocks.) The third column lists the project artifacts associated with each cycle entry. For JUnit runs (TestExecution blocks), the numbers of tests attempted and passed are given in the next column. The column labeled “Active Time” gives the duration of the cycle entry (excluding idle time). Last column
provides the (cumulative) ratio of test code to production code. The total duration of each cycle is indicated in the row “Cycle Total”. Whereas Cycle 19 is a TDD cycle, Cycle 100 is a non-TDD cycle because it begins with a ProductionCode rather than a TestCode block.
4.2 Cycle Time and T/P Ratio Analysis
Figure 3 shows an example of the cycle active time chart. We can use this chart to support learning, assess process conformance and support project tracking.
Ideally, with faithful application of TDD, the chart should have short cycles of compa-rable length, representing a steady progress. Cycles from 40 to 100 are typical and con-form to the ideal pattern. The spikes towards the beginning (long cycles) are possibly due to the initial TDD learning curve. The spikes towards the end correspond to integration-related tasks during which TDD was not applicable.
Active Time 0 1000 2000 3000 4000 5000 6000 1 10 19 28 37 46 55 64 73 82 91 100 109 Cycle A ct ive T im e ( sec )
Fig. 3. Cycle Active Time.
With regard to project tracking, persistent long cycles could be indicative of design complexities, which make adding new functionality difficult. Such patterns can be used to identify opportunities for refactoring to improve the design.
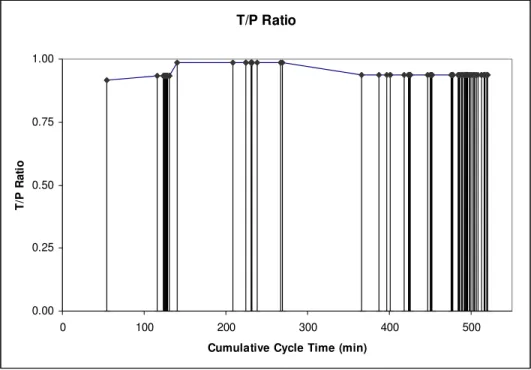
Figure 4 depicts the cycle pattern associated with another programming task. The x-axis denotes cumulative cycle time measured in minutes. Long cycles now appear as large gaps between consecutive vertical bars, each of which marks the beginning of a new cycle. In the middle section, the programmer performs a series of large refactorings.
To-wards the end, a steadier pattern is gradually reached as evidenced by increasingly tightly spaced vertical bars. The height of each bar indicates the ratio of test code to production code (T/P Ratio) at the end of the associated cycle. We see that during the refactoring activity, the T/P Ratio increased: the programmer added more tests most likely to better support the design changes. Towards the end, the T/P Ratio gradually reverted back to its previous level. T/P Ratio 0.00 0.25 0.50 0.75 1.00 0 100 200 300 400 500
Cumulative Cycle Time (min)
T/ P R a ti o
Fig. 4. Cycle Pattern with T/P Ratio.
4.3 Testing Effort Analysis
Analysis of testing effort is particularly useful for project tracking.
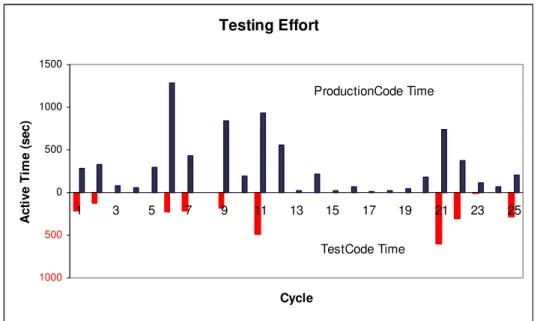
Figure 5 shows historical test code effort (bottom bars) relative to production code ef-fort (top bars) as a function of cycle number. Test execution time is excluded from this analysis. Two explanations are possible for the absence of testing activity in the middle section of the chart. The first explanation is that the programmer could have neglected testing. In this case the chart can be used to look up the production code classes associ-ated with the middle cycles in the TDD report to identify sections of the code as the focus
of subsequent coverage analysis. The second explanation is that the middle section corre-sponds to refactoring activities during which no tests were added or modified. Again the TDD report can be analyzed further to verify this hypothesis.
Testing Effort 1000 500 0 500 1000 1500 1 3 5 7 9 11 13 15 17 19 21 23 25 Cycle Ac ti v e T im e (s e c ) ProductionCode Time TestCode Time
Fig. 5. Testing effort.
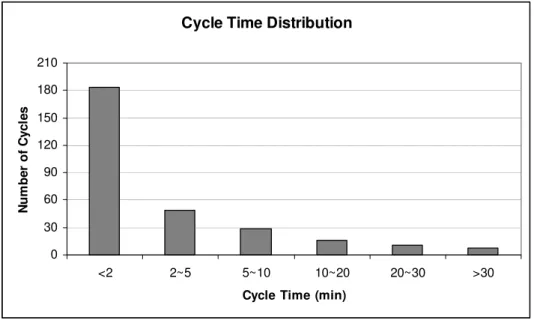
4.4 Cycle Time Distribution
Beck states [2] (page 83) that his JUnit usage (minutes between successive JUnit runs) has a particular U-shaped distribution. However, how often JUnit is run provides little information about how quickly a TDD programmer completes a programming task within a single cycle and how fine-grained the tasks are themselves. To gauge their speed and the granularity of the incremental process followed, TDD programmers should be more interested in the distribution of the duration of the programming cycles than the distribu-tion of time between successive JUnit runs.
Figure 6 illustrates the cycle time distribution for a typical TDD session. The chart has been produced after the programmer has acquired experience with TDD. As expected with proper application of TDD, smaller cycles exhibit a higher frequency than larger cycles. As the mastery of TDD increases, the programmer should get better at task de-composition and follow an increasingly finer incremental process. Consequently, the head of the distribution should get fatter while the tail thins out.
Cycle Time Distribution 0 30 60 90 120 150 180 210 <2 2~5 5~10 10~20 20~30 >30
Cycle Time (min)
N u m b er o f C ycl es
Fig. 6. Cycle time distribution.
5. Conclusions
Measurement supports process improvement not only at project and organizational levels, but also at a personal level. We presented an approach based on process measurement to support Test-Driven Development, an incremental coding technique that demands disci-pline. The goal of the approach is to:
• increase the mastery of TDD by providing concrete visual feedback to pro-grammers regarding their past work patterns and rate of progress,
• facilitate teaching by allowing coaches to demonstrate target patterns and iden-tify slippages,
• aid in project tracking by identifying sections of code that are candidates for closer scrutiny, and
• improve empirical evaluation by controlling process conformance.
At the centre of the approach is the concept of a programming cycle, which leads to the formalization of the process underlying TDD. A tool then extracts traces of such cycles from programmers’ activity logs, and produces various time-series charts that are easy to
interpret. We provided examples of how to interpret a subset of these charts. The tool generates additional charts that were not discussed in this paper.
Our prototype tool works with Eclipse, JUnit, Microsoft Excel and Hackystat. The tool is freely available under GPL upon contacting the authors.
Although the espoused benefits of our TDD process measurement approach in research settings are well founded, its impact on education and personal process improvement is speculative at this point. Future efforts will focus on further improvements to the tool and on the evaluation of the approach in different settings. Work is already under way. The tool will be tested in an industrial case study of TDD and in future replications of the TDD experiment mentioned in [8]. Regarding additional analysis capabilities, we have made progress in two fronts: incorporation of test coverage information into cycle traces using a commercial tool and automatic recognition of refactoring cycles.
Acknowledgments
Maurizio Morisio’s relentless obsession with process conformance and Marco Torchiano’s arguments were instrumental in convincing the authors of the usefulness of an automatic measurement approach for TDD. Discussions with Philip Johnson led to the development of a mockup for the TestFirstGauge tool. Alain Desilets, Joel Martin, and Janice Singer gave valuable feedback on an early version of the tool. The IIT Software Engineering Group members provided comments to improve the readability of the paper.
References
[1] D. Astels, G. Miller, and M. Novak, A Practical Guide to Extreme Programming. Upper Sad-dle River, NJ: Prentice Hall, 2002.
[2] K. Beck, Test-Driven Development: by Example: Addison Wesley, 2003.
[3] K. Beck, "Aim, fire (test-first coding)," IEEE Software, vol. 18, pp. 87-89, 2001. [4] JUnit.org, www.junit.org.
[5] P. M. Johnson, H. Kou, J. M. Agustin, Q. Zhang, A. Kagawa, and Takuya Yamashita, "Practi-cal automated process and product metric collection and analysis in a classroom setting: Les-sons learned from Hackystat-UH," University of Hawaii, Collaborative Software Development Laboratory, Technical Report (submitted to 2004 International Symposium on Empirical Soft-ware Engineering) csdl2-03-12, December 2003.
[6] P. M. Johnson, H. Kou, J. Agustin, C. Chan, C. Moore, J. Miglani, S. Zhen, and W. E. J. Do-ane, "Beyond the personal software process: metrics collection and analysis for the differently disciplined," presented at 25th International Conference on Software Engineering (ICSE 2003), Portland (OR), USA, 2003.
[7] M. M. Müller and W. F. Tichy, "Case study: Extreme Programming in a university environ-ment," presented at International Conference on Software Engineering (ICSE), Toronto, Can-ada, 2001.
[8] H. Erdogmus, M. Morisio, and M. Torchiano, "A Controlled Experiment on the Effectiveness of Test-Driven Development," Submitted for publication, 2004.
[9] S. H. Edwards, "Using test-driven development in the classroom: Providing students with concrete feedback on performance," presented at Proceedings of the International Conference on Education and Information Systems: Technologies and Applications (EISTA'03), August 2003.
[10] M. Morisio and M. Torchiano, "Perception of XP Practices in a University Environment," Dipartimento di Informatica e Automatica, Politecnico di Torino, Technical Report 2003. [11] B. George and L. Williams, "An Initial Investigation of Test Driven Development in Industry,"
presented at ACM Symposium on Applied Computing, Melbourne, Florida, 2003.
[12] L. Williams, E. M. Maximilien, and M. Vouk, "Test-Driven Development as a Defect-Reduction Practice," presented at 14th Internation Symposium on Software Reliability Engi-neering (ISSRE '03), 2003.
[13] M. M. Müller and O. Hagner, "Experiment about Test-First Programming," presented at Em-pirical Assessment in Software Engineering (EASE), Keele, UK, 2002.
[14] M. Long, "A Meta Analysis of the Quality and Productivity Benefits of Pair Programming and Test Driven Design," Christopher Newport University, 2003
[15] C. Wohlin, P. Runeson, M. Host, M. C. Ohlsson, B. Regnell, and A. Wesslen, Experimentation
in Software Engineering: An Introduction: Kluwer Academic Publishers, 2000.
[16] M. Fowler, UML Distilled: Addison Wesley, 2000. [17] "Hackystat," http://csdl.ics.hawaii.edu/Tools/Hackystat/
[18] "Eclipse Platform Technical Overview," Object Technology International, 2003, http://www.eclipse.org/whitepapers/eclipse-overview.pdf