HAL Id: halshs-00736556
https://halshs.archives-ouvertes.fr/halshs-00736556
Preprint submitted on 28 Sep 2012
HAL is a multi-disciplinary open access
archive for the deposit and dissemination of
sci-entific research documents, whether they are
pub-lished or not. The documents may come from
teaching and research institutions in France or
abroad, or from public or private research centers.
L’archive ouverte pluridisciplinaire HAL, est
destinée au dépôt et à la diffusion de documents
scientifiques de niveau recherche, publiés ou non,
émanant des établissements d’enseignement et de
recherche français ou étrangers, des laboratoires
publics ou privés.
Mandatory labels, taxes and market forces: An
empirical evaluation of fat policies
Olivier Allais, Fabrice Etilé, Sébastien Lecocq
To cite this version:
Olivier Allais, Fabrice Etilé, Sébastien Lecocq. Mandatory labels, taxes and market forces: An
em-pirical evaluation of fat policies. 2012. �halshs-00736556�
WORKING PAPER N° 2012 – 37
Mandatory labels, taxes and market forces: An empirical
evaluation of fat policies
Olivier Allais
Fabrice Etilé
Sébastien Lecocq
JEL Codes : D43, D12, I18
Keywords: Nutrition ; Labelling ; Price fat ; Informatic
P
ARIS-JOURDAN
S
CIENCES
E
CONOMIQUES
48, BD JOURDAN – E.N.S. – 75014 PARIS TÉL. : 33(0) 1 43 13 63 00 – FAX : 33 (0) 1 43 13 63 10
Mandatory labels, taxes and market forces: An empirical
evaluation of fat policies
Olivier Allais
INRA, UR1303 ALISS, F-94200 Ivry-sur-Seine, France
Fabrice Etilé
INRA, UR1303 ALISS, F-94200 Ivry-sur-Seine, France and Paris School of Economics, F-75600 Paris, France
Sébastien Lecocq
INRA, UR1303 ALISS, F-94200 Ivry-sur-Seine, France
September 2012
Abstract
The public-health community views the mandatory labelling and taxation of fat as prom-ising tools to control the growth of food-related chronic disease. This paper is the …rst to propose an ex ante evaluation of these two policy options in an oligopolistic setting with dif-ferentiated products and heterogeneous demand. Using household scanner data on fromages blancs and dessert yogurts, we separately identify consumer preferences for fat and front-of-pack fat labels by exploiting an exogenous di¤erence in legal labelling requirements between these two product categories. Demand estimates are then combined with a supply model to evaluate both policies. In the absence of any producer price response, making fat labels man-datory reduces the fat supplied to regular consumers in this market by 38%; an ad-valorem tax of 10% (5%) on the producer price of full-fat (half-skimmed) products has a similar impact. Allowing producer price reactions, however, yields much smaller e¤ects: a 9% drop for the fat tax, and a fall of only 1:5% for mandatory labels. Producers thus neutralise up to 96% of the impact of mandatory labelling on demand, via large price cuts on products with large ex ante margins. This illustrates how market forces are largely able to defeat the intended e¤ect of market-based public-health interventions.
Acknowledgements: The authors thank Armelle Champenois for bibliographic research and Christine Boizot for data assistance. This paper bene…ted from discussions with Laura Grant and Eric Delattre, and comments by seminar participants at the 1st joint EAAE/AEAA conference (Freising, Germany), Imperial College, the York Seminar in Health Econometrics, the University of Paris 1, the ERS Conference on scanner data and food policy, the IRDES workshop on health policy evaluation, the Paris School of Economics and the Journées Louis-André Gérard-Varet. Financial support from the ANR-French National Research Agency, project No. ANR-07-PRNA-018 ALIMINFO, is gratefully acknowledged.
1
Introduction
What e¤ects do fat taxes and mandatory fat labels have in food markets? In the context of a worldwide rise in overweight and obesity, such market-based policies have attracted a great deal of interest from policy-makers and public-health advocates. We here provide an empirical evaluation of these interventions, comparing their e¤ects on key market indicators and health outcomes, such as equilibrium prices, market shares, producer pro…ts, consumer welfare, and the quantity of fat purchased by households.
Fat in calories available for human diet represents between 40 and 45% of total daily calorie intake in most OECD countries, as against 20-30% one century ago (Popkin and Gordon-Larsen, 2000; James et al., 2004; Oliver, 2006; Etilé, 2011). This trend has been related to the spectacular growth in obesity and overweight, which has reached epidemic proportions globally, with more than 1 billion adults being overweight worldwide in 2010 (OECD, 2010). In this context, the OECD has called for the implementation of tax policies on food items with high calory, fat, or sugar contents (Cecchini et al., 2010).1 A separate public policy proposed by the European Parliament is the mandatory labelling of the fat-content on fronts-of-packs (FOP): this is easier to use than the back-of-pack nutritional facts panel, which is already mandatory. FOP labels may help consumers to move from high to low fat-content products (Wansink et al., 2004; Grunert and Wills, 2007).2 To
date, FOP nutritional labelling has been voluntary. One key element of this debate is that voluntary FOP labelling does not only play an informational role, it also contributes to di¤erentiation and market segmentation. When labelling is voluntary, producers are more likely to display “low-fat” than “high-fat”labels on the FOP. This has two consequences. First, it is not obvious that making FOP labels mandatory will make consumers better o¤, as they can currently infer from the absence of any label that the product is high in fat. Second, the producer’s decision to introduce a FOP label may depend on unobserved consumer tastes, rendering labelling endogenous in the demand function. Whether fat-content regulation should remain voluntary or become mandatory is an important research question, and comparing the e¤ects (on consumers and …rms) of mandatory fat labelling to those of a fat tax policy should help to begin the answer.
Previous research has often used continuous-choice demand models to evaluate the impact of fat taxes (see, for example, Caraher and Cowburn, 2005; Mytton et al., 2007; Chouinard et al., 2007; and Allais et al., 2010).3 These allow for substitution between food categories, which are
more or less aggregated, but ignore any substitution either within food categories or towards an outside good. However, a fat tax is more likely to make consumers of high fat-content exit the market or switch to the nearest low fat-content counterparts in the same food group, rather than substitute one food category for another. In addition, producers’strategic reactions have generally
1 In 2009-2010, additional taxes on sugary drinks were proposed in at least 17 US States; Denmark introduced a 25% tax increase on ice cream, chocolate, sweets and soft-drinks in January 2010 (Danish Ministry of Taxation, 2009), and a tax on fat in October 2011; in France, a tax on soft-drinks was introduced in January 2012. 2 See EUFIC (2012) for an update on nutritional labels in the EU. 3 Noticeable exceptions are Gri¢ th et al. (2010), and Bonnet and Réquillart (2011).
been ignored, except in Gri¢ th et al. (2010) and Bonnet and Réquillart (2011). These latter analyse taxes on, respectively, saturated fats in butter and margarine and sugar in soft drinks, and estimate the …rms’tax pass-through rate to consumer prices in a di¤erentiated-product oligopoly setting.
The e¤ect of nutritional information on consumer choice has mostly been analysed via hypo-thetical consumer choices, which can lead to overestimation bias (Cowburn and Stockley, 2005).4 Empirical econometric evidence on the impact of mandatory food labels on natural shopping beha-viour is scarce. The major obstacles are the di¢ culty of …nding exogenous variations in producer label decisions and credible control groups. Nevertheless, some market-level analysis has exploited quasi-natural experiments, such as changes in labelling legislation due to the enactment of the Nu-trition Labelling and Education Act (Mathios, 2000; Variyam, 2008) or the lifting of a regulatory ban against the advertising of the health bene…ts of ready-to-eat cereal (Ippolito and Mathios, 1990). Other work has used …eld experiments in supermarkets (Teisl et al., 2001; Berning et al., 2010; Kiesel and Villas-Boas, 2010). These have provided mixed results. However, all of these have focused on U.S. back-of-pack or shelf labels, and have not explored any strategic producer reactions to mandatory labelling.
This paper attempts to avoid these pitfalls through the combination of the structural modelling of the market and a quasi-natural experiment. First, we use scanner data, disaggregated at both the household and product levels, to estimate a discrete-choice model of demand allowing for both substitution between products within a same food group and towards an outside option. We model the supply side as an oligopoly proposing di¤erentiated products, in the spirit of Berry et al. (1995) and Nevo (2001), to estimate the price-cost margins for each …rm, identify strategic price reactions, and determine the new market-price equilibrium implied by each food policy. Second, we exploit an exogenous source of variation in legal labelling requirements in the French market for dessert yogurts and fromages blancs5 to identify the causal impact of fat-content labels on consumer choice. The French labelling legislation requires producers to signal the percentage of fat contained in fromages blancs by a fat-content label displayed on the FOP, while fat-content labelling is not mandatory for dessert yogurts. In particular, producers never put FOP fat-content labels on full-fat dessert yogurts, but are required to do so for full-fat fromages blancs. Combining these exogenous variations in legal labelling requirements with brand labelling strategies, between products with di¤erent fat contents and between dessert yogurts and fromages blancs, and controlling for brands, distribution channels and demographics, we are able to identify consumer preferences for fat and fat-content labels separately.
Following the discrete-choice literature, we model consumer preferences using a Mixed
Multi-4 See Grunert and Wills (2007) for a detailed survey. 5 The fromage blanc is a creamy, soft, fresh, white cheese made with whole, half-skimmed or skimmed milk. In this paper, following the French legislation, we include in the fromages blancs category the faisselles, which have similar culinary uses. Dessert yogurts include products such as strained/Greek style yogurts and fromages blancs or yogurts mixed with cream or other animal fats.
nomial Logit model. In the estimation, we control for the (usual) endogeneity of prices, assuming that the product-speci…c valuation of the unobserved characteristics is independent from its past variations, but also for the (less classic) case where a characteristic is endogenous. As producers’ decisions to place a fat-content label on the packaging of a dessert yogurt may be correlated with unobserved consumer tastes, we also need to control for the endogeneity of fat-content labels. We do so by exploiting the quasi-natural experiment provided by exogenous variation in the labelling requirements for fromages blancs and dessert yogurts. Household-speci…c demand parameters are then identi…ed from panel scanner data collected from a representative sample of households in 2007. These estimates are used to compute producer price-cost margins, assuming that they com-pete à la Nash in a Bertrand oligopolistic game. The new market equilibrium implied by each fat policy can then be simulated.
We show that imposing FOP fat labels reduces the average yearly fat purchases by households by about 38% when the …rm response is ignored. This is largely due to an aversion to fat labels by consumers of dessert yogurts, which is interpreted as a desire to have the taste without the guilt of eating unhealthily. When producers can adjust their prices, we …nd, perhaps surprisingly, that mandatory labelling increases the market share of dessert yogurts. This comes from the large price cuts that producers would e¤ect, via drastic margin reductions ( 68% for full-fat dessert yogurts). As labelling becomes mandatory for all products, product di¤erentiation falls, which intensi…es price competition. The price response of producers of dessert yogurts is made possible by the sizeable initial margins on dessert yogurts, and high price elasticities just after the policy shock: the fall in margins is o¤set by the recovery of large market shares. Firms are able to o¤set 96% of the e¤ect of the policy on consumer demand.
Comparing mandatory labelling to an equivalent fat tax (meaning that tax rates are set such that each policy causes almost the same fall in average yearly fat purchases in the absence of any …rm response), we show that when the …rm price response is taken into account taxes are somewhat more e¤ective than fat labels in reducing household fat purchases: 9% vs. 1:5% respectively. One reason is that the fat tax maintains the market segmentation between fromages blancs and dessert yogurts, which avoids intensifying price competition. From a health-policy perspective, we suggest that the fat tax dominates mandatory labelling. From a consumer perspective, however, the opposite pertains: assuming perfect rationality, consumer welfare in this market rises by 53% under mandatory labelling, as a result of the fall in dessert yogurt prices, and falls by 2% with the fat tax. From the …rm’s perspective, both policies reduce pro…t, but considerably more so under mandatory labelling ( 21%) than under the fat tax ( 6%).
The remainder of the paper is organized as follows. Section 2 presents the data and discusses the boundaries of the market. Section 3 outlines the empirical model and the estimation strategy. The estimation results are then discussed in Section 4 and the simulations in Section 5. The last section concludes.
2
Data
We use household panel scanner data from Kantar Worldpanel (KWP) for the 2007 calendar year. The advantage of scanner data over the experimental or hypothetical choice approaches is that observations are based on actual purchases in a natural shopping environment. Consumer preferences can thus be identi…ed in a realistic setting.
There are 13; 380 households in the initial sample, which is nationally representative of the French population. The data record, on a weekly basis, all purchases of yogurts and fromages blancs for home consumption by the household over the year. The Universal Product Code (UPC) of each purchase is registered using a handheld scanner, as well as the quantity purchased and the associated expenditure. KWP does not provide UPCs, but a large set of product attributes. We choose to divide the year into 13 periods of four weeks (the time unit t in the next section). We thus focus on representative purchase behaviour in each four-week period, i.e. the choices that are the most-frequently observed in a sense that will be de…ned below.6
2.1
The relevant market
There are three broad categories of yogurts and fromages blancs: standard yogurts; standard fromages blancs; and dessert yogurts. This market was chosen for three reasons. First, it accounts for a quite substantial share of household fat purchases (2:75%). Second, a large variety of products are o¤ered, which allows consumers to easily switch from one brand to another. Last, the fact that labelling is mandatory in France for fromages blancs but not for yogurts makes it easier to identify consumer preferences over labelling and fat separately.
We restrict our analysis to plain products, which represent 43% of all purchases of yogurts and fromages blancs. Flavored yogurts and fromages blancs contain sugar additives. As such, fat-content labels may be less salient for consumers, and less relevant from a nutritional point of view.7 We also eliminate products that are not made from cows’ milk (4:5% of purchases), and drinking yogurts and yogurts with cereals, which account for less than 1:5% of purchases.
In the remaining sample, 46:3% of the households consuming fromages blancs over a four-week period also purchased standard yogurts, while only 5:4% purchased dessert yogurts. These statistics suggest that fromages blancs and standard yogurts are probably not substitutes competing on the same market, which is the case for fromages blancs and dessert yogurts. A formal test comes from analyzing household budget choices between standard yogurts, dessert yogurts and fromages blancs, in a classic demand-system setting. Household expenditures on these three categories are aggregated over the year, and local price indices are computed for each category, as in Lecocq
6 Gri¢ th et al. (2010) choose one unique random shopping trip during the calendar year. In our view, this method has the disadvantage of introducing more noise into the analysis of consumer preferences. 7 In addition, the French yogurt and fromage blanc market is characterized by a huge variety of ‡avors (249 di¤erent identi…ed ‡avors in our dataset), and considering all of these, or even grouping some ‡avors together, would have rendered the estimation of the model infeasible.
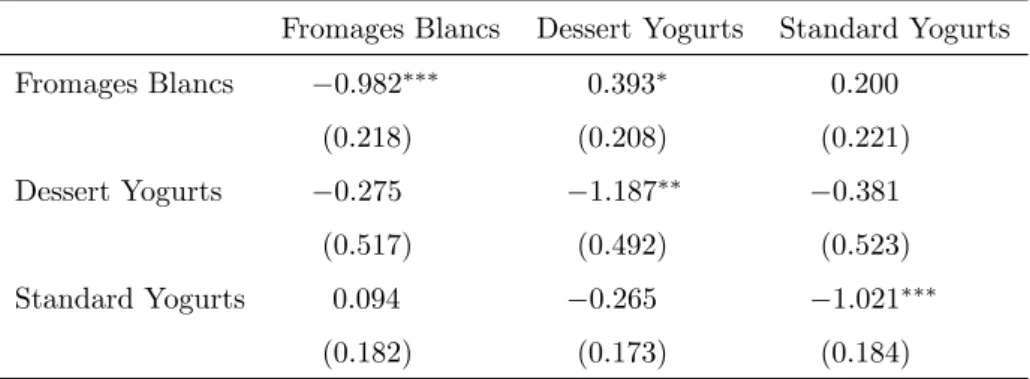
and Robin (2006). An Almost Ideal Demand System is then estimated and the uncompensated price elasticities are derived (Deaton and Mullbauer, 1980). We …nd only one signi…cant cross-price elasticity, indicating that fromages blancs are substitutes for dessert yogurts (the elasticity is +0:398). An increase in the price of dessert yogurts or fromages blancs does not signi…cantly impact the consumption of standard yogurts (see the additional results in Appendix A.1). The analysis will hence focus on the relevant market for plain fromages blancs, which includes plain dessert yogurts but not standard yogurts.8
Last, in order to aid our the identi…cation of consumer preferences, we only retain households which purchased fromages blancs or dessert yogurts in more than 10 weeks over the year. Since these households clearly have stable tastes for these products, we do not make inferences from noisy choices. This leaves us with data on 1785 households.
2.2
Product attributes
The data contain information on the fat content of all dessert yogurts and fromages blancs, as well as their texture, brand, pack size, type of milk used, whether it is organic or not, and whether probiotics (bi…dus) have been added or not. These attributes are used to de…ne the alternatives available on the French market in 2007.
2.2.1 Fat content and fat-content labels
We sort the products into three fat-content categories: full-fat (more than 6% fat), semi-skimmed (between 3% and 6%), and skimmed (less than 3%).9 Fat-content labels are mandatory for all
fromage blanc products.10 However, the data do not provide any information about the presence
of fat-content labels for dessert yogurts. We therefore collected additional data from a number of information sources. The main source is Mintel’s Global New Products Database (GNPD), which shows high-resolution color images of the packaging of 80% of the products in our dataset, and their changes over time. This information is complemented by an examination of the monthly French publication Linéaires, which provides detailed descriptions and pictures of a number of new food products launched in France every month. Last, we also visited the popular website www.‡ickr.com, which proposes more than 4 billion images, the French consumer network website www.ciao.fr, and, for a small number of products, old TV advertisements from the on-line audiovisual archives available of the Institut National de l’Audiovisuel.
8 This result is in line with the professional practice in marketing of considering that dessert yogurts and fromages blancs compete on the market of fromages frais, while yogurts form another market: see for instance the trade publication Linéaires, No. 173 (September 2002), p.98, No. 187 (December 2003), p.110, and No. 190 (March 2004), p.74. A last argument supporting this view is that fromages blancs and dessert yogurts often have the same culinary use: they are both served as desserts, with sugar, jam, honey or fruit frequently being added. 9 This corresponds closely to the division adopted in food marketing, see for instance the professional review Linéaires, No, 187 (December 2003), p. 110. 1 0 See the décret 88-1206 in the Journal O¢ ciel de la République Française, 31/12/1988.
2.2.2 Other characteristics
We control for a number of other product characteristics, which were selected because they were signi…cant in preliminary regressions. Di¤erences in hedonic characteristics are captured by a set of discrete attributes indicating whether the product is a fromage blanc or a dessert yogurt, and whether its texture is smooth. Health characteristics other than the fat content are captured by a dummy variable indicating whether the product is organic or has probiotics added. Another binary variable shows whether the product is sold in individual portions (200g or less). Last, there are 15 dummy variables that control for brand heterogeneity. These include the main national producers (Yoplait, Danone, Triballat, etc.) and retailer brands (Carrefour, Leclerc, Intermarché, etc.). The small national brands are grouped together, along with the small retailer brands. We also control for three levels of brand quality (low-, medium- and high-quality brands). The low-quality category includes hard-discount and …rst-price retailer brands. The national and high-quality retailer brands form the high-quality category. These attributes together de…ne 279 distinct varieties of dessert yogurts and fromages blancs.
2.3
Household choice set, choice and prices
These 279 products discussed above are distributed through a number of stores, supermarkets and hypermarkets. To simplify the analysis, we de…ne 14 homogenous categories of distribution channels, according to criteria such as the company name (for supermarkets and hypermarkets) and the store format (hard-discount, hyper and supermarkets, grocery stores).11 We retain these
two criteria because they are signi…cant determinants of quality positioning and pricing strategies. For each distribution channel, we assume that the set of products observed in the yearly purchase data is that which was available in each period.
We know the distribution channels that were visited by each household in each period. We de…ne each household choice set as the set of all products available in these channels. Choice sets therefore vary both from one period to another for the same households, and across households (even living in the same place) in the same period, if they visited di¤erent distribution channels.
There are two situations regarding household choice in each period. If the household did not make any purchases or purchased a single product, then de…ning choice is not a problem. However, when more than one product was purchased, we have to choose that which is the most representative of household preferences. In order to avoid arbitrary choices, we select this at random with the selection probabilities being proportional to the share of each product in the household’s annual
1 1 The 14 distribution channels are: independent hard discount such as Lidl and Aldi; hard discount Ed; hard discount Leader Price-Franprix; hyper and supermarket Intermarché; hypermarket Carrefour; hypermarket Casino; hypermarket and supermarket Cora; hypermarket Auchan; hypermarket Leclerc; hypermarket and supermarket U; supermarket Carrefour (Stock, Shopi, and Proxi); supermarket Casino (Monoprix, EcoService, PetitCasino, Spar, and Maxicoop); supermarket Auchan (Atac, and Maximarché); and other distribution channels such as cheesemon-gers, and grocery stores.
purchases.12 The price of each product in the household-choice set is constructed in two steps. We
…rst calculate the mean unit price for this product by distribution channel and period; we then average these mean unit prices over the distribution channels that were visited by the household during the period. Prices thus vary over time and between households according to the distribution channels visited.
2.4
Market characteristics
Given that the estimation procedure is time-consuming, we reduce the dataset to an extent by ran-domly selecting …ve periods for each household. To avoid having too much noise in the estimation process, we also exclude products that were purchased less than 10 times in a period. This leaves us with 224 di¤erent products. Table 1 presents the summary statistics of the product characteristics, in the universal choice set containing all products and in the union of all household choice sets. Note that there are far fewer low- and medium-quality products in the latter than in the former, simply because many of these are private labels that can be found in only one distribution channel.
[Table 1 about here]
The main market characteristics are described in Table 2. The …nal sample contains 8; 975 observations on the choices of 1; 795 households over …ve periods. First note that 12 out of the 24 semi-skimmed dessert yogurts have fat-content labels, while none of the full-fat dessert yogurts (20 products) do. Fromages blancs account for 70:8% of choices, dessert yogurts 23:9%, and the outside alternative of consuming none of these products over a four-week period for 5:4%. More than 54% of the fromages blancs purchased are semi-skimmed, about 23% are skimmed, and as many are full-fat. By way of contrast, 72% of the dessert yogurts purchased are full-fat. On average, full-fat products are more expensive than the others, with smaller variations in prices for dessert yogurts than for fromages blancs.13
[Table 2 about here]
2.5
Household characteristics
Our empirical speci…cation also includes household characteristics: income quartiles, household size, and three dummy variables indicating whether the head of the household is aged over 65, whether the main shopper is classi…ed as being risky overweight (BMI>27), and whether the main shopper is a man. Table 3 shows the mean and standard deviation of these variables, amongst others, in the estimation sample. These variables are interacted with product attributes in the estimation to account for the e¤ect of observable characteristics on preferences.
1 2 For instance, if there are two goods, and the household purchased a quantity Q1 of good 1 and a quantity Q2 of good 2 over the year, then the probability of selecting good 1 in a four-week period where both goods were purchased is Q1=(Q1 + Q2). 1 3 The fromage blanc is a traditional food product. As such, some product varieties are prestigious and expensive.
[Table 3 about here]
3
Empirical modeling
Following the empirical industrial organization literature , market equilibrium is modeled combining a ‡exible discrete-choice model of demand with a linear-pricing model of supply. This section describes this analytical framework, together with the estimation strategy and the simulation of each policy option.
3.1
Structural model for the demand side
Consumer preferences are modeled in a random-utility framework, via a Mixed Multinomial Lo-git model (MMNL) (Berry et al., 1995, McFadden and Train, 2000). Preferences over product characteristics are speci…ed in a ‡exible manner, as this allows for both observed and unobserved heterogeneity in the intercept and slopes of the utility function. Household heterogeneity in the Willingness-To-Pay (WTP) for fat-content labels can thus be more precisely estimated. The MMNL also relaxes the “Independence of Irrelevant Alternatives”constraint imposed by the standard Con-ditional (or Multinomial) Logit model, which is unlikely to hold at the aggregate level as the choice set varies from one household to another.
3.1.1 The random utility model
Each household i = 1; :::; N faces a set of Jit products in a choice situation t = 1; :::; T .14 Each
product j 2 Jitis described as a bundle of characteristics. As in many other papers, we assume that
all product characteristics are observable (or can be observed by careful inspection) by consumers but some are unobserved by the econometrician. Examples of the observable characteristics are package size, brand, nutritional facts, etc; the unobserved characteristics include the position of the product within the range of products sold under the same brand or the way it is displayed and advertised in a particular distribution channel.
Formally, denote by pijt the price of good j faced by household i in period t, and lj the binary
variable indicating whether a fat-content label is displayed on the packaging of j. Further, let xj denote the vector of observed exogenous attributes of j and let j = 0 be the outside (or no
purchase) option, whose characteristics are all set to zero. Considering that each household buys only one product at a time, the utility that household i obtains from the consumption of one unit of good j in period t can be written as
uijt= vijt+ "ijt= vi(pijt; lj; xj; pi; l
i; i) + "ijt; (1)
1 4 In the empirical section below, a choice situation is de…ned as a four-week period; the set of products is indexed by i as households visit di¤erent distribution channels and therefore face di¤erent choice sets (see Section 2).
where vijt is the deterministic part of utility, depending on the observed attributes of j, pi, li
and iare parameters representing the preferences of household i over pijt, lj and xj, respectively,
and "ijt is unobserved utility. The latter captures consumer valuation of the unobserved product
characteristics.
3.1.2 Endogenous prices and fat-content labels
There is empirical evidence that some of the observed and unobserved characteristics are correlated, producing endogeneity problems (Berry, 1994). For instance, promoted products are often moved to the front of the shelf, advertised and sold at a lower price at the same time. The estimated impact of observed prices on demand will then capture both a true price e¤ect and the e¤ect of unobserved marketing. Prices may also be endogenous if some unobserved characteristics are positively valued by consumers, who thus are ready to pay a premium for them. This may be taken into account by producers in determining their prices. In both cases, we have E("ijtj pijt) 6= 0.
We instrument the current price by its lagged changes. The identifying assumption is that, controlling for brands, distribution channels, and demographics, the individual valuation of the product-speci…c unobserved characteristics, "ijt, is independent of its own past changes. Given
this assumption, the valuation of a particular product will be independent of the price changes for that same product in the same distribution channel.15 At the same time, common production
and/or distribution costs imply that the price of a product within a distribution channel will be correlated with its past changes, which can therefore be used as valid instrumental variables (IVs). The price changes that we consider are those observed between the current and the last period. They are constructed in the same way as the price levels: for each product, the mean unit price and its change are …rst calculated for each distribution channel and period; these mean unit price changes are then averaged over the distribution channels that were visited by the household in the corresponding period.
Most papers dealing with endogeneity in MMNL models have focussed on price endogeneity, assuming the exogeneity of all other observed characteristics. We here relax this assumption for the fat-content label, as the producer’s decision to put a fat-content label on the packaging of a dessert yogurt may be correlated with some unobserved consumer tastes. In this case, E("ijtj lj =
1) 6= E("ijtj lj= 0).
An IV for fat-content labels can be constructed by exploiting the “quasi-natural experiment” from the exogenous variation in labelling rules between fromages blancs and dessert yogurts. Con-sidering the absence of label as a treatment, we know that the probability of being treated is zero for fromages blancs, regardless of their fat content (since labelling is mandatory), and more or less positive for dessert yogurts, depending on their fat content. The marginal value of a
fat-1 5 This is similar to Villas-Boas and Winer (1999), except that they instrument current prices by past price levels. This choice is valid only if "ijt is uncorrelated over time. Here, we rather consider that "ijt is likely to be stable through time, because it essentially relates to time-invariant attributes such as the colour and the shape of the packaging and the product name.
content label is then identi…ed from the empirical market shares, using a di¤erence-in-di¤erence estimator, assuming that the di¤erences in unobservable factors between consumers of full-fat and semi-skimmed products are the same for fromages blancs and dessert yogurts. This assumption and the resulting exclusion restriction hold if the consumers of fromages blancs are not more sensitive to a fat increase than the consumers of dessert yogurts. In addition, it seems reasonable to consider that the decision to label a dessert yogurt is taken once and for all when introducing the product on the market. Changes in unobserved factors over time, in customer services or the perception of the product for example, have little to do with this (Ackerberg et al., 2005). Last, the interaction between the dessert yogurt and the semi-skimmed (or full-fat) dummy variables is a good predictor of the producer’s labelling decision: the fatter the dessert yogurt, the less likely the producer is to signal this to consumers. In our data set, full-fat dessert yogurts are indeed never labeled.
3.2
Empirical estimation of the demand functions
3.2.1 A control function approach to endogeneity
To correct for price and fat-content label endogeneity, decompose "ijt as
"ijt=e"pijt+e" l
ijt+e"ijt; (2)
where e"pijt is the error component related to the price, e"lijt the error component related to the presence of a label, ande"ijt is an iid extreme-value term.
We then apply a control function approach, as proposed by Petrin and Train (2009) for discrete-choice models. Consider the following orthogonal decompositions fore"pijt ande"lijt
e"pijt= p p
ijt+ p pijt and e" l
ijt = l lijt+ l lijt; (3)
where pijt and l
ijt are jointly normal, and p
ijt and lijt are iid standard normal (whose standard
deviations p and l are estimated). In this equation, p
ijt and lijt represent the variations in
prices and fat-content labels that are explained neither by the other observed variables nor by the instruments, and which may a¤ect utility (if p or l 6= 0). There is endogeneity as these unobserved factors are correlated with prices or fat-content labels. The control-function approach explicitly takes into account the e¤ect of pijtand l
ijt on utility, by introducing proxy measures of
these variables into the estimations. These proxy measures are constructed in a …rst stage, as the residuals from the regressions of the price and fat-content label variables on all of the exogenous variables and the instruments, zijt
pijt= pzijt+ pijt and lj= lzijt+ lijt; (4)
where p and l are vectors of parameters. The estimated residuals, ^pijt and ^lijt, are called the control functions. Their introduction, as additional explanatory variables, in the regressions solves the endogeneity problem.
3.2.2 Parameterisation of the utility function
Combining (1) to (3), and assuming a linear speci…cation for the deterministic part of the utility function vi( ), we have
uijt= vijt+ 'ijt+e"ijt; (5)
where
vijt = pipijt+ lilj+ 0ixj and 'ijt= p^ p ijt+ l^l ijt+ p pijt+ l l ijt: (6)
The tastes for observed product characteristics, pi, l
i and i, are modeled as a function
of observable household characteristics. As we are primarily interested in the heterogeneity of consumer preferences for fat-content labels, we further allow pi and l
i to depend on unobservable
household characteristics. Formally, denote respectively si and i as the vectors of observed and
unobserved attributes of household i, and let i= ( pi; li). Then
i= + i+ Asi and i = + Bsi; (7)
where = ( p; l) is the vector of average tastes for the price and the label in the population, and
A, B and are respectively two matrices and a symmetric matrix of parameters (speci…cally, is the Cholesky decomposition of the covariance matrix of i). Under this speci…cation, the elements
of + i correspond to the random coe¢ cients for the price and label variables; we assume that p
i follows a log-normal distribution and li a normal distribution.16 The two distributions are
correlated (the o¤-diagonal element of is non-zero). We hence end up with a MMNL model with mixing over the error components and random coe¢ cients for the endogenous variables.
3.2.3 Likelihood and estimation procedure
The choice probabilities can be obtained by summing the choices implied by the utility model over the distribution of the unobserved attributes of households in the population of interest, i
ande"ijt, as well as over the distribution of the error components, pijt and lijt. De…ne yijt as an
indicator variable which equals 1 if household i purchases good j in period t, and 0 otherwise. Each household is supposed to choose the utility-maximizing option, and assuming that ties occur with probability zero, the choice criterion is
yijt = 1 if uijt> uikt 8j 6= k; (8)
= 0 otherwise.
Under the additional assumptions that there is no error component, i.e. e"pijt=e"lijt = 0, and that household heterogeneity enters the utility function only through the additive error terme"ijt, i.e.
si= i= 0, the model reduces to the standard Multinomial Logit model (MNL).17
1 6 The estimation does not converge when assuming a log-normal distribution for both coe¢ cients. 1 7 Although very attractive because of its extreme tractability, the MNL model unreasonably restricts substitution patterns (see, for example, Berry, 1994).
In the hypothetical situation where e"pijt,e"lijt and i are observed and are di¤erent from zero,
the above model corresponds to a MNL formulation where the observed product characteristics and household attributes are interacted, with choice probabilities given by18
P (yijt= 1 j ijt; i; ) =
exp(vijt( i) + '( ijt))
1 +Pk2Jit;k6=0exp(vikt( i) + '( ikt))
; (9)
where ijt = f pijt; lijtg, is the full parameter set, P (yijt= 1 j ijt; i; ) is the probability that
alternative j is purchased by household i at time t conditional on ijtand i, and the utility derived
from the consumption of the outside alternative is normalized to zero. The probability of observing the sequence of choices made by household i in periods t = 1; :::; T , denoted wi = fyijt= 1gTt=1, is
then P (wij ijt; i; ) = T Y t=1 X j2Jit
yijtP (yijt= 1 j ijt; i; ): (10)
However, since ijt and i are not actually observed, the relevant probability has to be
uncondi-tional, as follows
P (wij ) =
Z
P (wij ijt; i; )g( ijt)f ( i)d id ijt; (11)
where f ( i) is the joint density function of i and g( ijt) = ( p
ijt) ( lijt), with ( ) being the
standard normal density function.
Given that each component of ijtand i adds a dimension to the integral, it is not possible to
solve (11) analytically by integrating out over ijtand i. The most common solution is to replace
the choice probability by the following unbiased, smooth and tractable simulator e P (wij ) = 1 D D X d=1 P (wij ijtd; id; ); (12)
where ijtdand iddenote the d-th draw from the distributions of ijtand i, and D is the number
of draws. The simulated log-likelihood function can then be written as e L( ) = N X i=1 ln eP (wij ): (13)
The estimation procedure consists of two steps. First, the residuals ^pijt and ^lj are predicted
by regressing the price and label variables on the instruments, all product characteristics, includ-ing their interactions with household attributes, as listed in Table 3, and the distribution channel and brand …xed e¤ects.19 These residuals are then used as control functions in the above
likeli-hood function. The variance-covariance matrix is corrected to account for the additional variance introduced by the …rst-stage estimation.
1 8 In order to make the presentation simpler here, all of the other conditioning arguments (product and consumer attributes, reduced-form residuals) are omitted. 1 9 The identifying instrument for label is signi…cant at the 1% level in both …rst-stage regressions; the IV for price is signi…cant at the 1% level in the label regression and at the 10% level in the label regression.
3.2.4 Empirical identi…cation of the distribution of consumer tastes
The empirical identi…cation of MMNL models is known to depend on the richness of the data in terms of variation in the explanatory variables.20 Cherchi and Ortúzar (2008) investigate the e¤ect of data richness on the empirical identi…cation of the binomial version of the MMNL. Using Monte Carlo simulations, and assuming that choice sets di¤er across observations, they …nd that data richness does indeed matter and, in particular, that identi…cation problems arise when slope heterogeneity is applied to a characteristic that has little variability between alternatives. They also show that the observation of more than one choice per individual (e.g. panel data) makes empirical identi…cation easier and sharply reduces the e¤ect of sample size. Their analysis, however, focusses on continuous characteristics. The identi…cation of slope heterogeneity in both continuous and discrete variables, and the impact of choice-set variation (across individuals and/or markets) on identi…cation are addressed in Lecocq (2010). Monte Carlo results show that MMNL models are empirically identi…ed when they are estimated on panel data, regardless of the type of variable, even when the set of alternatives is the same for all observations. Variation in the choice set strengthens identi…cation for discrete characteristics.
By construction, we here retain as much information and variability as possible: …ve choices are observed per households and the choice set of available products varies from one choice situation to another and across households (via the distribution channels). This guarantees the empirical identi…cation of slope heterogeneity for any type of variable.
3.3
Structural model for the supply side
Producers are likely to adjust to exogenous shocks, and ignoring their strategic behaviour may lead to biased estimates of the e¤ect of public policies (Gri¢ th et al., 2010; Bonnet and Réquillart, 2011). The simulation of policy e¤ects on market equilibrium therefore requires a structural model of the supply side. In the demand model, two variables result from …rms’strategic decisions: price and label.21 However, it seems reasonable to suppose that the labelling decision is taken when the
product is introduced, and is not a¤ected by a fat tax (it becomes strictly exogenous in the case of mandatory labelling).22 We thus focus on price as the …rm’s only strategic variable.
2 0 Proofs of the theoretical identi…cation of MMNL models have recently been provided, under the assumption that the set of alternatives di¤ers across observations (see Bajari et al., 2012; Berry and Haile, 2009, 2010; Fox et al., 2011). Even when a model is shown to be theoretically identi…ed, it may not be empirically identi…ed, because the data do not support it. We here discuss empirical identi…cation. 2 1 While the explicit modeling of the …rm’s pricing strategy is now common in the literature, modeling the …rm’s choice of characteristics is both rarer and complicated: see Crawford and Shum (2001), who model the …rm’s choice of quality but only deal with monopoly situations with one observed characteristic; another approach mentioned by Ackerberg et al. (2007) is similar to Olley and Pakes (1996) and requires dynamic modeling. 2 2 This is justi…ed by the fact that …rms often prefer to introduce new food products rather than modify the characteristics of existing ones.
3.3.1 The linear-pricing model
We assume that …rms compete à la Nash-Bertrand, i.e. by setting prices in order to maximise their pro…t conditional on the demand parameters and other …rms’prices, as in Berry et al. (1995) and Nevo (2001).23 Suppose that there are M producers on the market, each producing a subset G
m
of G, the total number of products on the market. Denoting by pj and cj the price and (constant)
marginal cost of production of product j, respectively, the pro…t of producer m, m, can be written
as
m=
X
j2Gm
(pj cj)sj(p; );
where sj(p; ) is the predicted market share of product j for all j 2 G, depending on the prices of
all products, p, and demand parameters.24 Market share is calculated as sj(p; ) =Pi;tP (yijt =
1 j ), where
P (yijt= 1 j ) =
Z
P (yijt= 1 j ijt; i; )g( ijt)f ( i)d id ijt; (14)
which can be approximated by simulation, with P (yijt = 1 j ijt; i; ) given by (9). Assuming a
pure-strategy Nash equilibrium in prices, the price of good j produced and sold by producer m must satisfy the following …rst-order conditions
sj(p; ) + X k2Gm (pk ck) @sk(p; ) @pj = 0; (15)
for all j 2 Gmand m = 1; :::; M . Solving (15) provides the price-cost margins for each product, as
a function of the estimated demand parameters. Given the observed prices, the marginal costs are identi…ed. Assuming that the marginal costs and demand parameters are …xed, the equilibrium condition (15) can then be used to identify the impact of public policies on the market equilibrium (equilibrium prices and market shares). We analyze the mandatory labelling of all dessert yogurts on the one hand, and a fat tax proportional to the fat content on the other.
3.3.2 Simulation algorithm
The implementation of mandatory labelling implies the replacement of the label variable by a vector of ones, l .25 We recalculate, for each producer m and each item in G
m, the new market shares,
sj(p; ), and all of the corresponding derivatives, @sk(p; )=@pj, using the new label variable, l ,
the estimated demand parameters and probability (14), where vijt and cijt are now as follows
vijt= vij = pipj+ lilj+ 0ixj and 'ijt= p^ p j+
p p ijt:
2 3 A recent literature enriches this setup, by taking vertical relationships between manufacturers and retailers into consideration (see Villas-Boas, 2007; Bonnet and Dubois, 2010; Bonnet et al., 2012). The hypothesis of capacity constraints is maintained, which means that our results will pertain to the short-term equilibrium e¤ects of policies. 2 4 For each product, there is now one single price which is the average, over periods and distribution channels, of the mean unit prices computed in Section 2.3. This therefore no longer depends on the i and t subscripts. 2 5 We assume that the labeling cost is zero or negligible for two reasons: …rst, as the fat-content is listed in the nutrient facts displayed on the packaging of all products, its determination for dessert yogurts is costless; second, as mandatory labeling simply consists in sticking a fat-content label on the front of the packaging, marketing and associated costs should be small relative to the product’s total cost.
The terms used to correct for label endogeneity here vanish from the 'ijtexpression since the label variable is strictly exogenous once the policy is implemented. The …rst-order conditions (15) are then used to …nd a new price vector, p0, given sj(p; ) and @sk(p; )=@pj. If p0 is close enough
to the observed price vector, p, equilibrium prices are unchanged. Otherwise, a new price vector, piter, at the iter-th iteration is derived from
sj(piter 1; ) + X k2Gm (pk;iter ck) @sk(piter 1; ) @pj;iter 1 = 0; for all j 2 Gm and m = 1; :::; M . The market shares are obtained using (14) with
vijt= vij = pipj;iter 1+ lilj + 0ixj and 'ijt= p^ p
j;iter 1+ p pijt;
where ^pj;iter 1is the residual from the regression of pj;iter 1on zijt and all exogenous variables.
We iterate over piter until convergence is reached, that is when maxjjpj;iter pj;iter 1j < 10 5.
We assume that the fat tax is ad valorem, proportional to the fat content, such that the consumer price for product j is
pj = (1 + cat;j)pj
where pj denotes the producer price for product j and cat;j the tax rate assigned to product j
in the fat-content category cat. Below, cat;j is set equal to 0, 0:05 or 0:10 when j is a skimmed,
semi-skimmed or full-fat product, respectively. In the same way as for the algorithm described to calculate equilibrium prices under mandatory labelling, we obtain a new vector of producer prices, piter, at the iter-th iteration solving
sj(p ; ) + X k2Gm (pk;iter ck) @sk(p ; ) @pj (1 + cat;j) = 0;
for all j 2 Gm and m = 1; :::; M , where p represents the new consumer price vector whose j-th
element pj is given by pj = (1 + cat;j)pj;iter 1. As above, we iterate over the producer price
vector until maxjjpj;iter pj;iter 1j < 10 5.
4
Estimation results
This section presents the MMNL estimates obtained using the control function approach described in Section 3 to correct for the endogeneity of price and label variables. All of the estimations below are carried out using 500 Halton draws.26 The variances of the estimators are corrected by standard formulae for two-step estimators (Murphy and Topel, 1985), given the additional variation due to the introduction of the residuals from the …rst-step instrumental regressions.
2 6 One di¢ culty with MMNL models is that the simulated log-likelihood functions are not as well-behaved as standard log-likelihood functions. In particular, using too few draws in the simulator (12) may mask identi…cation issues (see Chiou and Walker, 2007). These can be revealed by the instability of parameter and standard error estimates as the number of draws increases. We estimated the model for D = 100; 200; 300; 500 and 1000 draws, and obtained stable estimates from D = 300 onwards. These results are available upon request from the authors.
4.1
Utility functions
Table 4 shows the estimated coe¢ cients of the MMNL model: these can be interpreted directly in terms of marginal utilities. As outlined in the previous section, price and label marginal utilities have both deterministic and random components. The …rst column shows the mean marginal utility of the product characteristics for a reference main shopper who is a woman aged under 65, with BMI under 27, living in a household in the top income quartile. The second column shows the estimated standard deviations of each random component. All are signi…cant at the 1% level, indicating that the marginal utilities of price and label do vary with unobservable household characteristics. The remaining columns list the coe¢ cients for a number of interactions between the product characteristics, listed in the …rst column, and the household characteristics, in the …rst row (household income quartiles, household size, the main shopper being risky overweight, a man, and aged over 65). For instance, the di¤erence in the mean marginal utility of price between the reference shopper and one in the …rst income quartile (…rst line, fourth column) is 0:232 utility units. The bottom part of Table 4 provides the estimates of the price and label control functions and the variances of the associated error components.
[Table 4 about here]
As expected, the probability of choosing an alternative falls with its price. The marginal utility of price is the inverse of the marginal utility of income. Its mean is negative ( 1:870), and larger for households below median income, which is consistent with poorer households having a higher marginal utility of income. The standard deviation of the random e¤ect on price is fairly high (1:995), implying that the marginal utility of income is very heterogeneous, beyond the e¤ect of the observed socio-demographic attributes.
Fat-content labels have, on average, a positive value (0:592 for the reference individual), but once again the standard deviation is large relative to the mean e¤ect (3:850): there considerable unobserved heterogeneity in household preferences over these labels. The elderly tend to dislike fat-content labels, while there is a hump-shaped income e¤ect peaking in the second income quartile. The marginal utility of labels is not signi…cantly higher when the main shopper is risky overweight (BMI>27). The random unobserved household attributes are negatively correlated, with a coe¢ -cient of 0:77. A strong taste for labels is likely associated with a greater marginal disutility of price, which limits the willingness-to-pay for labels.
The coe¢ cients on the control functions, at the bottom of Table 4, are both positive and signi…cant. Ignoring label endogeneity leads to over-estimates of the marginal utility of labels, with an estimated mean base coe¢ cient of 1:710 (instead of 0:592). This suggests that, when labelling is not mandatory, …rms display labels according to the consumer valuation of some unobserved product characteristics. It is easy to imagine that, in the case of semi-skimmed dessert yogurts, the label is just one component of the whole packaging, which can also generate hedonic and
health expectations through the use of speci…c colors, shapes, etc. (see inter alia Ares and Deliza, 2010). Likewise, the marginal disutility of price is slightly underestimated when the presence of unobserved product characteristics is ignored ( 1:763 vs. 1:870).
Households tend to prefer semi-skimmed and full-fat products to skimmed ones. This taste for fat is more developed in low-income households, and when the main shopper is a man or elderly. Valli and Traill (2005) have previously found that the French dislike low-fat yogurts, as compared to the British, Dutch, Spanish and Portuguese. It is worth noting that risky-overweight shoppers prefer either low-fat or full-fat products to semi-skimmed ones. This may suggest two di¤erent types of consumers among those at risk for overweight-related diseases. The literature in sensory research emphasises that two kind of motives underlie consumer preferences for fat in dairy products. The fat content is positively related to taste and immediate hedonic pleasure (Wardle and Solomons, 1994; Westcombe and Wardle, 1997), but may also be negatively related to healthiness via delayed health damage (Grunert et al., 2000). Risky-overweight individuals are more likely to be concerned by the fat-disease relationship, but also to exhibit a strong taste for fat. The polarization of their preferences between low- and full-fat products then likely re‡ects opposite hierarchies of purchase motives: for some health matters more than taste, while the reverse holds for others.
Table 4 also reveals that low- and medium-quality products are much less popular than high-quality ones for high-income households, while they have more success in low-income and large households. Male main shoppers are less likely to like products sold in small portions.27 Last,
the bi…dus/organic characteristic has no signi…cant e¤ect on utility, while smooth textures are associated with a utility loss, consistent with the fact that non-smooth varieties (especially faisselles and fromages blancs de campagne) are considered as luxuries and part of French culinary culture.
4.2
The Willingness-To-Pay for a fat-content label
The Willingness-To-Pay (WTP) for a label is de…ned as the change in price (here expressed in e) that keeps utility unchanged when a fat-content label is added to the front and sides of the pack-aging. A speci…c WTP can be calculated from the estimates, conditional on household-speci…c information (observed choices, product and household characteristics), from equation (??) in Appendix A.2.
Our key …nding is that a non negligible fraction of households (38%) have WTPs less than or equal to zero (see Table A.2 in the Appendix).28 This proportion varies by demographic group,
but not very much: in particular, it is the same whether the main shopper in the household is risky overweight or not, and only slightly higher (41%) when the shopper is obese; moreover, it is only
2 7 This gender e¤ect is consistent with previous …ndings in the nutrition literature. In France, as in many countries, body standards are “imposed far more vociferously on women than on men” (Stearns, 2002, p.189). As a result, women are more prone to restrict their consumption in order to control their weight. Small-portion packs are seen as an e¤ective means of controlling consumption (Stroebele et al., 2009). It is thus unsurprising that women have a greater taste for small portions. 2 8 Note that, when we constrain the marginal utility of information to be positive, the estimates do not converge, showing that such this restriction is rejected by the data.
a little lower in the …rst income quartile (35% vs. 39-40% in the upper quartiles), which suggests that labelling policies may not have regressive welfare e¤ects.
Fat-content labels are thus not positively valued by all consumers, and mandatory labelling may then reduce their welfare, at least in the short run. This result is at odds with the stand-ard predictions from the economics of information, where information provision is considered to always enhance consumer welfare as it favors market segmentation, which leads to a better match between consumer preferences and product characteristics. Here, it seems that it is the absence of information that favors product di¤erentiation and market segmentation. As noted above, fat is a vector of immediate hedonic pleasure, but also produces unpleasant health consequences. When consumers are in con‡ict between the short-term pleasure of eating and the long-term goal of health preservation, informing them of the nutritional value of the choice options is likely to increase the anticipated guilt and psychic costs associated with less-healthy products. The fall in utility is larger for consumers who have a strong hedonic taste for fat (Wansink and Chandon, 2006, Kivetz and Keinan, 2006, Okada, 2005). They may thus prefer not to deal with information, in order to peacefully enjoy the pleasure of eating a product that they enjoy.29 Nevertheless, it remains the case that a large majority of households are ready to pay positive amounts to have fat-content labels displayed on the front-of-pack. This is also true for those in the …rst income quartile and with a risky-overweight/obese main shopper, which suggests that the welfare bene…ts produced by fat-content labels are likely to be positive in the populations usually targeted by public-health policies.
One last remark is in order. Caplin and Leahy (2001) propose a theoretical framework that can be used to rationalize preferences for ignorance. The basic idea is that individuals may be subject to anticipatory feelings of anxiety in their current utility when the distribution of choice outcomes is uncertain. This can induce aversion to information, as the worst distribution can emerge from the resolution of uncertainty (see Köszegi, 2003, for an application to medical check-ups). Although this type of preference departs from traditional utility speci…cations, it does not require that we abandon the principle of revealed preferences. As such, we can use the estimated utility functions for welfare analysis.
4.3
Price-cost margins
Marginal costs are recovered for each product by inverting the …rst-order conditions in (15). Their mean (and standard deviation), as well as the associated average price-cost margins, are then computed for each producer. These cannot however be listed in detail here for con…dentiality
2 9 Marketing research has shown that anticipation of guilt feelings plays an important role in food choices (Baumeister, 2002; Dhar and Simonson, 1999; Shiv and Fedorikhin, 1999; Wertenbroch, 1998; King et al., 1987). The trade publication Linéaires, covering the launch of a new dessert yogurt in its issue of April 2001 (p. 50), reports that the producer explicitly wanted to avoid feelings of guilt among consumers. This was made through the choice of packaging colors and words reminiscent of "lightness" (a light blue colour scheme, the words "pearl" or "foam" etc.).
reasons. On average, the marginal costs and price-cost margins are equal to e1:33 (with a standard deviation of e0:69) and 47%, respectively. Unsurprisingly, unit costs are lower for the main retailer brands (between e0:73 and e1:02) than for the main national brands (between e1:23 and e1:69) Nevertheless, the price-cost margins for both types of brands are quite similar, so that di¤erences in production costs are passed onto consumer prices. The top panel of Table 7 shows the initial market shares, producer prices and margins for …ve categories of products (skimmed, semi-skimmed and full-fat fromages blancs, and semi-skimmed and full-fat dessert yogurts). The margins are between 60% and 70% for the dessert yogurts, and around 45% for the fromages blancs.
5
Ex ante policy evaluation
The methodology described in Section 3.3 is applied to the above-estimated demand functions, to ex ante evaluate two fat policies: (i ) mandatory labelling requiring all products to label fat-content on the front-of-pack; and (ii ) an ad-valorem fat tax. Tax rates are set so as to produce a meaningful comparison between the two policies. As one key comparison criterion is household fat purchased, we choose the tax rates for semi-skimmed and full-fat products so as to yield approximately the same reduction in total fat purchases as mandatory labelling, in the absence of any …rm response. Increasing producer prices by 10% and by 5% for full-fat and semi-skimmed products respectively produces this result (see the …rst line of Table 5).30
The policies are simulated both with and without a producer price response, to compare their e¤ectiveness in reducing the quantity of fat purchased, and their impact on market shares, prices and consumer surplus. We …rst present the results in terms of health (fat purchases) and welfare. We then explore in detail the market mechanisms behind these results.
5.1
The change in household fat purchases and welfare
Table 5 lists the change in household annual fat purchases, by demographic group, with and without producer price reactions. Household annual fat purchases are calculated by multiplying the predicted choice probabilities by …rst the fat content of each product and then the 2007 purchase frequency. Pre-policy, 844g of fat were purchased on average per year by households participating in this market. Ignoring producer price responses, the policies produce large falls in fat purchases: of 300 325g (around 38%) After accounting for the producer price response, this …gure is 76:5g ( 9:1%) for the fat tax and 12:5g ( 1:5%) for labelling. If we aggregate these results over all households and extrapolate them to the entire French population, 2; 361 tons of fat are initially purchased by households via fromage blanc and dessert yogurt. Fat tax and mandatory labelling lead to falls of 5:55% and 0:9% (not shown in the table).
3 0 In all of the simulations we assume that the set of products is …xed and that pricing is the only strategy available to …rms: product entry is excluded.
The fat tax a¤ects all demographic groups similarly (between 8% and 10%), except house-holds where the main shopper is a man ( 6:4%). The e¤ects of mandatory labelling show more variation, with a tiny increase in fat purchases in households whose main shopper is obese (+0:2%), and a large fall for households in the …rst income quartile ( 4:4%).
[Table 5 about here]
Table 6 shows the change in household consumer surplus by demographic group, when producer price responses are taken into account.31 A fat tax reduces surplus by 2:1% on average, as
con-sumer prices rise. Conversely, mandatory labelling yields a large rise in average surplus (52:5%). Di¤erences by demographic group are only small.
[Table 6 about here]
Why does mandatory labelling have such an e¤ect on consumer surplus? We now show that this is generated by the large fall in the price of dessert yogurts, which more than o¤sets any disutility from labels which is mainly found for consumers of dessert yogurts.
5.2
Impact on market equilibrium, producer margins and pro…ts
The e¤ects of both policies on market shares, prices and margins are summarized in Table 7. The middle and bottom panels present changes in shares, prices and margins following mandatory labelling and a fat tax, respectively, while the top panel describes the initial situation. For each policy, the …rst line represents the change in market share, in percentage points (pp), when only household responses are taken into account; the three remaining lines show the changes in shares (pp), prices (e) and margins (pp) after producer price responses.
[Table 7 about here]
A …rst striking result is that the simulated market equilibrium changes sharply when we allow for producer price responses. When we ignore them, shown above by the changes in fat purchases, both policies hit the target, although in di¤erent ways. Overall, mandatory labelling appears more e¢ cient than the fat tax in reducing the demand for full-fat products ( 8:6 pp vs. 4:9 pp). The fall in the market share of full-fat dessert yogurts, from 17:6% to 5:0% ( 12:6 pp), following the introduction of a label is far from o¤set by the rise in the market share of (cheaper) full-fat fromages blancs (+4 pp). All fromage blanc categories (as well as the outside option) bene…t from this fall. The explanation is that, apart from their taste for fat, most dessert yogurt consumers are fat lovers who do not want to be informed about the fat they eat. Their WTP for fat-content labels is indeed low, and often negative: for instance, the median WTP amongst households who
3 1 The formulae for these welfare calculations appear in Appendix A.3. These are of course short-term welfare e¤ects, since the welfare impact of health changes are not included.
purchased a full-fat dessert yogurt at least once is e4:74. By way of comparison, the …gure for households who purchased a full-fat fromage blanc at least once is e0:42 (see Table A.3 in Appendix A.2). Dessert yogurt consumers may move not only to full-fat fromages blancs because they are cheaper, but also to lighter categories of fromages blancs to attenuate the psychic costs of eating fatty products; they may stop consuming as well.
Allowing for supply-side price responses completely changes this picture. Labelling then leads to a small rise in the market share of dessert yogurts (+1:1 pp for full-fat dessert yogurts), at the expense of skimmed and semi-skimmed fromages blancs ( 1:9 pp and 8:1 pp, respectively). This can be explained by the large fall in the price of dessert yogurts: semi-skimmed and full-fat dessert yogurts exhibit price falls of about e0:95 and e1:39, respectively, hence becoming the cheapest products on this market. In spite of this fall in prices, the margins remain positive for all products.32
In the absence of a strategic price response, the fat-tax impact on market shares is smaller than that of mandatory labelling, especially for full-fat dessert yogurts. This however reverses with producer price responses. The market share is reduced by 2:3 pp for full-fat fromages blancs, and by 1:4 pp for full-fat dessert yogurts. The corresponding increase in the share of skimmed fromage blancs (+2:8 pp) and semi-skimmed dessert yogurts (+1 pp) shows that households move away from the fatter varieties. The changes in market share are smaller as producers do not fully pass the tax on to consumer prices. For instance, for full-fat dessert yogurts, the …nal increase in consumer price with 100% pass-through would be e0:31 (3:06 times the tax of 10%), whereas it is only e0:12 (i.e. (3:06 0:17) 110% minus 3:06) with a price response. This means that the pass-through rate is under 40%: producers are willing to absorb a large part of the intended policy shock on consumer prices.
Table 8 shows the changes in market share by demographic group after …rm price responses. Under mandatory labelling, the consumption of full-fat dessert yogurts increases more in households whose main shopper is obese (+4:7 pp, compared to +1:1 pp for the whole population). In addition, this group consumes less skimmed and semi-skimmed fromage blanc, with the market shares falling by 3:0 pp and 10:1 pp, respectively. Labelling thus fails to achieve the objective of changing the choices of those who would really need to switch from full- to lower-fat products. Again, the fat tax seems to be a better policy, as it induces substitution from full-fat to skimmed and semi-skimmed products for households with obese main shoppers.
[Table 8 about here]
The changes in pro…ts and market share are not shown here in detail for con…dentiality reas-ons. Annual pro…ts are calculated using predicted market share and observed household purchase
3 2 To obtain the new price equilibrium, two full-fat and one semi-skimmed dessert yogurts have to be dropped from the universal set of products (the algorithm does not converge otherwise). The households who chose these products are then considered as having selected the "no purchase" option. This covers only 35 out of 8975 possible decisions.