HAL Id: hal-00932166
https://hal.archives-ouvertes.fr/hal-00932166
Submitted on 16 Jan 2014
HAL is a multi-disciplinary open access
archive for the deposit and dissemination of
sci-entific research documents, whether they are
pub-lished or not. The documents may come from
teaching and research institutions in France or
abroad, or from public or private research centers.
L’archive ouverte pluridisciplinaire HAL, est
destinée au dépôt et à la diffusion de documents
scientifiques de niveau recherche, publiés ou non,
émanant des établissements d’enseignement et de
recherche français ou étrangers, des laboratoires
publics ou privés.
Reconstruction-free sensitive wavefront sensor based on
continuous position sensitive detectors
Thomas Godin, Michael Fromager, Emmanuel Cagniot, Marc Brunel, Kamel
Aït-Ameur
To cite this version:
Thomas Godin, Michael Fromager, Emmanuel Cagniot, Marc Brunel, Kamel Aït-Ameur.
Reconstruction-free sensitive wavefront sensor based on continuous position sensitive detectors.
Ap-plied optics, Optical Society of America, 2013, 52, pp.8310 - 8317. �10.1364/AO.52.008310�.
�hal-00932166�
Reconstruction-free sensitive wavefront sensor based on
continuous position sensitive detectors
Thomas Godin,1,* Michael Fromager,, Emmanuel Cagniot,2 Marc Brunel,3 and Kamel Aït-Ameur2 1 Institut FEMTO-ST, UMR 6174 CNRS-Université de Franche-Comté, 25030 Besançon, France
2 Centre de Recherche sur les Ions, les Matériaux et la Photonique, UMR 6252, CEA-CNRS-Université de Caen-Ensicaen,
14050 Caen, France
3 Département d’Optique et Laser, CORIA, UMR 6614 CNRS, 76801 Saint-Etienne du Rouvray Cedex, France.
*Corresponding author: [email protected]
We propose a new device able to perform highly sensitive wavefront measurement based on the use of continuous position sensitive detectors and without resorting to any reconstruction process. We demonstrate experimentally its ability to measure small wavefront distortions through the characterization of pump-induced refractive index changes in a laser material. In addition, it is shown using computer-generated holograms that this device can detect phase discontinuities as well as improve the quality of sharp phase variations measurements. Results are compared to reference Shack-Hartmann measurements and dramatic enhancements are obtained. © 2013 Optical Society of America.
Received Month X, XXXX; revised Month X, XXXX; accepted Month X, XXXX; posted Month X, XXXX (Doc. ID XXXXX); published Month X, XXXX
1. Introduction
Wavefront measurements are nowadays routinely performed within the framework of adaptive optics for astronomy or corneal refractive surgery applications [1,2]. In the first case, the aim is to remove distortions induced by atmospheric turbulences whereas in ophthalmology, wavefront measurements allow the characterization of eye defects and aberrations. Such techniques can also increase the performances of laser material processing [3], and can be use for microscopy [4], nonlinear properties characterization of laser media [5], complete measurement of fiber modal content [6] or for fusion applications [7]. Several methods have thus been efficiently developed to record wavefronts: interferometric techniques [8], modal decomposition of the laser beam [9], ray tracing [10], pyramid sensor [11], wavelet transform profilometry [12] or numerical holograms [13]. The most widespread technique is undoubtedly the Shack-Hartmann sensor (SHS) [14]. Its principle is relatively simple and well known [15]: the incident wavefront is decomposed through a matrix of microlenses; typically from 32x32 to 128x128 microlenses with a focal length of about one centimeter. Each lens gives rise to an airy spot which position relative to the optical axis of the microlens is straightly related to the local slope of the incident wavefront. The position of each airy spot is monitored on a CCD sensor set in the focal plane of the microlenses matrix. The complete wavefront is then reconstructed from all the local slopes using a reconstruction algorithm based for instance on Zernike polynomial decomposition [16]. The sensitivity of the SHS is naturally related to the smallest measurable displacement of the Airy spot. Typically, commercial SHS have a sensitivity expressed in fraction of wavelength of about /150. It implies that SHS are hardly used to characterize nonlinear or thermal effects in laser crystals [17] unless a very powerful source is used. For comparison, Z-scan techniques used in these cases have a sensitivity of /300 [18]. Our previous works have demonstrated that this sensitivity
could be at least multiplied by a factor 4 using a continuous Positive Sensitive Detector (PSD) [19], which is a device able to monitor the position of the beam centroid with a nanometer-scale precision without any discretization of the incident beam [20,21]. In this paper, we extend this principle to the wider concept of wavefront sensing by advantageously using PSD instead of CCD in order to reach high accuracy and sensitivity. The first section details the design of our prototype in the frame of this feasibility study [22], aiming to observe wavefronts usually undetectable for standard SHS with the advantage of being low-cost and easy to implement. In the second section, we demonstrate that our device is able to perform an ultra-sensitive characterization of nonlinear and thermal lensing effects in a laser crystal under low pumping and to retrieve information that could not be obtained with a standard SHS. A series of essential advantages compared to SHS is finally presented in Section 3 where we show by simulating various phase profiles with a spatial light modulator (SLM) that our technique has the ability to fully characterize sharp phase variations and discontinuities thanks to a continuous recording of the exact wavefronts without using any reconstruction techniques. It is the first time to our knowledge that such an improvement is reported. This technique is thus proved to go beyond the classical limits of SHS and allows to consider original prospects in the field of wavefront measurements.
2. Design of the device
Let’s first recall a few details about continuous PSDs since they are widely used in particle physics whereas their use is rather unusual in optics [21,23]. The PSD used in this study is a non-pixelated lateral effect photodiode giving a continuous linear electric signal proportional to the beam centroid position. Standard commercial PSDs can reach an accuracy of a few tens of nanometers. They consist in a p-n junction
converting the incident illumination in a current divided through four contacts (for two-dimensional measurements) located on each side of the junction. While the sum of the currents gives the total intensity of the incident beam, the difference between to opposite electrodes is proportional to the position of the beam centroid in the considered direction. Depending on the size of the detector, PSDs can be suitable for time-resolved experiments [24] and are even sensitive to femtosecond beams [25].
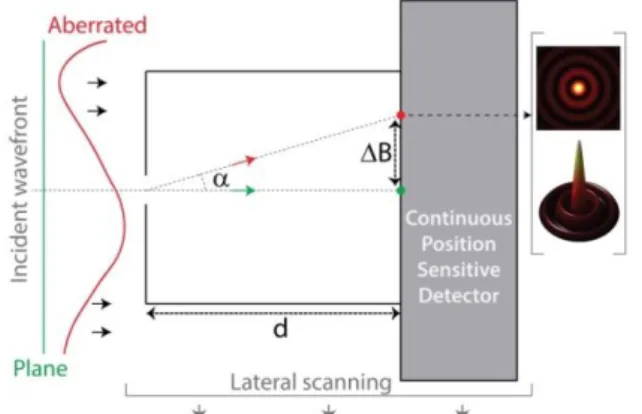
In order to highlight in a simple way the real gain brought by the use of a PSD, the matrix of microlenses used in the SHS is replaced by a single aperture of diameter placed at a distance d of a PSD. In order to simulate the matrix of lenses, both aperture and PSD are mechanically translated through the beam (Fig. 1) under investigation. In this configuration, the device rather simulates the effect of a Hartman grid but the experiment can be performed as well with a single micro-lens. The micro-aperture produces an Airy spot on the active area of the PSD which delivers the position of the spot centroid with a scale-time fixed by the detector rise time, which is principally limited by the size of the detector, just like a photodiode. This time is much lower here than in the case where an interpolation of the data recorded by the CCD is needed.
In SHS, the Airy patterns for each microlens are discretized on the CCD sensor (~6x6 pixels/spot in standard devices) and its center of mass is calculated numerically, implying an increased computational time and approximations intrinsic to the discretization process. The sensitivity can be then expressed has a fraction of the pixel size [15] and has to be compared to the nanometric resolution of the PSD. We have decided to empirically perform this comparison by monitoring nonlinear and thermal effects in a laser material which are usually undetectable by SHS. In the following, a reference SHS (Imagine Optics HASO 32) is placed on a parallel channel in order to check the improvement brought by our technique.
Fig. 1. Design of the device. is the local slope of the wavefront, B is the deviation of Airy spot centroid from the plane wavefront case.
We use standard commercial PSD (Thorlabs PSD4M; New Focus Model 2931) and the distance d
between the aperture and the sensor is arbitrarily set to 5 cm. The sensitivity of the technique is strongly related to this parameter since the local slope of the wavefront is given by . Hence, for a given value of , larger values of d lead to larger centroid displacement B. Nevertheless a tradeoff between
these parameters has to be found due to a limit related to the truncation of the Airy spot by the physical borders of the PSD when the centroid displacement is too large.
The parameter d also adjusts the dynamic of the detector since when the iris is set closer to the active area, greater values of can be measured. In comparison, the dynamic of the SHS is limited when two airy spots interact on the same group of pixels of the CCD sensor [26] and can be a limiting factor within the field of atmospheric correction or ophthalmology.
The size of the aperture has to be adjusted depending on other experimental parameters: a too small aperture limits the amount of light incident on the detector leading to a poor SNR but allows to reveal small-scale features in the wavefront (improved resolution of the final picture). Moreover, a small aperture leads to a larger Airy spot and thus limits the dynamic range of the device. The resolution is also fixed by the pitch of the translation stage moving both the aperture and the PSD and an appropriate adjustment between pitch and aperture size allows to obtain continuous wavefront measurement without any approximation as the PSD delivers a continuous signal that exactly corresponds to the derivative of the wavefront. The latter is then deduced by a simple integration that can be performed electronically. In the case of SHS, this task remains a key point under study [27]: the wavefront is reconstructed considering all the discrete local slopes and using sophisticated algorithms based on polynomial projections. Once again this procedure is time-consuming and implies several approximations. This particular point will be addressed in Section 4.
The above-mentioned arguments tend to show that many advantages are expected from our technique in terms of sensitivity, accuracy, picture resolution, dynamic or response time. Nevertheless, the prototype presented in this feasibility study is slowed down due to the mechanical translation and is limited to one dimensional measurement. This is the reason why in the following we will limit our investigations to wavefronts with cylindrical symmetry. Note that this drawback can be bypassed using one or several high-speed rotating mirrors to ensure the beam scanning.
3. Optical nonlinearities measurements
In this section we demonstrate the high sensitivity of our technique by measuring wavefront aberrations induced by a CW optical pumping in a laser crystal. In this case, the phase shifts are due to two resonant refractive index change (RIC) mechanisms: on the one hand the thermal effects that are present in any optical pumping process [28], on the other hand the electronic RIC (pseudo-nonlinear effect) due to a variation of the electronic polarizability [24,29]. When the pump beam has a Gaussian radial intensity profile the later effect gives rise, in the parabolic approximation, to a quadratic phase shift located in the pumped area of the crystal and thus to a lensing effect, known as the population lensing effect. A contrario, the temperature distribution in the region under pumping is parabolic but follows a logarithmic decay until the edges of the crystal [30]. Hence, the
central pumped region of the crystal exhibits a pure lensing effect corresponding to both effects (population and thermal) whereas the outer region induces more complex aberrations. Most of the experimental techniques assume a pure lensing effect but this approximation could be at the root of the discrepancy in the measurements for the same material [31].
Fig. 2 shows the experimental setup used to characterize the influence of these effects on the wavefront of a reference probe beam incident on the crystal. The pump laser source is a single-mode laser diode (LUMICS LU0980M450) emitting at a wavelength of 980nm with a maximum power of
450mW and a beam quality factor M2 of 1.06. The
probe beam source is a standard Helium-Neon laser emitting at 632.8nm with a power of 12mW and M2 of
1.05. The sample undergoing the RIC is a 1mm thick Yb:KYW sample (5% at. Yb3+, Castech) and the two
beams are overlaid within it using a dichroic mirror. The pump beam is then filtered out using a line filter and the crystal is imaged on the pinhole using appropriate lenses so that the beam size is constant in the plane of the pinhole. The PSD and pinhole are translated in the beam using a high-resolution translation stage (Micos VT-80) and the crystal is set precisely in the focal plane of both the lenses L1 and L2
so that the probe beam wavefront is plane in the sample and the pump intensity maximum. In order to be able to observe the whole wavefront distortions (quadratic and parabolic), the focal lengths of L1 and
L2 are chosen so that the probe beam is twice the size
of the pump beam in the crystal.
Fig. 2. Experimental setup. LD : laser diode @980nm. HeNe : Helium-Neon laser @632nm. DM : dichroic mirror, HT@632nm, HR@980nm. LF : bandpass line filter @632nm. PSD : Position Sensitive Detector.
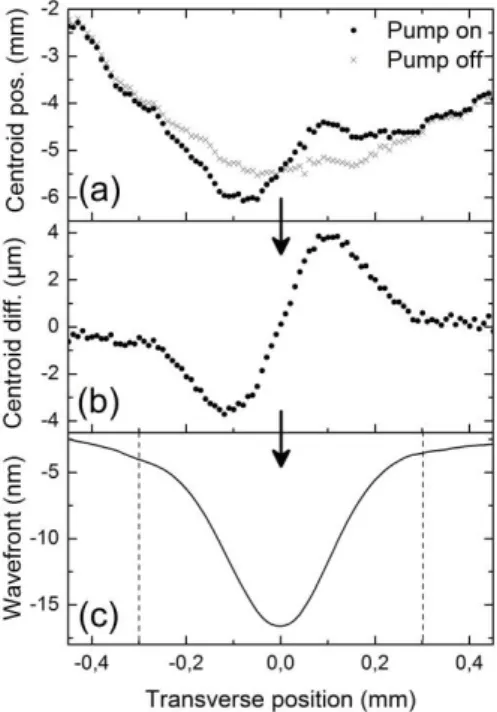
The centroid displacements are recorded using a standard commercial PSD (PSDM4, Thorlabs) and a pinhole diameter of 150µm. Fig. 3(a) shows the measured signal when translating transversally the PSD in the probe beam in the presence or not of the pump beam. A perturbation of the signal when the crystal is pumped can already be noticed here. It is then possible to get rid of parasitic effects (scattering impurities in the sample, collimation error, aberrations induced by the lenses…) and to measure the signal only due to the pump-induced effects by making the difference between the two above-mentioned curves. Fig. 3(b) displays the difference signal and exhibits interesting features. The linear central part of the graph corresponds to the region of the crystal under
pumping and thus to the pure lensing effect consisting of the contribution of both thermal and electronic effects. The outer region represents the scattering (logarithmic decay) of the thermal load in the crystal. The complete wavefront can now be reconstructed by simply integrating the signal obtained in Fig. 3(b). This wavefront, shown in Fig. 3(c), matches the expected shape and presents the characteristic parabolic central shape (between the dashed lines) surrounded by an approximately logarithmic evolution and electronic effects. The same experiment has been performed using a Shack-Hartmann (SH) wavefront sensor (Imagine Optics HASO32) instead of our technique : the SH is not able to detect any phase distortion while our system provides an accurate measurement of the wavefront, which is a direct proof of the enhancement of sensitivity brought by this new technique. The orders of magnitude of the phenomena are coherent with results previously reported using standard techniques (e.g. Z-scan, Baryscan).
Fig. 3. Experimental measurements (a) Centroid displacements with and without pumping the crystal (b) Difference between both signals (c) Integration of the difference signal leading to the reconstructed wavefront.
In addition, it is possible to study the influence of the thermal effects on the wavefront by chopping the pump beam, knowing that the two effects have different characteristic response time [32]. Hence, the pump beam has been temporally modulated using a mechanical chopper so that the illumination duration is 3ms. A PSD with a better response time (New Focus Model 2931) has been used to record the centroid displacements with and without chopping the pump beam (Fig. 4). Exploiting the data at both the beginning and the end of the illumination time, we can readily isolate the electronic contribution to the lensing effect. The direct comparison between the two lensing effects, represented in Fig. 4(b), evidences that it can be hazardous to attribute a lensing effect to pure thermal effects, neglecting the electronic contribution.
These results evidence the high sensitivity inherent to our technique since this kind of thermal lensing
effects are usually observed using a SHS along with tenths of watts of pump power and, in comparison, the crystal is pumped here with a few hundreds of milliwatts. The sensitivity inherent to our technique could now be used to give more information about the shape of the pump-induced lens and thus complete and give more accuracy to measurements technique such as Z-scan, which assume a perfect lensing effect.
Fig. 4. Variation of the heat load in the sample and influence on the measured wavefronts. (a) Centroid differences with and without chopping the beam (b) Reconstructed wavefronts.
4. Characterization of steep phase variations and discontinuities
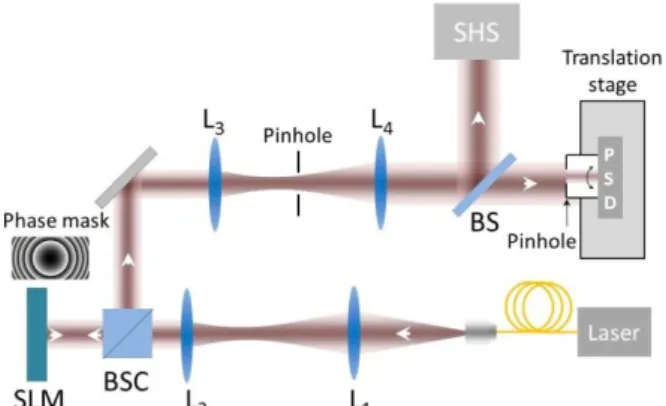
The previous section has clearly demonstrated the sensitivity improvement brought by the technique and in this last section, we address the essential point of the accuracy of the recorded wavefront. SHS use reconstruction techniques over polynomials basis such as the Zernike one with the aim to obtain a continuous reconstructed wavefront from a discrete set of local slopes deduced from the sampling of the microlenses matrix. These algorithms are time-consuming and tend to induce uncertainties about the reconstructed wavefront fidelity. Since our technique is based upon a continuous scanning of the beam and on direct integration of an electric signal, we can expect the measured wavefronts to reveal much more details. In order to investigate this improvement, the setup represented in Fig. 5 is implemented. The particular wavefronts under study are generated with a phase-only spatial light modulator (SLM, Pluto-NIR, Holoeye) which allows to display the phase holograms with a high resolution (1920x1080 pixels) and a phase varying from 0 to 2 encoded over 256 gray levels. The SLM is illuminated with a collimated beam at a wavelength of 1.064µm and a proper set of lenses is used to image its active screen on both wavefront sensors. A pinhole is added to select the diffraction order containing the phase information and an additional grating is displayed on the SLM to improve this selection. In the following, we focus on two
extreme cases of discontinuous wavefronts: (i) an axicon (i.e. conical phase shape) (ii) a phase step (i.e. two rectangular areas associated with different phase shifts).
Fig. 5. Experimental setup. Phase objects are simulated via computer-generated holograms displayed on a Spatial Light Modulator (SLM). BSC: Beamsplitting cube; BS: 50/50 Beam splitter; SHS: Shack-Hartmann wavefront sensor; PSD: Position sensitive detector.
(i) The axicon: a conical shape of phase.
Axicon is a generic name initially dedicated to any optical devices able to generate a focal line with constant on-axis intensity (instead of focal points). Conical axicons are commonly used since they are able to produce both dark-hollow beams and Bessel beams, attracting much interest within the field of cold atoms trapping and guiding [33]. It has been shown that even a small curvature in the axicon peak shape induces defects in the desired beam shapes [34]. The control of the bluntness of the peak is a difficult task for a SHS since the reconstruction algorithms only use a given limited number of polynomials to represent the wavefront. For example, the SHS used in this study computes the wavefronts using the 63 first Zernike polynomials which include only three terms with respect to the cylindrical symmetry of the conical surface. As shown in Fig. 6, it is very difficult to represent the peak only with these three polynomials and this is the reason why the reconstruction algorithm tends to exploit any beam misalignment to project the solution on other polynomials, leading to an artificial dissymmetry of the recorded wavefront.
Fig. 6. Recording of an axicon phase shape with a SHS (red line) and our device (black line) while the dotted line corresponds to the ideal axicon displayed on the SLM.
Fig. 6 also shows that of our device reproduces the symmetry and the linearity of the slope of the actual
axicon with a very good agreement and, even if the peak still exhibits an imperfect curved shape, the measurements are much more satisfactory than the results given by SHS. The reason for this bluntness is shown in Fig. 7 which represents the recording of the beam centroid position during the translation of the device. In the first part (left), the pinhole is only illuminated with the part of the wavefront having a constant slope thus leading to a constant position P1 of
the beam centroid. In the central part of the curve, the peak but also the second linear part with an opposite slope are scanned together: the successive positions Pi
of the Airy spot thus correspond approximately to a mean value of the slope of the local wavefront. Finally, the last part with constant slope represents the other side of the axicon and the position P2 of the spot
centroid is the same than P1 but with an opposite sign.
The bluntness stems from the points monitored between P1 and P2 and these points are actually
redundant since they correspond to an important overlapping of the areas scanned by the pinhole. In order to prevent this overlapping, the translation step has just to be set appropriately: if it is equal to the diaphragm diameter then all the points Pi except one
are removed and a perfect peak shape is recovered.
Fig. 7. Evolution of the beam centroid position as the axicon peak is scanned.
(ii) Phase discontinuities
SHS are well-known to be insensitive to phase discontinuities whilst their characterization represents a great challenge with numerous applications in biology [35] or in the field of very small particles detection [36]. We study here the most basic discontinuity consisting in a simple phase step: the screen of the SLM is then divided into two equal rectangular parts encoded with different phase shifts. While SHS are unable to give any reliable information about the step, our device delivers a signal (Fig. 8) in the form of a thin peak which location corresponds to the phase step position and which gives information about the step height. The integration of this peak gives a step which height indeed depends on the area beneath the curve. Nevertheless, the step is not perfect since it does not exhibit a perfect vertical slope and this defect is straightly related to the peak thickness and could be reduced using a smaller pinhole, leading also to a decrease of the incident power on the PSD and thus decreasing the signal-to-noise ratio (SNR).
But this peak does not actually correspond to a wavefront measurement and can be easily explained by the scanning of the discontinuity with the pinhole just like in the previous case of the axicon.
Fig. 8. Centroid position for a phase shift step.
A simple analytical model can be derived considering a plane wave incident on the phase discontinuity: this assumption is reasonable since only a one pinhole diameter area on each side of the discontinuity is considered.
Fig. 9. Simulated peak heights for different phase shifts. (NB: the peaks look wide only due to the chosen range of interest, since the wavefront is flat on each side of the peaks)
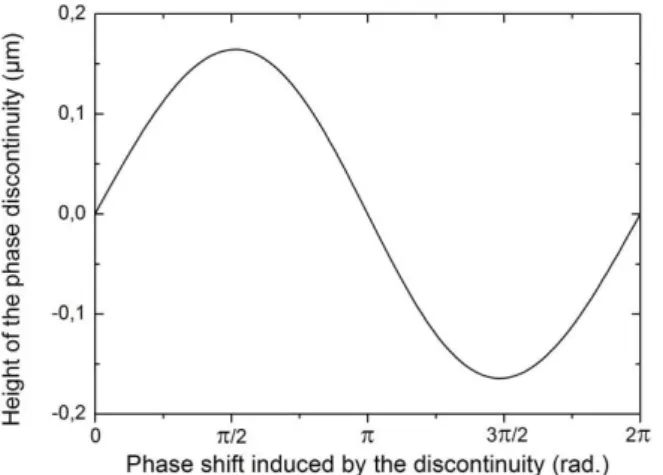
We assume the center of a wide enough collimated Gaussian beam to be regarded as a plane wave and we model the diffraction, in the plane of the PSD active area, of a plane wave through the step and the pinhole. Fig. 9 shows the diffraction peaks computed for different phase shifts. We first note that the peak sign is reversed when the phase shift is larger than . This point has been experimentally confirmed as well as the particular case of a phase shift where the curve exhibits two very low amplitude peaks (one positive and one negative) having the same shape. The integration of the curve does not give a step but rather a small oscillation at the location of the discontinuity. Fig. 10 represents the theoretical height (proportional to the peak area) of the computed steps for each phase shift and we can see that two different phase shifts can lead to the same retrieved height, leading to an indetermination about the measurement. The calculations also demonstrate that the curve is insensitive to the pinhole radius: a larger pinhole
yields a larger peak but with the same area. Hence, contrary to axicon case, the overlapping of the measurements during the translation is the reason of the ability to detect the phase shifts and without this overlapping only the flat areas on both sides of the discontinuity would be monitored. Hence, our technique can detect a phase discontinuity and provide detailed information about its structure in a very simple way and could go along with powerful retrieval algorithms [37].
Fig. 10. Simulated height of the step after integration of the peak for a 50µm diameter pinhole
5. Conclusion
Due to the ubiquitous presence of wavefront sensors in many fields of research, the original technique presented in this study can find many potential applications. Its main advantage lies in its ability to reproduce very small wavefront distortions by using continuous PSD sensitive to nanometer-scale beam displacements. In addition to exhibiting a very high sensitivity, the device presented in this paper is able to perform wavefront measurement without requiring any reconstruction technique, which makes it suitable for application needing high acquisition rates. Besides, we have demonstrated experimentally our prototype to be sensitive to phase discontinuities but also to enhance the quality of the measurements in presence of sharp phase variations (e.g. conical axicons). The simplicity and reproducibility of our measurements attest this promising technique to be robust and relatively low-cost although many refinements are to be implemented. Even if this study is only of proof of concept limited to one dimension, all the new features brought by the technique and the various advantages upon standard Shack-Hartmann sensors allow to consider many prospects, for instance in the field of adaptive optics but also in more particular previously unattainable applications such as particles detection.
Acknowledgments
The authors acknowledge the financial support of the
Fonds Européen de Développement Régional (FEDER),
and the french Agence Nationale de la Recherche
(ANR), through the program “Investissements
d’Avenir” (ANR-10-LABX-09-01), LabEx EMC3.
References
[1] R. M. Clare, M. Le Louarn, and C. Béchet, “Laser guide star wavefront sensing for ground-layer adaptive optics on extremely large telescopes,” Appl. Opt. 50,
473-483 (2011).
[2] U. Wittrock, “Adaptative optics for industry and medicine,” Springer Proceeding in Physics (2003). [3] M. Paurisse, M. Hanna, F. Druon, and P. Georges, “Wavefront control of a multicore ytterbium-doped pulse fiber amplifier by digital holography,” Opt. Lett. 35, 1428-1430 (2010).
[4] P. N. Marsh, D. Burns, and J. M. Girkin, “Practical implementation of adaptive optics in multiphoton microscopy,” Opt. Express 11, 1123-1130 (2003). [5] D. Rativa, R. E. de Araujo, A. S. L. Gomes, and B. Vohnsen, “Hartmann-Shack wavefront sensing for nonlinear materials characterization,” Opt. Express 17, 22047-22053 (2009).
[6] M. Paurisse, L. Lévèque, M. Hanna, F. Druon, and P. Georges, “Complete measurement of fiber modal content by wavefront analysis,” Opt. Express 20, 4074-4084 (2012).
[7] D. Wanjun, H. Dongxia, Z. Wei, Z. Junpu, J. Feng, Y. Zeping, Z. Kun, J. Xuejun, D. Wu, Z. Runchang, P. Zhitao, and F. Bin, “Beam wavefront control of a thermal inertia laser for inertial confinement fusion application,” Appl. Opt. 48, 3691-3694 (2009).
[8] S. Velghe, J. Primot, N. Guérineau, M. Cohen, and B. Wattellier, “Wave-front reconstruction from multidirectional phasederivatives generated by multilateral shearing interferometers,” Opt. Lett. 30, 245-247 (2005).
[9] C. Schulze, D. Naidoo, D. Flamm, O. A.Schmidt, A. Forbes, and M. Duparré, “Wavefront reconstruction by modal decomposition,” Opt. Express 20, 19714-19725 (2012).
[10] S. Marcos, L. Diaz-Santanna, L. Llorente, and C. Dainty, “Ocular aberrations with ray tracing and Shack–Hartmann wave-front sensors: Does polarization play a role?,” J. Opt. Soc. Am. A 19, 1063-1072 (2002).
[11] S. Wang, C. Rao, H. Xian, J. Zhang, J. Wang, and Z. Liu, “Laboratory demonstrations on a pyramid wavefront sensor without modulation for closed-loop adaptive optics system,” Opt. Express 19, 8135-8150 (2011).
[12] K. Rahbar, K. Faez, and E. Attaran-Kakhki, “Estimation of phase wave-front aberration distribution function using wavelet transform profilometry,” Appl. Opt. 51, 3380-3386 (2012).
[13] S. K. Mishra, R. Bhatt, D. Mohan, A. K. Gupta, and A. Sharma, “Differential modal Zernike wavefront sensor employing a computer-generated hologram: a proposal,” Appl. Opt. 48, 6458-6465 (2009).
[14] B. Platt and R. Shack, “History and principles of Shack-Hartmann wavefront sensing”, J. Refract. Surg. 17, S573-S577 (2001).
[15] D. R. Neal, J. Copland, and D. Neal, “Shack-Hartmann wavefront sensor precision and accuracy,” Proc. SPIE 4779, 148-160 (2002).
[16] R. G. Lane and M. Tallon, “Wave-front reconstruction using a Shack-Hartmann sensor”, Appl. Opt. 31, 6902-6908 (1992).
[17] S. Chénais, F. Druon, F. Balembois, G. Lucas-Leclin, Y. Fichot, P. Georges, R. Gaume, B. Viana, G. P. Aka, and D. Vivien, “Thermal lensing measurements in diode-pumped Yb-doped GdCOB,
YCOB, YSO, YAG and KGW,” Opt. Mater. 22, 129-137 (2003).
[18] M. Sheik-Bahae, A. A. Said, T. H. Wei, D. J. Hagan, and E.W. Van Stryland, “Sensitive measurement of optical nonlinearities using a single beam,” IEEE J. Quantum Electron. 26 760-769 (1990). [19] T. Godin, M. Fromager, E. Cagniot, R. Moncorgé, and K. Aït-Ameur, “Baryscan: a sensitive and user-friendly alternative to Z scan for weak nonlinearities measurements,” Opt. Lett. 36, 1401-1403 (2011). [20] S.-H. Baik, S.-K. Park, C.-J. Kim, and B. Cha, “A center detection algorithm for Shack–Hartmann wavefront sensor,” Opt. Las. Tech. 39, 262-267 (2007). [21] C. S. Vikram and H. J. Caulfield, “Interference fringe analysis based on centroid detection,” Appl. Opt. 46, 5137-5141 (2007).
[22] T. Godin, M. Fromager, E. Cagniot, and K. Aït-Ameur, Patent pending n° FR13 53065.
[23] H. Gilles, B. Chéron, and J. Hamel, “Dispersive effects in optically pumped (23S1)4He atomic vapor
measured using a geometrical optics technique,” Opt. Commun. 190, 179-184 (2001).
[24] T. Godin, M. Fromager, E. Cagniot, F. Porée, T. Catunda, R. Moncorgé, and K. Aït-Ameur, “Transverse pseudo-nonlinear effects measured in solid-state laser materials using a sensitive time-resolved technique,” Appl. Phys. B 107, 733-740 (2012).
[25] T. Kanai, A. Suda, S. Bohman, M. Kaku, S. Yamaguchi, and K. Midorikawa , “Pointing stabilization of a high-repetition-rate high-power femtosecond laser for intense few-cycle pulse generation,” Appl. Phys. Lett. 92, 061106 (2008) [26] G. Yoon, S. Pantanelli, and L. J. Nagy, “Large-dynamic-range Shack-Hartmann wavefront sensor for highly aberrated eyes,” J. Biomed. Opt. 11, 30502 (2006).
[27] H. Shengyang, N. Yu, X. Fengjie, and J. Zongfu, “Modal wavefront reconstruction with Zernike polynomials and eigenfunctions of Laplacian,” Opt. Commun. 288, 7-12 (2013).
[28] W. Koechner, Solid-State Laser Engineering, 6th
Edition, Springer (2006).
[29] O. L. Antipov, O. N. Eremeykin, A. P. Savikin, V. A. Vorob’ev, D. V. Bredikhin, and M. S. Kuznetsov, “Electronic cange of refractive index in intensively pumped Nd:YAG laser crystals,” IEEE J. Quantum Electron. 39, 910-918 (2003).
[30] S. Chénais, F. Druon, S. Forget, F. Balembois, and P. Georges, “On thermal effects in solid-state lasers: the case of ytterbium-doped materials,” Prog. Quantum Electron. 30, 89-153 (2006).
[31] G. Boudebs and K. Fedus , “Absolute measurement of the nonlinear refractive indices of reference materials,” J. Appl. Phys. 105, 103106 (2009).
[32] T. Godin, M. Fromager, E. Cagniot, F. Porée, T. Catunda, R. Moncorgé, and K. Aït-Ameur, “Transverse pseudo-nonlinear effects measured in solid-state lasers materials using a sensitive time-resolved technique,” Appl. Phys. B 107, 733-740 (2012).
[33] D. P. Rhodes, G. P. T .Lancaster, J. Livesey, D. McGloin, J. Artl and K. Dholakia, “Guiding a cold atomic beam along a co-propagating and oblique light guide,” Opt. Commun. 214, 247-254 (2002).
[34] B. Dépret, P. Verkerk, D. Hennequin, “Characterization and modelling of the hollow beam
produced by a real conical lens,” Opt. Commun. 211, 31-38 (2002).
[35] G. Popescu, Y. Park, W. Choi, R. Dasari, M. Feld, and K. Badizadegan, “Imaging red blood cell dynamics by quantitative phase microscopy,” Blood Cell. Mol. Dis. 41, 10-16 (2008).
[36] F. V. Ignatovich and L. Novotny, “Real-time and background-free detection of nanoscale particles,” Phys. Rev. Lett. 96, 013901 (2006).
[37] M. Brunel, H. Shen, S. Coetmellec, D. Lebrun, K. Aït-Ameur, “Femtosecond digital in-line holography with the fractional Fourier transform: application to phase-contrast metrology,” Appl. Phys. B 106, 583-591 (2012).