Publisher’s version / Version de l'éditeur:
Proceedings of the Third International Symposium on Marine Propulsors smp’13,
2013
READ THESE TERMS AND CONDITIONS CAREFULLY BEFORE USING THIS WEBSITE.
https://nrc-publications.canada.ca/eng/copyright
Vous avez des questions? Nous pouvons vous aider. Pour communiquer directement avec un auteur, consultez la première page de la revue dans laquelle son article a été publié afin de trouver ses coordonnées. Si vous n’arrivez pas à les repérer, communiquez avec nous à PublicationsArchive-ArchivesPublications@nrc-cnrc.gc.ca.
Questions? Contact the NRC Publications Archive team at
PublicationsArchive-ArchivesPublications@nrc-cnrc.gc.ca. If you wish to email the authors directly, please see the first page of the publication for their contact information.
NRC Publications Archive
Archives des publications du CNRC
This publication could be one of several versions: author’s original, accepted manuscript or the publisher’s version. / La version de cette publication peut être l’une des suivantes : la version prépublication de l’auteur, la version acceptée du manuscrit ou la version de l’éditeur.
Access and use of this website and the material on it are subject to the Terms and Conditions set forth at
Parametric analysis of horizontal axis tidal turbine hydrodynamics for
optimum energy generation
Liu, Pengfei; Bose, Neil
https://publications-cnrc.canada.ca/fra/droits
L’accès à ce site Web et l’utilisation de son contenu sont assujettis aux conditions présentées dans le site LISEZ CES CONDITIONS ATTENTIVEMENT AVANT D’UTILISER CE SITE WEB.
NRC Publications Record / Notice d'Archives des publications de CNRC:
https://nrc-publications.canada.ca/eng/view/object/?id=7dce8b9d-8287-49c3-bd6d-11bc2f4fcee6
https://publications-cnrc.canada.ca/fra/voir/objet/?id=7dce8b9d-8287-49c3-bd6d-11bc2f4fcee6
Proceedings of
The Third International Symposium on
Marine Propulsors
smp’13
Launceston, Australia
5
– 8 May, 2013
www.marinepropulsors.com
Edited by:
Third International Symposium on Marine Propulsors smp’13, Launceston, Tasmania, Australia, May 2013
Parametric Analysis of Horizontal Axis Tidal Turbine Hydrodynamics for
Optimum Energy Generation
Pengfei Liu
1, Neil Bose
21Institute for Ocean Technology, National Research Council Canada, 1 Kerwin Place and Arctic Avenue, Box 12093, St. John’s, Newfoundland and Labrador, A1B 3T5 Canada
2AMC - National Centre for Maritime Engineering and Hydrodynamics, University of Tasmania, Locked Bag 1395, Launceston, Tasmania 7250, Australia
ABSTRACT
A parametric analysis was conducted for a series of horizontal axis tidal turbines (HATT), prototyped for the inflow velocity profile and annual inflow probability distribution of the Bay of Fundy, Minas Passage, Nova Scotia, Canada. Motion and geometry parameters of the HATT series were covered in the optimization process. Data for the parametric analysis were obtained using a proprietary software tool that was validated for both horizontal axis wind turbines (HAWT) and HATT. It was found that the total annual energy production was most sensitive to variations in pitch value and distribution especially at the blade tips. It was found also that a relatively large rotor solidity is required for optimum energy generation at very small inflow speeds.
Keywords
Bay of Fundy; HATT; tidal turbine; tidal power; ocean renewable energy.
Nomenclature
A --- Area of the turbine rotor disk
AoA --- Angle of attack
α --- Angle of attack (AoA) of blade section
α’ --- AoA of blade section with added induced velocity αp --- Geometric AoA of blade section
αo --- Angle of zero lift of blade section
αv --- Angle of inflow velocity (hydrodynamic AoA)
αv’ --- Angle of inflow velocity with added induced
velocity
αe --- Effective AoA of blade section
Ct --- Thrust coefficient of turbine shaft
2 2 2 2 1 4 2 2 2 1 8 J K R V D n K A V T C t a t a thrust t ρ π π ρ ρ = = =
Cpow --- Turbine power coefficient
3 3 3 3 2 3 2 1 5 2 3 2 1 16 16 2 J K V D n K R V nR D n K A V R Q P P C q a q a q a torque input output pow= = = = = π ρ π ρ ρ ω CP --- Pressure coefficient
D --- Diameter of turbine rotor
EAR --- Rotor solidity, the same as expanded blade area ratio of a traditional propeller.
fp --- Tip pitch factor for linear pitch distribution (pitch
value at tip base P R r D p f D p = = 01. )
fw --- Chord length factor used for solidity variation
hD --- Hub diameter to blade diameter ratio
HATT --- Horizontal axis tidal turbine
J --- Shaft advance coefficient by traditional propeller definition
nD V
J= a
Kt --- Shaft thrust coefficient by traditional propeller
definition 4 2D n T K thrust t=ρ
Kq --- Shaft torque coefficient by traditional propeller
definition 5 2D n Q K torque q=ρ
Ksp --- Blade spindle torque
Kip --- Blade in-plane bending moment
Kop--- Blade out-of-plane bending moment
n --- Shaft rotational speed (rps)
p --- Absolute pitch value at local radius r
pD --- Normalized pitch (p/D) at local radius r
r --- Blade section local radius
R --- Blade radius
TSR --- Blade tip speed ratio
J V nD V nR V R TSR a a a π π π ω = = = = 2
va --- Inflow velocity of turbine
va’ --- Inflow velocity with added induced velocity
vt --- Induced tangential velocity at blade section
vr --- Induced radial velocity at blade section
1. Introduction
Horizontal axis tidal turbines are designed to be either unidirectional or bi-directional. There are a few descriptions of bi-directional tidal turbines in the open literature, including the TOCADO turbine [1], ROTOJET turbine [2] and SwanTurbines [3]. The TOCADO turbines are designed to have controllable pitch blades to adapt to the inflow direction; their blades’ sectional profile is unidirectional. Both the ROTOJET and SwanTurbines rotors have bi-directional blade sectional profile. These are all open rotor blade turbines; that is rotors with no nozzle or duct. Turbines with bare rotors are the most cost effective for design and fabrication, installation and maintenance but they often require a higher threshold inflow speed (Va>1.30 m/s for a 20-m turbine) to produce power. As power production is proportional to the cube of the inflow speed at the rotor disk, to “accelerate” the inflow speed for maximum possible power production and to reduce the threshold inflow speed requirement, some turbines are equipped with a nozzle/duct to accelerate the
inflow, for example the RTT by Lunar Energy [4], SeaGen by Marine Current Turbines (MCT) [5], some early investigations and testing performed by Kirke [6] and Clean Current’s tidal turbine [7]. Adding a nozzle/duct increases the design, material and construction costs. Installation and maintenance costs are also increased. Regardless whether bare bladed or ducted, decisions need to be made in the design by taking into account the hydrodynamic performance versus inflow speed probability distributions, design and fabrication costs, energy production revenue and associated social benefit, cost recovery and investment return period. Engineering economics is essential also to help in decision making but this is beyond the scope of the current study.
The rotor blades of turbines, either with or without a duct or nozzle, need to be designed and optimized to achieve the highest possible energy production. In traditional marine propeller design, as it has evolved for more than 300 years, a standard procedure, for example, using Bp-δ diagrams, or other design charts or computer design techniques was developed and has been widely used since the middle of the last century [8]. These propeller design diagrams were created based on propulsive characteristics in terms of thrust and torque coefficients (and hence efficiency) from a wide spectrum of model test data for a propeller series. For example, Bp-δ diagrams and similar optimization processes of the B-series propellers (these propellers were initially designed by Troost [8] and were later extended and renamed as the Wageningen propeller series [9]). These B-series propeller data cover the geometry of over 1,000 propeller models, including both open propellers and propeller-nozzle combinations. Not to mention the facility and labour expenses for tank and cavitation tunnel testing, the cost of the materials and CNC machining of a high precision propeller model alone is about $2-5k each nowadays, depending on the size and material of the model propellers, though 3D printing using nylon or Renshape, etc., could be much cheaper although with a compromise of strength, precision and blade stiffness. Later in the 1970s, most of the thrust and torque coefficients for the B-series propellers were made available in terms of polynomials created by a linear regression process. These polynomials represent all the test data and are the basis for design and optimization of
B-series propellers. Similarly to propeller design and optimization, sufficient performance data is necessary to start a conceptual and preliminary design and optimization for tidal turbines. However, a series of commonly acceptable turbine rotors similar to the B-series propellers does not exist. To develop a complete and comprehensive turbine performance database that covers all the geometry and motion parameters, a large number of turbine models and a huge amount of facility testing time and effort are required. The costs of material and machining of hundreds or even thousands of turbine models and their model testing are prohibitively expensive today. While model tests of turbine series are essential for benchmark and validation of numerical and experiment methods and require a long time to obtain, with the development of
numerical methods and turbine computational tools, direct full scale prediction for turbine design and optimization may be the most economic and time saving alternative. This can be achieved by using a reliable and highly computational efficient numerical tool along with a well established design and optimization procedure. This approach is developed in the sections below.
The main differences and similarities in the parameters of influence in relation to the performance between a screw propeller and a horizontal axis turbine were examined and studied systematically in a recent article in Energy [10]. With these given differences and similarities, a guideline and procedure was developed to make it possible for a generic propeller performance code to be adopted for turbine performance evaluation with only minor revision. Unlike propellers that are designed to work only at one or a few ship speeds, tidal turbines work at many different inflow speeds. Flow probability distribution in terms of speeds and length of time per year is required as turbine power production is different at different inflow speeds. For propellers, the design speed is the only speed in most cases to consider, i.e. the probability that the propeller operates at the design speed is close to 1 (i.e. 100%). Therefore, in the design and optimization of propellers, optimum efficiency is sought and it is expressed as the ratio of thrust power to input power. For turbine design, the inflow speed is not constant because each individual speed corresponds to its own probability values in terms of hours per year. Maximum power production of a turbine can only occur at the highest inflow speed, before severe stall and separation are developed. Moreover if the length of time for the maximum power production is near zero, the energy production will be close to zero too, which is meaningless. Therefore, the maximum annual energy production was used as a benchmark in the current study for turbine rotor design and optimization.
To perform a systematic turbine rotor design and optimization, a wide range of motion and geometry parameters need to be covered. The optimization process performed in this work covers the following variables: Uniform pitch-diameter-ratio (p/D) distributions, that
is, p/D = constant from blade root to tip. With changing pitch angle to keep a constant p/D, the rotor blades are twisted.
Non-uniform p/D distributions (linear increase of p/D from r=0.60R to blade tip)
Shaft rotational speeds n under fixed rotor diameter D Diameter D at fixed tip-speed-ratio (TSR)
A combination of optimum shaft speeds n at
corresponding individual inflow speeds and optimum uniform p/D distribution at a fixed rotor diameter D Number of rotor blades Z at fixed chord length Cr
To optimize the above variables, a set of comprehensive turbine hydrodynamic performance data, in addition to the tidal inflow speed probability distribution, is required. A set of this kind of data for the bi-directional axis turbine series was obtained by developing and using a piece of
special rotor software, PROPELLA [10]. Over ten thousand selected runs were performed to create the turbine performance database. Hydrodynamic performance optimization was then conducted using the developed design and optimization procedure that is introduced in the next section.
2. Methods
In this section, two methods are discussed: the performance prediction code and the design/optimization procedure. Firstly, a turbine performance prediction software package PROPELLA is briefly introduced and followed by a discussion on validation of the code. Secondly, the formulation of the method for design and optimization procedure is developed.
2.1. Numerical Hydrodynamics
Tool
The numerical hydrodynamics code PROPELLA was developed for rotors such as propellers and propfans in early 1996 [11] and it has been continually enhanced since then (see [10] for detailed modifications and enhancements). The hydrodynamic kernel is a boundary element method, more popularly called a panel method. The panel method was implemented to multiple-body interaction flows. The fundamentals of panel methods have been presented in detail in some textbooks, including the ones by Moran [12] for 2D foil sections and Katz and Plotkin [13] for unsteady 3D bodies and wings. A detailed formulation and implementation for a low-order, time-domain panel method, were given by Liu [14, 15]. More enhancement and modifications of the code were made for this study after the previous work presented in
Energy [10]. These include a refined shed wake alignment for both wind and tidal turbines. Predictions were obtained and compared with the experimental data from a full-scale NREL wind turbine [16, 17, and 18] and cavitation tunnel test data from a tidal turbine model [19]. Fig. 1 shows a comparison between the predicted [20] and the measured power coefficient of the NREL full-scale wind turbine with the S809 blade section and a constant pitch angle of 12° [16, 17]. This is the early wind turbine produced by NREL to obtain experimental data at full-scale in the 2000’s. The measured data has been widely used for benchmarking, validation and comparison between methods.
The blade of the 10-m rotor was not twisted, i.e., the geometric angle of the rotor blades was constant throughout the blade radial locations.
It can be seen from the figure that the maximum power coefficient Cpow the wind turbine can achieve is less than
0.18, which is much less than the maximum achievable, theoretical value of 0.593 by Betz’s power limit [21].
Fig.1.Predicted and full-scale power coefficient Cp (vertical axis) of the NREL wind turbine with S809 blade
section.
The trends and the values of the power coefficient from the very low inflow speed at 5.00 m/s to a much larger speed of 15.00 m/s, between predicted and full-scale measured data, agree well, except at large inflow speed where stall and separation occurred. As the wind turbine was designed for stall-limited control, stall is expected at the upper inflow speeds. The maximum design inflow velocity was 25.00 m/s (not shown in Fig. 1), and as can be seen, stall occurred too early (i.e. at lower speeds) which results in a poor aerodynamic performance (the maximum achievable Cpow = 0.180). The poor Cpow of the
wind turbine and the discrepancy in Cpow at large inflow
speed can be due to the following reasons:
1. The wind turbine does not seem to be designed for the optimum power coefficient with respect to the inflow condition, i.e., the range of inflow speeds. In reality, a well designed wind turbine should achieve a power coefficient of 0.400 or higher, over a wide range of inflow speeds. A well designed turbine should be the result of an effective utilization of the inflow speed probability distribution as well.
2. Severe stall and separation occurred for inflow speeds larger than 15.00 m/s. A well designed turbine in practice should reduce the possibility of severe stall and separation to the minimum and at the same time utilize as much of the high inflow speed range as possible (power production is proportional to the cube of the inflow speed). Regardless, given the existing design and flow speeds, the published full-scale data provides very useful information on the threshold effective Angle of attack of the blades before severe stall and separation occur, which is a very valuable reference for turbine design, when optimum pitch and pitch distribution are to be determined.
Stall and separation occurs when the blade sectional effective angle of attack reaches a relatively high value. Stall and separation are also a function of Reynolds number (Re). For the same angle of attack the lower the
Re, the more severe and earlier the stall and separation. For a large rotor of over 10-m diameter, the Re is usually large (Re > 106) at the outer radial sections which contribute the most to power generation. In this case, the main cause of stall and separation would be the effective angle of attack. The effective angle of attack of a turbine blade section, as discussed in [10] and as shown in Fig. 2, when induced tangential and radial velocities and angle of zero lift are neglected, is
p v e
α
α
α
α
≈
=
−
(1) where ) 2 ( tan1 rn Va V π α = − (2)is the angle of inflow speed (or hydrodynamic angle of attack) and
p
α is geometric angle of the blade section (12° constant for the wind turbine under discussion).
Fig. 2 Turbine blade sectional velocity and angle of attack diagram
Table 1 lists the approximate effective angle of attack of each blade radial section of the NREL wind turbine. Examining the values of effective angle of attack along the blade spanwise directions, in relation to the power coefficient Cpow, it shows that Cpow starts to drop when the
effective angle of attack is becoming very large and is increasing (when inflow speed is increasing). Therefore, the threshold value of the maximum allowable effective angle of attack for a possible severe stall and separation can then be postulated. That is, in turbine pitch and pitch distribution design, by controlling the effective angle of attack to a value below the threshold angle of attack of stall, severe stall and separation can be avoided.
At Va = 5.00 m/s, the angle of attack is negative at the
blade sections at r>0.70R and much more negative at the tip so that substantial cancellation to the torque and hence the power generated by the inner blade sections results in a small or even negative power generation.
At Va = 15.30 m/s and at a radial location of r<0.45R, the
effective angles of attack are over 30 degrees. This indicates a possible severe stall and separation at the inner radial sections.
Table 1. Approximate effective angle of attack of the wind turbine blade Sections.
Vin→ r/R↓ 5.00 7.00 10.50 13.60 15.30 17.80 20.00 23.00 25.00 0.20 21.52 30.85 42.29 48.97 51.74 55.02 57.33 59.83 61.20 0.30 11.83 19.73 30.85 38.22 41.50 45.54 48.49 51.79 53.64 0.40 6.33 12.88 22.82 30.02 33.39 37.70 40.96 44.72 46.88 0.50 2.84 8.35 17.10 23.78 27.04 31.33 34.67 38.64 40.96 0.60 0.45 5.18 12.88 18.99 22.05 26.17 29.45 33.45 35.83 0.70 -1.28 2.84 9.68 15.24 18.08 21.97 25.13 29.05 31.42 0.80 -2.60 1.05 7.18 12.25 14.88 18.52 21.52 25.30 27.63 0.90 -3.63 -0.35 5.18 9.82 12.25 15.66 18.49 22.11 24.36 1.00 -4.45 -1.49 3.55 7.82 10.07 13.25 15.92 19.36 21.52
The occurrence of the stall reduces lift and torque (power production) and increases drag (negative torque). These combined reduce the rotor’s power coefficient Cpow
substantially. As panel methods are potential flow based methods, without a suitable correction for the stall and separation conditions when the effective angle of attack is substantially high, lift, and torque, hence power coefficient Cpow, are usually over predicted. Under
moderate stall and separation, when Va = 13.60 m/s, as
shown in Fig. 1, panel methods can still produce reasonably good results. At this inflow speed, the effective angle of attack at the r=0.4R blade section is 30° which is likely to produce a moderate stall. Under such inflow speeds, severe stall and separation may exist along the root sections (r=0.20R and 0.30R) that have an effective angle of attack of 48.97° and 38.22° respectively. However, as the torque contributed by blade root sections is small (small radius and hence the lever arm for torque production is small and the sectional reference inflow velocity is also small), reduction of Cpow due to stall and
separation at the root sections is small. A good turbine
design for optimum hydrodynamic efficiency should avoid severe stall and separation. This can be done by controlling the values of the effective angle of attack, or equivalently pitch values, at each blade section. When the effective angle of attack is controlled below a region of occurrence of stall, panel methods can be used effectively and reliably for rotor design and optimization.
A comparison of power coefficient between the predicted and model test in literature of a tidal turbine is shown in Fig. 3. The power coefficient Cpow value shown is for the
5° offset angle defined and designed in [19], resulting in a total root pitch angle of 20°. The model turbine rotor in [19] was a controllable pitch rotor and it has a 15° pitch angle at the root section at a zero offset angle. Experiments were conducted for an offset angle of 0°, 5° and 10°, resulting a root pitch angle of 15°, 20° and 25°. The predicted and measured power coefficient agrees well for a wide range of tip-speed-ratio TSR.
Predicted and Measured Power Coefficient of a 0.8-m Tidal Turbine Model 0 0.1 0.2 0.3 0.4 0.5 3.0 4.0 5.0 6.0 7.0 8.0 9.0 10.0 TSR Cp ow
Cpow_Exp, 20-deg root Cpow_PROPELLA, 20-deg root
Fig. 3 Comparison of predicted and measured power coefficient of a 0.80-m diameter tidal turbine model.
At a root pitch angle of 20°, the designed effective angle of attack of blade sections of the tidal turbine model contributed positive lift and torque for a wide range of tip-speed-ratio, TSR. The power coefficient Cpow is over 0.45,
much higher than the NREL wind turbine described above. Table 2 shows the effective angle of attack of the tidal turbine model, based on the pitch and TSR given in [19].
Table 2 . Effective angle of attack versus TSR of the Tidal Turbine Model
TSR→ r/R↓ 3.00 4.00 5.00 6.00 7.00 8.00 9.00 10.00 0.20 39.04 31.34 25.00 19.81 15.54 12.01 9.05 6.57 0.25 36.03 27.90 21.56 16.59 12.64 9.47 6.86 4.70 0.30 33.51 25.31 19.19 14.55 10.96 8.12 5.82 3.93 0.35 31.00 22.94 17.14 12.86 9.60 7.05 5.01 3.35 0.40 28.71 20.91 15.47 11.52 8.55 6.25 4.42 2.94 0.45 26.63 19.15 14.06 10.42 7.71 5.62 3.97 2.63 0.50 24.79 17.67 12.90 9.53 7.05 5.14 3.63 2.41 0.55 23.12 16.34 11.88 8.76 6.46 4.70 3.32 2.20 0.60 21.65 15.22 11.03 8.12 5.99 4.37 3.09 2.06 0.65 20.25 14.14 10.20 7.48 5.50 3.99 2.80 1.85 0.70 18.96 13.15 9.45 6.89 5.03 3.62 2.52 1.63 0.75 17.76 12.23 8.73 6.33 4.58 3.26 2.23 1.39 0.80 16.72 11.45 8.14 5.87 4.22 2.98 2.01 1.23 0.85 15.81 10.79 7.64 5.49 3.94 2.77 1.85 1.11 0.90 14.92 10.12 7.13 5.09 3.62 2.51 1.64 0.94 0.95 14.13 9.54 6.69 4.75 3.35 2.30 1.47 0.81 1.00 13.43 9.04 6.31 4.46 3.13 2.13 1.34 0.71
As can be seen in Fig. 3, the maximum power coefficient occurs at a TSR value in a range from 5.0 to 7.0. The corresponding effective angles of attack at root blade sections for TSR of 5.0 and 7.0 are 25.00° and 15.54° and at tip sections are 6.31° and 3.13°, respectively. Reducing the geometric pitch angle at the blade tip will increase the effective angle of attack. However, a nearly zero pitch angle at the tip will produce nearly zero torque because of the nearly zero lever arm, regardless how large a lift/drag is generated. A negative pitch at the blade tip will produce a small negative lift could produce very large negative shaft torque to cancel out the power production dramatically because the lever arm for torque calculation is the largest radius at the blade tip. Therefore, for best hydrodynamic efficiency, pitch angle should be set positive.
2.2. Design and Optimization
Procedure
A design and optimization procedure for the bi-directional HATT was developed as follows:
1. Determination of base geometric and motion parameters. Geometric parameters include rotor diameter D, number of blades Z, hub diameter to rotor diameter ratio Dh/D, rotor blade rake, skew,
blade sectional profile (offsets), planform shape in terms of chord length distribution (in the radial direction), and the key value, pitch p/D and its distribution. Motion parameters include the initially guessed tip speed ratio TSR, rotor shaft rotational speed n, and the inflow speed Va.
2. Optimizing rotor shaft speed n and constant distribution p/D for maximum energy generation efficiency. This is the most preliminary optimization. For this and all the following optimization steps, inflow speed is the primary variable because it is
given for a given tidal flow condition for a particular real site. In the current optimization step, the variables to optimize are shaft speed n, constant p/D, and the primary variable, inflow speeds. As noted earlier, optimization of turbine energy production needs knowledge of both tidal flow speed and the distribution of each speed over a designated period of time (usually over a year), that is, the tidal flow speed probability distribution data. It is also noted that constant p/D distribution will produce a twisted blade shape, i.e., it produces a rotor blade with a larger pitch angle at the root sections and the pitch angle reduces to a relatively small value at the tip section. Similarly to propellers, for blades with constant pitch distribution, every blade section moves forward about the same distance over an imaginary spiral surface. The base turbine of this bi-directional turbine prototype was designed to have a constant pitch. With the fully symmetric geometry, the turbine rotor will generate the same amount of power for the same inflow speed in both directions (ebb tide and flood).
3. Optimizing p/D value, its distribution and shaft speed n. As the optimum shaft speed for constant p/D distribution was already obtained in step 2 above, the range of shaft speeds for further optimization can be easily identified based on the results obtained in step 2. Therefore, only a few numbers of shaft speeds are needed in this optimization. There are also a few required intervals for p/D because the range of p/D value is relatively narrow (only possible for
p/D=0.05-0.40, see next section for detail). However, the number of possible curve forms of p/D distribution could be infinite. Compromises need to be made in the optimization task which may limit the amount of power coefficient that can be improved. Experience from numerous prediction runs and analysis shows that a linear increase in p/D from
δ(p/D) = 0.00 at r=0.60R to about δ(p/D) = 0.80p/D
at the tip (r=1.00R), that is, p/D at the tip being 1.80 times that of the nominal p/D at 0.6R, can effectively improve hydrodynamic efficiency for a constant p/D distribution configuration. As can also be seen in the effective angle of attack diagram in Fig. 2, increasing
p/D, i.e., the pitch angle, is equivalent to decreasing the effective angle of attack.
4. Optimizing EAR at fixed Z and at optimum constant pitch ratio p/D. This optimization step is to determine the optimum rotor solidity (expanded blade area ratio) with fixed Z, i.e., the initially designed number of blades and optimum p/D obtained in step 2. In this optimization, varying EAR was made by varying the chord length of all blade sections by a width factor fw. As a function of inflow speed, solidity
optimization can substantially improve the power conversion capability (i.e., power coefficient). The value of optimum solidity is usually large when inflow speed is low and vice versa.
5. Optimizing Z at optimum constant p/D. In this
optimization step, chord lengths of the blade sections are kept constant so that changing the number of
blades Z is equivalent to changing the solidity as well. The difference of this optimization step from step 5 above is that the effect of Z on hydrodynamic efficiency can be obtained and observed. At the same solidity, rotors with a large number of blades usually have higher power conversion capability. A very large number of blades may add complexity to the rotor blade machining and fabrication process and hence the turbine manufacturing costs. For turbines working in very shallow waters where cavitation number in operation is low, cavitation could be a problem and this needs to be considered. When necessary, the code PROPELLA has a validated model built in to predict rotor performance under cavitation condition [22]. This particular prototype turbine is designed to work in deep water with a cavitation number of around 33. During computations, cavitation simulation was enabled and examined. Calculations showed that at such a high cavitation number, cavitation rarely existed and the effect of cavitation is negligible.
6. Optimizing EAR at a pre-determined Z at the optimum constant p/D. This optimization step is to further explore the possibility of improving power conversion capability, using the fixed number of blades and constant pitch, without requiring too much turbine performance data.
7. Optimizing EAR at a pre-determined Z at the optimum linear p/D distribution. This optimization step is the last in the current work. There are obviously many other optimum geometric and motion parameters that could produce equal or slightly better efficiency. Varying p/D distribution in most cases provides some efficiency improvement over constant
p/D but the number of variations is infinite. Justification is needed for a potential amount of improved efficiency gain versus increased effort and complexity of the optimization process and added manufacturing cost.
3. Results and Discussion: Design and
Optimization for the Prototype
Series
3.1. Base Geometric and Motion
Parameter Design
A base turbine needs to be designed first before optimization can start. The base turbine design details are given in the following in chronological order.
Determination of the turbine diameter and hub to rotor diameter ratio. As mentioned in the previous section, for normal shaft speed and practical inflow speed, the larger the diameter of the rotor, normally the better the hydrodynamic efficiency. Selection of a practical turbine diameter is usually confined by water depth and navigation clearance for surface vehicles and their activities. For the Cape Blomidon Transect, Minas
Passage, Bay of Fundy, NS (East Coast), the average water depth is 53.00 meters [23]. The diameter of the current turbine was taken as 20.00 meters; this is considered safe and conservative to provide a clearance of 20.00 meters for surface vehicle navigation etc., with 10.00 meters of seabed clearance. A compromise sometimes is also needed to offset hydrodynamic efficiency against cost of manufacture, fabrication, transportation and installation of a large size turbine. Engineering economics, which is beyond the subject of the current paper, may need to be applied carefully for turbine farm/system configurations.
To provide a good meshing arrangement and seamless linkage between the hub panels and blade root panels, in order to avoid a discontinuous solution for surface pressure by differentiating the doublet perturbation potentials, the rotor hub to diameter ratio, Dh was taken as
0.10. Similarly to propellers, a slightly larger or smaller
Dh will have little effect on hydrodynamic performance,
though a smaller hub dimension leads to slightly higher efficiency. To simulate a hub diameter ratio Dh of 0.20,
the blade sectional profile below 0.2R was taken as nearly circular thus generating little lift at any angle of attack. For turbines with controllable pitch blades and turbines working under severe ice impact conditions, the required hub diameter would be much larger, the blade thickness would be larger too. The code as mentioned in [10], can predict spindle torque, in-plane and out-of-plane bending moment at an arbitrary blade section, to verify blade sectional strength. Structural optimization is omitted here as it is beyond the scope of the current study. In addition, modification of the blade thickness can effectively improve the structural integrity of the rotor and minor modification of thickness from the base design normally has little effect on hydrodynamic efficiency.
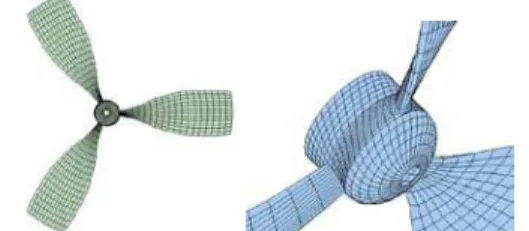
Particular geometric development of a turbine for bi-directional flow tidal power generation. This turbine prototype was designed for a fixed turbine facing angle (the turbine was on a fixed foundation) with a fixed pitch configuration. Therefore each blade section as well as the rotor was designed to have about the same hydrodynamic characteristics in both inflow directions, assuming the tidal flow is symmetrical in both directions though in reality the direction of the tide is not uniform. A bi-directional turbine can have unibi-directional blade sections if the turbine can automatically adjust its facing angle to the inflow stream or the blade pitch can be adjusted automatically when the direction of the inflow is changed to the opposite direction. For the current turbine design, the rotor was to have equal performance in both directions, so that the blade planform was required to have a zero rake and skew. For the blade sectional profile, both the upper (pressure side) and the low (suction side) surfaces and both the leading edge and trailing edge profiles were identical and fully symmetrical. The bi-directional blade sectional profile design and the expanded blade planform (patent-pending) are shown in Figs. 4 and 5, respectively.
Fig. 4 Typical blade sectional profile of the bi-directional tidal turbine (root to left).
Fig. 5 The blade planform of the bi-directional tidal turbine (root to left).
Determination of motion parameters for the base turbine. The primary motion parameter of the turbine is the inflow speed. The inflow speed probability distribution for the Cape Blomidon Transect, Minas Passage, NS (East Coast) Canada [24] shown in Fig. 6, was used to determine the base inflow speed.
0.0 200.0 400.0 600.0 800.0 1000.0 1200.0 1400.0 1600.0 0.10 0.30 0.500.70 0.90 1.101.301.501.701.902.10 2.30 2.502.70 2.90 3.10 Speed (m/s) H our s
Fig. 6 Annual average tidal current speed probability distribution for Cape Blomidon Transect, Minas Passage, NS (East Coast), re-plotted from figures presented in [24]. The inflow speed between 2.1 and 2.3 m/s has the maximum probability (Fig. 6). Therefore, this speed was chosen for the design inflow speed of the base turbine. The next most important motion parameter is the nondimensional speed, i.e., the tip speed ratio TSR. According to numerous previous turbine performance data in the literature (i.e. [19]), the maximum power coefficient normally occurs at a TSR value of between 5.50 and 8.00, and mostly it is close to 6.00. Here, the design TSR for the base turbine was taken as 6.28 (≈2π). From the definition of TSR, the design shaft rotational speed n of the base turbine was therefore determined as:
) ( 23 . 0 ) ( 20 3 . 2 2 rps m s m rev V D TSR n= in = × ≈ π π π .
Determination of the pitch p/D range of the base turbine series. Blade sectional pitch and its distribution are the key geometric parameters for performance optimization. The range of pitch diameter ratio p/D was determined according to the base geometric and motion
parameters determined above. A local pitch value p/D should be chosen to ensure the effective angle of attack at each blade section is greater than zero to produce positive torque (power) and less than the threshold value for severe stall and separation, i.e., 0<
α
e <α
stall. As mentioned earlier, when the induced velocities and angle of zero lift are negligible, it becomesα
≈α
e. The threshold stall angle in this case was determined empirically based on previous experimental results, i.e., the stall and separation discussion for the wind turbine and the effective of angle of attack listed in Table 2 were used as references. The effective angle of attack should be controlled by p/D to be less than 35° (at which value severe stall is suspected to start at Va =17.00 m/s for thewind turbine). As can be seen in the optimization process in the following sections, the amount of power production is not always proportional to the effective angle of attack, especially in the blade tip region. Large angle of attack produces drag too that will reduce the sectional torque coefficient drastically. The optimum effective angle of attack obtained at the tip was about 3-5° as a result of the optimization. Once the range of the effective angle of attack was determined, the range of the p/D could then be determined when the inflow speed was given (for example 2.30 m/s). According to the blade sectional velocity diagram shown in Fig. 2, the geometric angle of attack at the blade tip (r=R) could be obtained from:
( )
D p Rn Vg p π π α = = 2 tan (3) = = − − π π α p D D p p / tan tan 1 1 . (4) Similarly, the hydrodynamic angle of attack at the tipsection could then be determined:
( )
nD V Rn Va a vπ
π
α
= = 2 tan (5) = = − − π π α J nD Va v 1 1 tan tan (6) When the optimum value of the base TSR is taken as 2π,this yields 50 . 0 = = nD V J in
.
Therefore, to have a positive angle of attack at the tip section, the value of the effective angle of attack, has to be greater than zero:
0 > − = ≈ V p e α α α α ,
which means that / 0 > − = − π π α αv p J p D . For maximum power coefficient, the pitch ratio p/D<J=0.5 and the p/D range of the 20-m full scale base tidal turbine at a design speed of Va= 2.3 m/s with a shaft speed of n =0.23 rps
should be taken as 0<p/D<0.5.
If the p/D value at the blade root section is small, it could create a meshing problem at the intersections between the blade root surface and the hub surface. Hence a larger p/D of 0.4 at the blade root was chosen. As the radius at the root section is only 0.10R and the root section was designed as a nearly circular cross section shape (zero angle of attack for any pitch value), the contribution to
output of the blade root section to the hydrodynamic performance is negligible.
After some initial trial runs, the p/D values were primarily chosen as: 0.07, 0.08, 0.10, 0.13, and 0.14-0.40 with a step size of 0.01. More refinement runs were performed and they showed that too small (< 0.15) and too big (> 0.28) a value of p/D (too large and too small an effective angle of attack) would both produce a reduced hydrodynamic efficiency, i.e., the ratio of power coefficient to thrust coefficient, Cpow/Ct --- too big a Ct will
end up a large blade out of plane bending moment. The
p/D range was then set as 0.15-0.28, with a step size of 0.01(total of 14 values of p/D).
The geometry example of the full scale turbine, in terms of meshed surface generated by the pre- and postprocessor in PROPELLA, is shown in Fig. 7.
Fig. 7 Surface meshing presentation of the 20-m turbine geometry and details at the intersections between the
blade root and hub surfaces.
In Fig. 7, the p/D value of the turbine is 0.18. The expanded blade area ratio, i.e., rotor solidity, based on the chord width distribution shown in Fig. 5, is 0.23. The p/D value at the root sections was chosen as 0.40 at r=0.10R and is spline-fitted to have a design pitch value at
r=0.30R (e.g. p/D=0.18 for the turbine shown in the figure). By doing so, the panels at the blade root can be well defined with a good aspect ratio in terms of mesh size and shape (see the intersections between the blade root and the hub surface in the enlarged right hand plot). This eliminates possible abrupt changes of perturbation velocities when differentiating the velocity perturbation potentials among surrounding panels. In panel methods, accuracy of perturbation velocities is key when calculating unsteady surface pressure distributions.
3.2. Optimization of Rotational
Speed and Constant p/D
This optimization was performed in two directions: 1) varying pitch p/D at each shaft rotational speed and 2) varying shaft speed for each inflow speed at each fixed pitch p/D. In either case, as mentioned earlier, the maximum energy generation, instead of maximum power was optimized. For direction 1) above, for a turbine with fixed shaft rotational speed and fixed pitch value, power coefficient Cpow was obtained for all inflow speeds, for
example, from 0.10 to 3.10 m/s (see Fig. 6). The annual hydrodynamic energy production was calculated from:
dt V C D E T a p hy=
∫
0 3 2 2 1 4 π ρ (7)where T is the length of time per year in hours. In a discretized calculation as given by Fig. 6 (I=16) this becomes:
∑
= = I i i i a p hy C V T D E i 1 3 2 2 1 4 π ρ . (8)The range for the pitch value p/D was determined and the number of p/D values used was 14. The shaft speed range was determined by a few trial runs and was taken as
n=0.15-0.31, with a step size of 0.02 (9 shaft speeds in total). As the inflow speed is the primary variable and the values are given in a discreet form in terms of probability distribution (as shown in Fig. 6), the number of total inflow speed values was 16 (Va=0.10-3.10 m/s). To find the optimum shaft speed and p/D value for the maximum achievable Cpow, there are Nrun = 14*9*16= 2016 data
points. After a few trial runs, it was found that the threshold inflow speed Va was not sensitive to the chosen
ranges of shaft speed and p/D value: in most cases when
inflow speed is greater or equal to 1.30 m/s the turbine has a positive power output. The number of total inflow speeds therefore was reduced to 10 (Va=1.30-3.10 m/s)
and hence the total value of required data points becomes
Nrun = 14*9*10= 1260. These data points can be obtained
by either model testing or numerical prediction and numerical prediction was used here.
Once the Cpow is obtained for all the data points, the
annual energy production can be calculated and then the optimization could be performed.
Optimization by varying the p/D values at fixed shaft speed. Table 3, as an example, shows the drag coefficient
Ct and power coefficient Cpow computed from
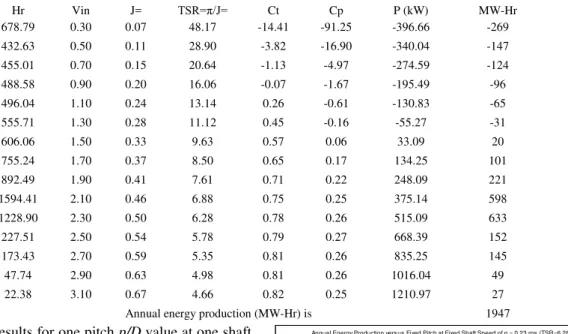
PROPELLA, and the annual generated hydrodynamic energy (gross energy before the deduction of mechanical and electrical loss) calculated by coupling both the inflow speed and its time probability in Eq. (8), for the 20-m bi-directional tidal turbine with p/D=0.20 at n=0.23 rps: Table 3. Annual energy production of a 20-m turbine with p/D=0.20 at n=0.23 rps.
Hr Vin J= TSR=π/J= Ct Cp P (kW) MW-Hr 678.79 0.30 0.07 48.17 -14.41 -91.25 -396.66 -269 432.63 0.50 0.11 28.90 -3.82 -16.90 -340.04 -147 455.01 0.70 0.15 20.64 -1.13 -4.97 -274.59 -124 488.58 0.90 0.20 16.06 -0.07 -1.67 -195.49 -96 496.04 1.10 0.24 13.14 0.26 -0.61 -130.83 -65 555.71 1.30 0.28 11.12 0.45 -0.16 -55.27 -31 606.06 1.50 0.33 9.63 0.57 0.06 33.09 20 755.24 1.70 0.37 8.50 0.65 0.17 134.25 101 892.49 1.90 0.41 7.61 0.71 0.22 248.09 221 1594.41 2.10 0.46 6.88 0.75 0.25 375.14 598 1228.90 2.30 0.50 6.28 0.78 0.26 515.09 633 227.51 2.50 0.54 5.78 0.79 0.27 668.39 152 173.43 2.70 0.59 5.35 0.81 0.26 835.25 145 47.74 2.90 0.63 4.98 0.81 0.26 1016.04 49 22.38 3.10 0.67 4.66 0.82 0.25 1210.97 27 Annual energy production (MW-Hr) is 1947
Table 3 shows results for one pitch p/D value at one shaft speed n. As mentioned, this primary optimization includes 14 pitch values and 9 shaft speeds, a total of 126 such tables. It is noted that the power coefficient Cpow and
hence the power output is negative when the inflow speed
a
V is less than 1.5 m/s so the threshold inflow speed for this turbine geometry and motion parameters is about 1.50 m/s. As only positive energy generation is meaningful, the total annual energy generation in the last row does not include the negative energy values. The total annual energy production shown in the table is the total hydrodynamic energy production, before mechanical and electrical loss during energy transfer and conversion. Figures 8-16 show the annual hydrodynamic energy production versus pitch value p/D. Results shown in each figure are for a fixed shaft speed.
Annual Energy Production versus Fixed Pitch at Fixed Shaft Speed of n = 0.23 rps (TSR=6.2832 at 2.3 m/s) 0.0 400.0 800.0 1200.0 1600.0 2000.0 0.07 0.08 0.10 0.13 0.14 0.15 0.16 0.17 0.18 0.19 0.20 0.21 0.22 0.23 0.24 0.25 0.26 0.27 0.28 Constant Pitch Distribution with Root Fillet (p/D)
MW
-H
o
u
r
Fig. 8 Annual hydrodynamic energy production versus pitch values p/D of the 20-m bi-directional turbine at a shaft speed of n=0.23 rps (preliminary design shaft
speed).
According to the energy production values shown in Fig. 8, at a shaft speed of 0.23 rps, energy production maximum (1946 MW-Hour)occurred at a pitch value of p/D=0.20. It can be seen that any pitch value lower than p/D=0.15 is not particularly useful. Therefore, for further computations, the range of pitch values was chosen between p/D=0.15-0.31.
Annual Energy Production versus Fixed Pitch at Fixed Shaft Speed of n = 0.15 rps (TSR=6.2832 at 2.3m/s) 1800 1880 1960 2040 2120 2200 0.15 0.16 0.17 0.18 0.19 0.20 0.21 0.22 0.23 0.24 0.25 0.26 0.27 0.28 0.29 0.30 0.31 Constant Pitch Distribution with Root Fillet (p/D)
MW
-H
o
u
r
Fig. 9 Annual hydrodynamic energy production versus pitch values p/D of the 20-m bi-directional turbine at a
shaft speed of n=0.15 rps.
Fig. 9 shows that at the lowest shaft speed of 0.15 rps, the maximum energy production (2166 MW-Hour) occurred at p/D=0.29 and the larger the pitch the higher the energy production, until it reached p/D=0.29. A larger pitch means a lower effective angle of attack.
Annual Energy Production versus Fixed Pitch at Fixed Shaft Speed of n = 0.17 rps (TSR=6.2832 at 1.7 m/s) 1800 1880 1960 2040 2120 2200 0.15 0.16 0.17 0.18 0.19 0.20 0.21 0.22 0.23 0.24 0.25 0.26 0.27 0.28 Constant Pitch Distribution with Root Fillet (p/D)
MW
-H
o
u
r
Fig. 10 Annual hydrodynamic energy production versus pitch values p/D of the 20-m bi-directional turbine at a
shaft speed of n=0.17 rps.
When shaft speed increased from n=0.15 to 0.17 rps, the maximum energy generation shifted to a lower pitch value from p/D=0.29 to 0.27. A gradual shift of the optimum pitch from a large pitch value to a smaller pitch value due to the increase of the shaft speed is shown in figures 11-16.
Annual Energy Production versus Fixed Pitch at Fixed Shaft Speed of n = 0.19 rps (TSR=6.2832 at 1.9 m/s) 1800.0 1880.0 1960.0 2040.0 2120.0 2200.0 0.15 0.16 0.17 0.18 0.19 0.20 0.21 0.22 0.23 0.24 0.25 0.26 0.27 0.28 Constant Pitch Distribution with Root Fillet (p/D)
MW
-H
o
u
r
Fig. 11 Annual hydrodynamic energy production versus pitch values p/D of the 20-m bi-directional turbine at a
shaft speed of n=0.19 rps.
Annual Energy Production versus Fixed Pitch at Fixed Shaft Speed of n = 0.21 rps (TSR=6.2832 at 2.1m/s) 1800 1860 1920 1980 2040 2100 0.15 0.16 0.17 0.18 0.19 0.20 0.21 0.22 0.23 0.24 0.25 0.26 0.27 0.28 Constant Pitch Distribution with Root Fillet (p/D)
M
W
-H
our
Fig. 12 Annual hydrodynamic energy production versus pitch values p/D of the 20-m bi-directional turbine at a
shaft speed of n=0.21 rps.
Annual Energy Production versus Fixed Pitch at Fixed Shaft Speed of n = 0.25 rps (TSR=6.2832 at 2.5 m/s) 1000 1200 1400 1600 1800 0.15 0.16 0.17 0.18 0.19 0.20 0.21 0.22 0.23 0.24 0.25 0.26 0.27 0.28 Constant Pitch Distribution with Root Fillet (p/D)
M
W
-H
our
Fig. 13 Annual hydrodynamic energy production versus pitch values p/D of the 20-m bi-directional turbine at a
shaft speed of n=0.25 rps. Annual Energy Production versus Fixed Pitch at Fixed Shaft Speed of n =
0.27 rps (TSR=6.2832 at 2.7 m/s) 0 600 1200 1800 0.17 0.18 0.19 0.20 0.21 0.22 0.23 0.24 0.25 0.26 0.27 0.28 Constant Pitch Distribution with Root Fillet (p/D)
MW
-H
o
u
r
Fig. 14 Annual hydrodynamic energy production versus pitch values p/D of the 20-m bi-directional turbine at a
shaft speed of n=0.27 rps. Annual Energy Production versus Fixed Pitch at Fixed Shaft Speed of n =
0.29 rps (TSR=6.2832 at 2.9 m/s) 0 600 1200 1800 0.15 0.16 0.17 0.18 0.19 0.20 0.21 0.22 0.23 0.24 0.25 0.26 0.27 0.28 Constant Pitch Distribution with Root Fillet (p/D)
MW
-H
o
u
r
Fig. 15 Annual hydrodynamic energy production versus pitch values p/D of the 20-m bi-directional turbine at a
shaft speed of n=0.29 rps
Annual Energy Production versus Fixed Pitch at Fixed Shaft Speed of n = 0.31 rps (TSR=6.2832 at 3.1 m/s) 200000.0 500000.0 800000.0 1100000.0 0.15 0.16 0.17 0.18 0.19 0.20 0.21 0.22 0.23 0.24 0.25 0.26 0.27 0.28 Constant Pitch Distribution with Root Fillet (p/D)
kW
-H
o
u
r
.Fig. 16 Annual hydrodynamic energy production versus pitch values p/D of the 20-m bi-directional turbine at a
shaft speed of n=0.31 rps.
The maximum annual hydrodynamic energy generation as a function of shaft speed and pitch at a fixed TSR of 2π is listed in Table 4.
Table 4. The maximum annual hydrodynamic energy generation as a function of shaft speed and pitch at a designed optimum TSR=2π
Design n
Va (m/s) at TSR=6.2832 1.50 1.70 1.90 2.10 2.30 2.50 2.70 2.90 3.10 C o n sta n t P itc h D is tr ib u tio n ( p /D ) 0.06 957.58 0.07 1092.35 0.08 1217.09 0.10 1436.89 0.13 1692.50 0.14 1758.01 0.15 1756.20 1842.86 1881.59 1870.08 1813.60 1710.50 1569.73 1377.68 1171.60 0.16 1811.36 1900.03 1937.51 1921.55 1859.53 1746.25 1596.61 1392.48 1173.57 0.17 1862.53 1952.06 1986.64 1964.52 1895.65 1770.56 1610.88 1397.03 1160.60 0.18 1909.62 1998.82 2029.00 1998.89 1922.12 1785.83 1612.25 1388.46 1132.36 0.19 1952.68 2040.35 2064.78 2024.95 1939.13 1792.32 1600.76 1367.08 1089.17 0.20 1991.88 2076.70 2093.83 2044.33 1946.50 1773.07 1517.21 1332.62 1035.24 0.21 2027.01 2107.95 2116.19 2057.71 1944.00 1773.68 1540.38 1285.47 983.20 0.22 2058.14 2134.03 2131.98 2063.40 1932.13 1748.19 1386.42 1225.66 919.06 0.23 2085.42 2155.06 2141.22 2061.43 1895.65 1712.57 1354.13 1054.65 843.11 0.24 2108.67 2170.93 2143.97 2051.65 1886.08 1666.62 1313.28 1070.11 755.13 0.25 2127.96 2181.65 2140.05 2034.22 1854.50 1610.24 1263.68 997.26 655.39 0.26 2143.32 2187.38 2125.19 2009.17 1814.36 1546.47 1546.47 914.22 543.74 0.27 2154.97 2188.12 2112.32 1976.65 1765.85 1485.31 1138.93 821.35 420.52 0.28 2162.64 2183.79 2101.14 1936.51 1708.69 1415.23 937.87 718.57 285.57 0.29 2166.34 0.30 2166.31 0.31 2160.32 Ehyd_Max (MW-Hr) 2166.34 2188.12 2143.97 2063.40 1946.50 1792.32 1612.25 1397.03 1173.57
Numbers in bold font in Table 4 are the maximum annual energy generated at a constant shaft speed for various pitch values. These maximum values correspond to the maxima in the plots shown in figures 8-16. The obtained optimum shaft speed and pitch values for the maximum energy (2188 MW-hour) of the 20-m turbine, are n=0.17 rps and p/D=0.27, respectively. Trial computations were first started with the inflow speed set at 2.30 m/s by keeping a constant TSR of 2π for all cases, which gives a corresponding shaft speed of n=0.23 rps at Va=2.30 m/s. Numbers in the blank cells in Table 4 were deemed not useful and hence not obtained because after the trial runs for Va=2.30 m/s, it was clear that neither optimum pitch nor optimum shaft speed fell in these blank cells. It can be seen from Table 4, even with the selected pitch range from p/D=0.15 to 0.28 and shaft speed range from 0.17 to 0.31 rps, the optimum turbine with p/D=0.27 at n=0.17 rps achieved 7.66 times of power production of the same
turbine with p/D=0.28 at n=0.31 rps. This indicates the importance in performing optimization on pitch and shaft rotational speed.
Optimization by varying shaft speed at fixed pitch values. If a turbine with a fixed pitch can adjust its shaft speed intelligently at each different inflow speed, the optimum pitch will be different and the maximum achievable energy production should be increased. Rearranging the same results obtained for this preliminary optimization, an optimum pitch value for the turbine can be determined. For a fixed pitch value at each inflow speed, variation of shaft speed was taken from 0.15 to 0.31 rps and from within these shaft speeds the maximum achievable energy was obtained. The sum of the maximum achievable energy for each inflow speed Va, is
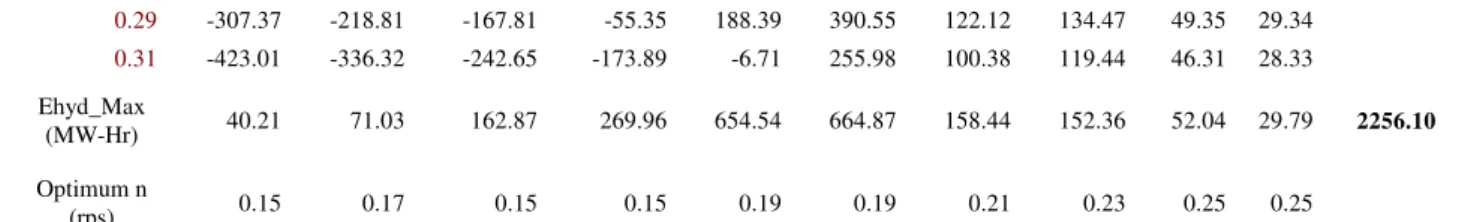
the maximum achievable energy production for that turbine of fixed pitch with a self-adjustable shaft speed. Table 5 shows a calculation example for p/D=0.26, one of the 12 fixed pitch values.
Table 5
Hydrodynamic energy generation (MW-Hr) of the prototype turbine with a fixed pitch distribution of p/D=0.26.
Va= 1.3 1.5 1.7 1.9 2.1 2.3 2.5 2.7 2.9 3.1 A n n u al T o ta l E h y d ( k W -Hr an d M W -H r) a t O p tim u m n S h af t R o ta ti o n al S p ee d (rp s) 0.15 40.21 70.32 162.87 269.96 637.27 623.42 142.31 130.85 42.70 23.40 0.17 23.51 71.03 153.69 268.82 654.54 653.03 151.06 140.24 46.09 25.38 0.19 -1.10 49.14 133.66 254.82 648.65 664.87 151.06 147.15 48.79 27.05 0.21 -34.27 17.71 101.56 226.55 617.36 657.14 158.44 151.31 50.73 28.37 0.23 -76.73 -23.96 56.49 182.60 557.88 627.61 156.28 152.36 51.83 29.30 0.25 -127.77 -76.90 -2.84 121.84 468.24 574.72 149.74 150.11 52.04 29.79 0.27 -236.82 -148.33 -98.35 -155.28 309.21 471.94 134.88 142.24 50.88 29.77
0.29 -307.37 -218.81 -167.81 -55.35 188.39 390.55 122.12 134.47 49.35 29.34 0.31 -423.01 -336.32 -242.65 -173.89 -6.71 255.98 100.38 119.44 46.31 28.33 Ehyd_Max (MW-Hr) 40.21 71.03 162.87 269.96 654.54 664.87 158.44 152.36 52.04 29.79 2256.10 Optimum n (rps) 0.15 0.17 0.15 0.15 0.19 0.19 0.21 0.23 0.25 0.25
The table shows that if the shaft speed could be adjusted intelligently, the annual energy production will rise from
2188 MW-Hour to 2256 MW-Hour, about 3.00% increase from that for the primary optimization of pitch and shaft speed. This is indeed a small increase and the reason is that the threshold inflow speed in most cases is about 1.50 m/s for this turbine prototype, and once the turbine starts to produce energy after its threshold speed, a good combination of a fixed pitch and fixed shaft speed would be effective. In practice the rotational speed of a tidal turbine, like that of many wind turbines, may be set by the required generator speed, leading to a design compromise in practice.
3.3. Optimization of Linear p/D
Distribution
Some trial runs were performed to investigate the effect of the effective angle of attack in the blade tip region. As a result of analysis from the runs, it was found that large effective angle of attack at the tip did not produce a high power coefficient but an appropriately reduced effective angle of attack (by increasing the p/D value) at the tip sections improved power conversion efficiency. Reducing the effective angle of attack of a turbine can be achieved by increasing the sectional geometric pitch angle. While there are an infinite number of pitch distributions that can increase the pitch angle at the blade tip, it was found that a linear increase in geometric pitch angle starting from
R
r≥0.60 did effectively improve the power coefficient
Cpow.
From the preliminary optimization in the previous subsection, the optimum shaft speed and pitch values for the maximum achievable energy of the 20-m turbine, are
n=0.17 rps and p/D=0.27, respectively. However, as the load of the turbine is already very light at n=0.17 rps and
p/D=0.27 which means that the effective angle of attack at the tip is already small, the maximum pitch value in the optimization should be about the same or less than
p/D=0.27 to allow for a higher tip pitch value. The range of pitch p/D was chosen from p/D=0.15 – 0.28 with a step size of 0.01, a total of 14 pitch points. To maintain the same blade loading, decreasing the base pitch value (i.e., increasing the base effective angle of attack) meant an increase in shaft speed was required (see Fig. 2 and Eqs. (2) and (6), respectively). Based on this analysis, the immediate shaft speed increment higher than 0.17 rps that was evaluated was 0.19 rps (shaft speed interval was chosen as 0.0.2 rps) so that both shaft speeds were chosen for the data acquisition runs. The maximum pitch values at the tip were set to be a factor of the base pitch values. The factors were chosen as 1.20-2.40, with a step size of 0.20 (the number of total linear distribution curve forms was 7). For a reduced number of inflow speeds of 10, based on the threshold inflow speed value of 1.30 m/s (1.30-3.10 m/s with a step size of 0.02), the numbers of total required runs was then: 14 pitch*7 curve form*10 inflow speed*2 shaft speed=1960 runs. For the 7 linear distribution curves, Table 6 shows the occurrence of the larger annual energy production maxima between the two shaft speeds n for the 14 values of base pitch p/D.
Table 6. Occurrence of annual energy production maxima at different shaft speeds and base pitch values.
Designed n (rps) Va_TSR (m/s) Base Pitch p/D 0.15 0.16 0.17 0.18 0.19 0.20 0.21 0.22 0.23 0.24 0.25 0.26 0.27 0.28 0.17 1.70 ♦ ♦ ♦ ♦ ♦ ♦ 0.19 1.90 ♦ ♦ ♦ ♦ ♦ ♦ ♦ ♦
In Table 6 for the two shaft speeds, the design value of tip-speed-ratio TSR was kept constant at 2π, corresponding to inflow speeds 1.70 and 1.90 m/s, respectively, to ensure an equal loading condition. Optimization was performed to take into account all the speeds and their probability of occurrence (see Eq. (8)). The TSR ranges corresponding to the inflow speed range of Va =1.30-3.10 m/s were TSR=3.85-9.18 and 3.45-8.22,
for the shaft speeds of n=0.19 and 0.17 rps, respectively. The TSR ranges are wide enough to make all the annual energy production maxima fall within the inflow speed ranges.
Tables 7 and 8 show the annual energy production maxima at fixed base pitch value p/D versus maximum pitch factor.
Table 7. Maximum annual energy production at n=0.19 rps versus different linear pitch factors and nominal base pitch
p/D
Base Pitch Tip pitch factor Eg_Max (MW-Hr) 1.00 1.20 1.40 1.60 1.80 2.00 2.20 2.40
0.15 1881.59 1961.30 2029.21 2085.11 2129.15 2161.17 2181.19 2171.03 2181.19 0.16 1937.51 2014.99 2079.15 2129.53 2166.51 2189.71 2199.30 2195.31 2199.30
0.17 1986.64 2061.08 2120.36 2164.18 2192.69 2205.85 2203.52 2205.85 0.18 2029.00 2099.52 2152.86 2169.88 2207.87 2209.57 2194.15 2209.57 0.19 2042.53 2130.30 2176.84 2203.89 2212.02 2201.09 2212.02 0.20 2093.83 2153.55 2192.00 2209.15 2205.29 2184.80 2209.15 0.21 2116.19 2169.15 2198.65 2204.75 2190.68 2204.75
Table 8. Maximum annual energy production at n=0.17 rps versus different linear pitch factors and base pitch p/D
Base Pitch Tip pitch factor Eg_Max (MW-Hr) 1.00 1.20 1.40 1.60 1.80 0.23 2155 2208 2239 2249 2238 2249 0.24 2171 2217 2241 2241 2218 2241 0.25 2182 2221 2236 2225 2189 2236 0.26 2187 2219 2224 2197 2158 2224
In Tables 7 and 8, a tip pitch factor of 1.20 means that the blade tip pitch is 1.20 times that of the nominal base pitch, i.e., the p/D value at r=0.60R is p/D*(1.00+0.0) and at
r=1.00R is p/D*(1.00+0.20)=1.20p/D. The increase is linear. For each base pitch value, an annual energy production maximum was obtained (see the values at the right hand most columns of these two tables).
Comparing the maxima in both Table 7 and 8, the optimum nominal base pitch and the tip pitch factor are
p/D=0.23 and fp=1.60, respectively. The optimized
turbine at n=0.17 rps with an optimum linear pitch distribution based on the primary optimization was 2249
MW-Hour. Linear pitch optimization produces an increase in energy production of about (2249-2188)/2188*100%=2.80% based on the primary optimization. Even though the increase is small, once the turbine is made the increase is built in without needing any dynamic control. This would mean that this optimization for tip pitch variation is worthwhile. More refined optimizations using nonlinear curve forms may give slightly more improvement in energy generation.
3.4. Optimization of Rotor
Diameter
In the design case the diameter was predetermined at
D=20.00 m. As there was no choice (due to water depth at
the location), hence optimization in diameter was not necessary. However, in this section, the effect of rotor diameter on power generation performance is examined. As power production is proportional to D2 for turbines of different diameters, annual energy production cannot be used for comparison. Instead, an energy production factor,
i i a I i i pow f C V T E 3 1
∑
= = (9) was defined and used for optimization, where Vai is thetidal inflow velocity distribution and Ti is the time period
of the tidal velocity of Vai.
Again to maintain about the same level of loading for each turbine of different diameter, tip-speed-ratio TSR was kept at the same value (TSR=Rω/Va=2π) for all
diameters at the same inflow speed. The prototype turbine geometry with p/D=0.27 at a fixed design shaft speed n=0.17 rps, which resulted through the primary optimization, was used. For investigation of influence of diameter, 9 different diameters of 1.00, 2.00, 3.00, 6.00, 9.00, 12.00, 15.00, 18.00 and 20-m, and 12 inflow speeds of 0.90-3.10 m/s with a step size of 0.02 m/s were taken. This yields 9*12=108 total number of data points. Table 9 shows the motion parameters of an 18.00-m turbine, its performance data Ct, Cpow and the energy
production factor Ef.
Table 9. Motion parameters of an 18.00-m turbine and its performance data Ct, Cpow and the energy production factor Ef.
D (m) = 18.00 n(rps) = 0.19 N (rpm) = 11.33 Hour Va J TSR=π/J= Ct Cp Ep 488.58 0.90 0.26 11.87 -0.03 -0.71 -251.17 496.04 1.10 0.32 9.71 0.26 -0.14 -89.43 555.71 1.30 0.38 8.22 0.42 0.10 122.40 606.06 1.50 0.44 7.12 0.53 0.21 420.47 755.24 1.70 0.50 6.28 0.59 0.25 936.35 892.49 1.90 0.56 5.62 0.64 0.27 1658.60 1594.41 2.10 0.62 5.09 0.67 0.28 4066.59 1228.90 2.30 0.68 4.64 0.69 0.27 4074.76 227.51 2.50 0.74 4.27 0.71 0.27 945.40 173.43 2.70 0.79 3.96 0.72 0.26 879.35 47.74 2.90 0.85 3.68 0.72 0.25 289.41 22.38 3.10 0.91 3.45 0.73 0.24 159.55 Annual energy production factor= 13552.87
When TSR is kept constant, the larger the diameter, the lower the required shaft speed. Fig. 17 shows the increase in the diameter with the increase in the energy production factor.
![Fig. 1 shows a comparison between the predicted [20] and the measured power coefficient of the NREL full-scale wind turbine with the S809 blade section and a constant pitch angle of 12° [16, 17]](https://thumb-eu.123doks.com/thumbv2/123doknet/14115702.466924/5.892.462.801.92.225/shows-comparison-predicted-measured-coefficient-turbine-section-constant.webp)