ARGO
Pre-shipment test of the
laser guide star wavefront
sensor
Marco Bonaglia
a, Lorenzo Busoni
a, Tommaso Mazzoni
a, Alfio Puglisi
a, Jacopo Antichi
a,
Simone Esposito
a, Gilles Orban de Xivry
b, and Sebastian Rabien
ba
Osservatorio Astrofisico di Arcetri, L.go E. Fermi 5, 50125 Firenze, Italy;
b
Max-Planck-Institut f¨
ur extraterrestrische Physik, Giessenbachstraße, 85748 Garching,
Germany
ABSTRACT
We present the results of the laboratory characterization of the ARGOS LGS wavefront sensor (LGSW) and dichroic units. ARGOS is the laser guide star adaptive optics system of the Large Binocular Telescope (LBT). It implements a Ground Layer Adaptive Optics (GLAO) correction for LUCI, an infrared imager and multi-object spectrograph (MOS), using 3 pulsed Rayleigh beacons focused at 12km altitude.
The LGSW is a Shack-Hartman sensor having 15 × 15 subaspertures over the telescope pupil. Each LGS is independently stabilized for on-sky jitter and gated to reduce spot elongation. The 3 LGS pupils are stabilized to compensate mechanical flexure and are arranged on a single detector. Two units of LGSW have been produced and tested at Arcetri Observatory. We report on the results obtained in the pre-shipment laboratory test: inter-nal active flexure compensation loop performance, optomechanical stability under different gravity conditions, thermal cycling, Pockels cells performance. We also update on the upcoming installation and commissioning campaign at LBT.
Keywords: Large Binocular Telescope, Ground Layer Adaptive Optics, Laser Guide Star, Shack-Hartmann wavefront sensor, Pockels cell.
1. INTRODUCTION
ARGOS1 performs a tomographic measurement of the atmosphere through a constellation of laser guide stars (LGS) and it corrects for the ground layer turbulence by the use of the adaptive secondaries of LBT. The LGS are arranged on a fixed triangular asterism 20 off-axis. The laser beacon are projected from the back of the secondaries and focussed by the refractive launch optics at 12km distance. Each LGS is generated through the Rayleigh scattering of the 532nm light pulses emitted at 10kHz frequency by a dedicated 18W commercial laser head.
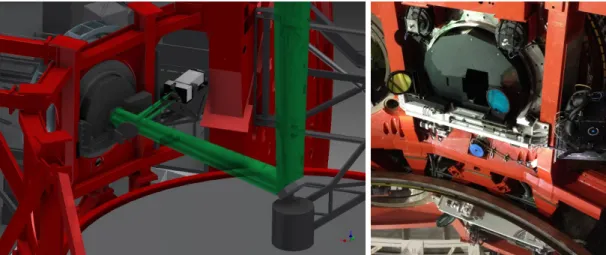
Due to the finite distance of the LGS the telescope focusses the laser light into a F16.6 beam about 1.5m behind the plane where the natural objects are imaged. For this reason and to not impact the 4 × 40 instrument field-of-view (FoV) ARGOS uses a dichroic beamsplitter to pickoff the lasers from the science light. This unit is composed first by a 20mm thin double-flat window slightly wedged (0.08◦) to compensate for the color component introduced by the 15◦tilted optic and then by a 120flat mirror at 600mm distance and 21◦incidence that reflects the laser light towards the LGS wavefront sensor (LGSW) installed on an auxiliary focal station outside the instrument rotator (see Figure 1). The LGS constellation is properly clocked on-sky in such a way that one edge of the triangle is parallel to the dichroic-mirror reflection plane.
The LGSW unit is installed at the F16.6 focal plane, where the 3 LGS are imaged at a 80mm distance from the telescope optical axis. In correspondence of each LGS image the LGSW has an annular mirror that transmits the central 4” while it reflects the outer 60” area towards an acquisition camera able to control the launch optics to correct for the LGS position on-sky. In the LGSW each LGS is sensed independently:2 its vibrations due to the double propagation through the atmosphere is filtered out by a pupil-conjugated fast steering mirror, on each SH sensor the pupil position is actively controlled by a motorized lens and it is sensed by 15 × 15 subapertures.
Figure 1. Left: model of the arrangement at the telescope right eye for the ARGOS dichroic and LGSW. Lasers light path is highlighted in green: a double reflection first on the dichroic and then on a flat fold mirror allows to pickoff the 532nm light from the convergent beam and to direct it towards the LGS wavefront sensor. Right: picture of the dichroic optics and support structure installed at on the right eye of the telescope. The DX-LGSW unit is also partially visible on the right of picture.
To reduce the SH spots elongation the 3 laser beams are range gated by independent electro-optical shutters designed as Pockels cells.
Two units of the ARGOS LGSW where fully assembled at the Arcetri premises during the 2013. During the first part of the year the wavefront measurement capabilities of the sensors were checked in the lab using a MEMS deformable mirror.3 In parallel more delicate hardware installed on the sensors was kept under control testing their performance and functionality. This work is described in section 2 of this paper: procedures to measure the Pockels cells suppression rate and to verify tge WFS camera characteristics were developed and integrated into the LGSW control software. In section 3 we describe the test procedure aimed to verify the functionality of the stability control loops internal to the sensors, in preparation of the commissioning the the system at the telescope.
The successful test results of the LGSW units allowed to ship the first unit to LBT in February 2014 and to install it on the right eye of the telescope in March. After that it was also possible to perform a series of test using the telescope adaptive secondary8 to verify the functionality of the LGSW and of the adaptive optics control loop (see section 4).
2. LABORATORY TEST OF THE LGSW DEVICES
Before being able to start the commissioning of the system at the telescope the most critical hardware elements of the LGSW undergo a set of functionality and performance test. These test have been repeated in many other occasions and in different environments. For example a massive work to analyse the performances of the WFS detector have been carried out at MPE especially to mitigate the common-mode noise effects on the SH centroiding accuracy, to develop the camera control software and to verify the best options for the slope computation algorithms.5 In this section however we describe the last test campaign performed at Arcetri premises on the fully assembled system. The measurements and the analysis described in this section have been validated comparing the results with the ones previously obtained. The test procedures then have been integrated into the LGSW control software in such a way to have an easy way to check the functionality of the hardware once the system will leave the laboratory.
2.1 Pockels cell
To obtain a good signal-to-noise on the on-sky centroid measurements the LGSW must be capable of range gating the laser beacons. At this scope each LGS arm is provided with and independent Pockels cell. A detailed
1.2x10⁴ 1.0x10⁴ á 6.0x10³ Sm 4.0003 F 2.0x10³
Blue - Suppression rate 988.72512 1036.7445 Yellow - Suppression rate
1120.9088 Red - Suppression rate
% 0.5 1.0
Time ON ]usec]
1.5 20
description of these devices is given in.4 They are a modification of the standard Pockels cell concept developed by Max-Plank-Institut f¨ur extraterrestrische Physik: between 2 aligned linear polarisers are inserted 2 BBO modulators and a quartz retarder to rotate the polarization. The requirements specified in the design phase of ARGOS were given in terms of the suppression rate between the cells ON and OFF states that must be greater than 200.
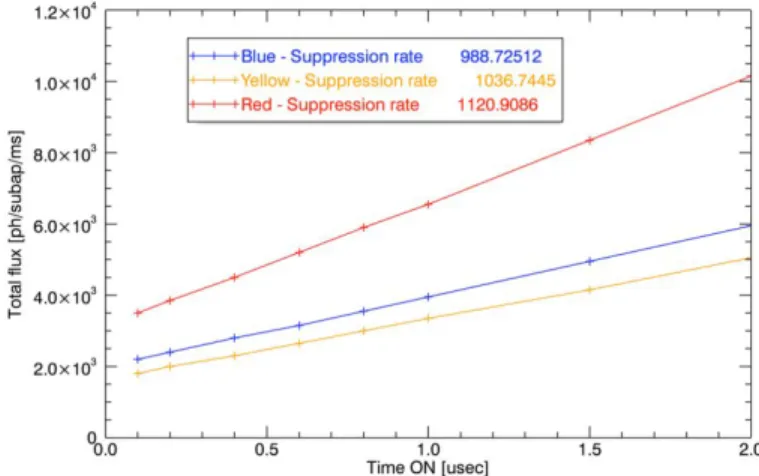
Since the opto-mechanical layout of the LGSW is complex the 3 Pockels cells units are hard to access and to remove, so we inspected the possibility to measure the suppression rate when they are still assembled in the LGSW. The measurement procedure makes use of the internal light source of the LGSW to illuminate the cells with a 6mm collimated beam of 532nm light, giving a constant input flux Φin. The measurement procedure consists of varying the opening time ton of each cell between 0.1 and 2.0µs∗ and computing the output flux (Φout) from the total subapertures fluxes on the SH sensor. The relation between the integrated flux per ms Φout on the LGSW detector and the cell opening time ton is linear:
Φout= Φin(T Ronton+ T Rof f tof f), (1) where TR represents the transmission of the cell in the ON or OFF state respectively and tof f the interval between 2 ON states, about 100 times greater than ton.
It is clear that performing a linear fit of the data it is possible to compute the suppression rate of the cell (S = T Ron/T Rof f) from the ration between the intercept, when the cell is completely switched off, and the slope of the line. Figure 2 shows the suppression rate measured on the 3 Pockels cells mounted on the DX-LGSW unit during the test in Arcetri, all the 3 devices meet the specifications.
Figure 2. Plot of the suppression rate measured in Arcetri on the 3 Pockels cells mounted on the DX-LGSW.
2.2 LGSW detector
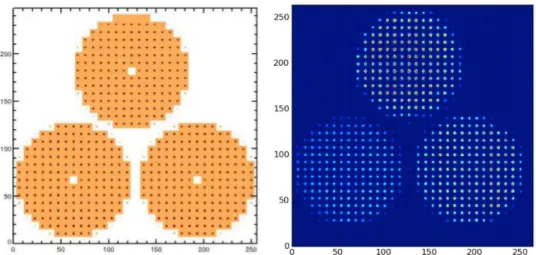
The LGSW detector is a PnCCD developed by PnSensors in collaboration with MPE. The image area has a size of 11.9 × 12.2mm2, comprising 248 × 256 sensitive pixels with a size of 48µm. To allow high speed operations (up to 1kHz) while maintaining the 2 dimensional imaging capabilities, the PnCCD detector has been designed to operate in a split frame transfer mode. The particular optical design of the ARGOS LGSW allows to image the spot patterns coming from the 3 SH sensors on the PnCCD. Figure 3 shows on left the simulated spot geometry as foreseen from the design phase and on right it shows the one realised on laboratory using the internal LGSW light source, mimiking a 1” FHWM object on-sky.
∗
For ton < 0.1µs the light leakage caused by the ringing effect in the BBO crystals during the ON-OFF switching
process becomes comparable with the total flux of the ON state. For ton> 2.0µs start to appear saturation effects in the
200 150 140 200 270 250 200 150 100 50 r 0 0 0 0 0 0 0a0 0J
o c
c 0 a0 000.0.1.04W* o 0 e 00 50 100 150 200 250Figure 3. Left: simulated image of the SH spot pattern on the LGSW detector as foreseen from the design phase. Right: spot pattern realized in the lab using the LGSW internal light source.
Some critical parameters of the PnCCD have been measured in the laboratory during the LGSW pre-shipment test, comparing them with the ones previously obtained:5
1. Frame rate: 100 ÷ 1000Hz 2. Read-out-noise: 3.7e− 3. Gain: 4.0e−ADU−1
The maximum and minimum frame rate has been successfully tested using the final slope computer device that is a custom Basic Computational Unit produced by Microgate.6
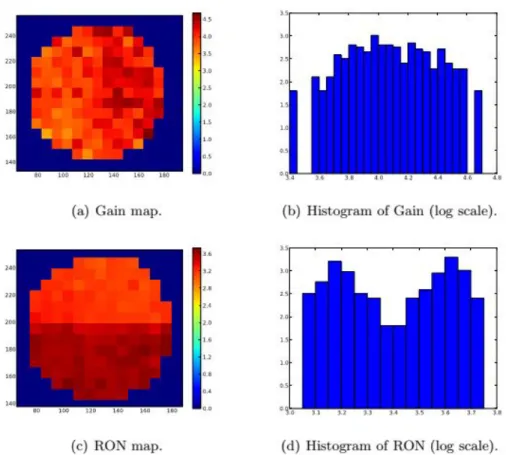
Since the PnCCD was already assembled and aligned in the LGSW we had to develop a procedure to measure the camera gain and read-out-noise without having a flat illumination pattern. At this scope we used the internal light source of the LGSW analysing the average flux over each group of 64 pixels composing a subaperture. The light flux is swept within a non saturation range, for each step 1000 frames are acquired (the analysis described here was carried out at 500Hz, but different frame rates can be selected). For each subaperture the time average of the flux and the variance are computed and they can be approximated by a linear fit as shown in Figure 4. The gain value is represented by the slope. The intercept of the linear fit instead represents the variance of signal with no light, so the PnCCD read-out-noise can be evaluated by its square root divided by the median gain over the frame.
The analysis is carried out just on the lighted subapertures, Figure 5 shows the results for one of the 3 pupils of the LGSW. Although the gain map (on top) shows no substantial pattern, it is clearly visible that the read-out-noise values (shown on bottom) are different between two adjacent camex having that result 3.2 ± 0.1 and 3.6 ± 0.1e− respectively. This effect was already noticed during the previous test performed on the full camera frame: the gain variation was estimated < 10% while the measured RON was 3.7 ± 0.2e−.
3. TEST OF THE LGSW INTERNAL LOOPS
As already mentioned in section 1 the LGSW is provided with 2 control loops to correct both for the pointing and pupil position errors. The pupil stabilization loop3 makes use of the WFS camera frames downloaded at 20Hz rate by the system diagnostics from the BCU slope computer (see section 2.2) to evaluate the positions of the 3 SH pupil centers using a Sobel edge-detection algorithm and Hough transform. The measures are translated in position errors with respect to the nominal pupil positions through a proportional gain 2 × 2 matrix and are corrected on 1s time scale by displacing the input collimating lens of each LGS through a couple of stepper motors. A threshold value of 0.1 subapertures is applied to the correction to avoid unnecessary movement of the motors.
500 600
Average flux [ADU /ms]
240 0 5 220 .0 200 .5
I
0 180 .5 140 0 s 140 80 100 120 140 160 180 .0 240 220 200 180 260 140(a) Gain map.
no 100 170 140 100 (c) RON map. 180 3.6 3.2 2.8 2.4 2.0 1.6 1.2 0.8 OA 0.0 3.5 5.0 7.5 2.0 15 1.0 0.5 (b) 34 3.0 40 32 44 4 44
Histogram of Gain (log scale).
(d) Histogram of RON (log scale).
Figure 4. Plot of the variance of the flux versus the average flux computed over a subaperture of one of the 3 SH sensors of the LGSW.
Figure 5. Maps of the gain and RON values measured on each illuminated subaperture of one of the 3 LGSW SH sensors. The measured values have also been summarized in the two histogams on the right showing an uniform distribution for the gain with a 10% PtV variation and a double-peaked distrubution fot the RON measured across 2 adjacent camex.
IA ma. 12 ma 10 ma, aryos_tekme[ry LGSW iRe 7l c.
tabllization Loop Accuracy st0evllam sza
o
iéxLrtSWmxwñ¡mrtñs?e°8eúi.ñói1.óó'v'smivéwiv
OR ImOSw Cw ROLLER jO3E00 6iaeNZiMR LOOP STORE Ró X
óóxiOSwCOVmOILLERjn3mSCiMBiIluiVmR:ówSmmRErtúówrx
Ox IOM cwmwuEnpmn sleeiulam0 LOOP IS RUNNING
last .o e9 l 3nMas 193mal aómn 10 56
vgl
roi 13a: 1sas3mmiimä3.6m ]m3 óa ]ñ
Vgl .somas 1 0 mx 111 mu 3.33mas
roa al6mas 303 mm s6ó mu 13.1mas
Vgl 16 ma 1 3 mx 19]mas 19 ma
pl 1 0 0 11 3
3.1 Jitter stabilization loop characterization
One of the control loops internal to the LGSW is aimed to compensate for the residual atmospheric tilt in each LGS that is due to the double propagation of the laser light into the atmosphere. This is necessary to allow the LGSW to work in a zero-tilt condition and reducing the chance of saturation. The residual tilt on each LGS is estimated at full rate (1kHz) by the BCU slope computer as average value of the X and Y slopes. The 6 element vector is copied on a dedicated memory location, multiplied by a reconstruction matrix, that already includes the gain factor, to retrieve the proper set of positions to apply to the piezo-actuated mirrors (Physik Instrumente S334.1SL) through an High Voltage Controller (HVC). Since a large position command applied to the mirrors could steer the spots pattern onto the adjacent subapertures making the loop to converge around a wrong tilt value. To avoid applying large commands an initial position offset must be applied to the mirrors to recenter the spots on the proper subapertures pattern.
The accuracy of the loop on the tilt measurement was tested in absence of external perturbation. Figure 6 shows a the evolution of the tilt measurement over 15 minutes. During the first 3 minutes the loop was open, so the tilt variance was mainly due to noise in the tilt measurement, which in turn is related to the PnCCD noise. It is visible that the noise along the X direction is higher than the one in the Y direction because of the WFS camera common-mode correction residuals†.
Figure 6. Jitter stabilization loop performance in absence of external perturbation. The X (solid) and Y (dashed) tilt standard deviation over a set 100 measurements per pupil are plotted at intervals of 1s. Tilt values are referred to the equivalent angle on-sky. The jitter stabilization loop was closed at 15:55 and the noise value doesn’t increase, as expected from a stable loop. At 15:58 the average flux per subaperture was reduced to 200γ; ms−1 and at 15:59 it was reduced again to 150γ ms−1. At 15:41 instead the flux was set to the original value of 500γ ms−1 showing a loop accuracy of 5mas in nominal conditions.
3.2 Stability test results
To evaluate the stability of the LGSW optomechanics the two units were installed on a tilting bench able to simulate the elevation movement of the telescope between 0 and 90◦. These test were carried out on both the LGSW units at Arcetri premises during the last months of 2014.
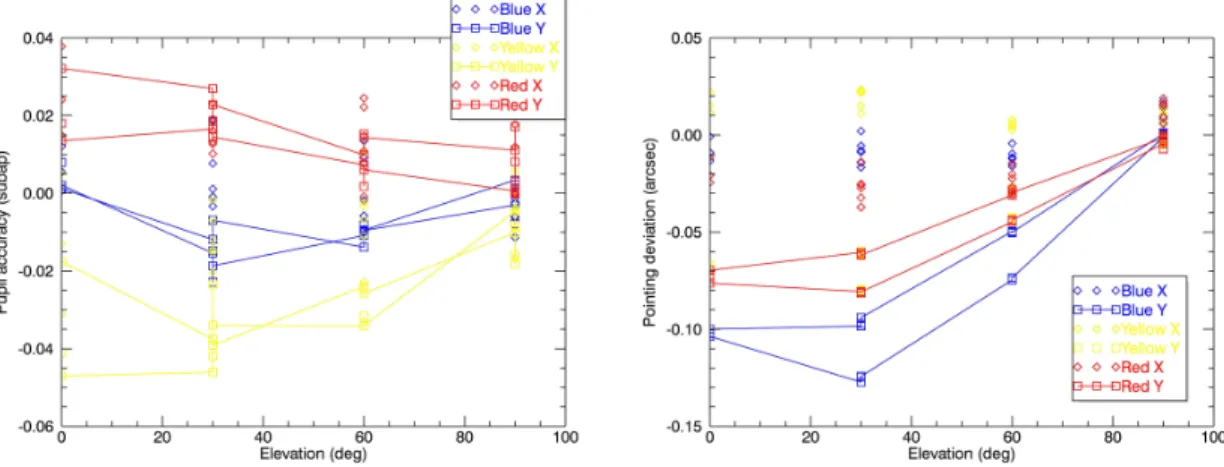
To measure the deflection of the pupil and pointing errors the system was maintained in open loop in the meanwhile the elevation range was spanned from 0 to 90◦ and back to 0. As explained, the pupil position is measured by the pupil stabilization loop while the pointing offset is measured the the jitter stabilization routine. Both measurements are stored in the LGSW telemetry data. Figure 7 resumes the data collected, X and Y behaviours are highlighted. As expected from the LGSW optomechanical setup flexures are more evident along the Y axis, in particular for the ”Blue” arm corresponding to the top pupil of Figure 3 that is more distant from the optical breadboard where the support flanges are fixed. The offsets along the X axis are negligible and within the measurement error level. Hysteresis effects are also negligible. The maximum pointing deviation in
†
The PnCCD suffers from a correlated noise due to a fast offset variation (time variant), that results in a line-by-line variation. This noise hence injects frequency signals into the horizontal slope measurements. As hinted in section 2.2 a large effort was spent to analyse and decrease the effects of this common-mode noise.5
âro 0.04 0.02 0.00 ro Ú ro -0.02 a' -0.04 o o oBlueX o--E-oBlue Y -0.06 20 40 60 80 100 Elevation (deg) 0.05 0.00 > ó -0.05 -ó rn d -0.10 -0.15 0 o *Blue X o oBlue Y 0 o *Red X oRed Y 20 40 60 80 100 Elevation (deg) 900 Step Boo step
'
]005[q GooStep 500 Step 40o step 300 step n 200 step 100 Step 2 8 4 7 h .. - - .. .. ..argos telemetry: 5X LGSW Pupil Motors (1h 19m 430)
.. á 8 a á . .. . á .. . .. .. d 9 .. .. 6 mrad 5 mrad 4 3 mrad mrad . :, .. ... ... .... .... : : ... ... ; 2 mrad ._ _ 1 mrad 0 mrad -1 mrad ó ó ó n ó .ó n v n rv n m rv o m rv m a m m n m m é v, S . e. ?; o
argos_telemetry: SX LGSW Jitter Stabilization Loop Mirror Offset (1h 19m 405)
H,
.i
the full operative elevation range (90 to 30◦) is 100mas and it will be compensated by the jitter stabilization loop using a small (< 10%) fraction of the piezo stroke.
Figure 7. Plots of the pupil (left) and pointing (right) deviations recorded during the elevation test of the DX-LGSW. Colors correspond to the 3 SH sensors
The elevation test was also repeated closing the internal loops: the measured offsets for pupil and pointing positions were corrected in the system showing some coupling between these 2 degrees of freedom. Figure 8 highlights this effect on the SX-LGSW: the plot on top shows the pupil motors positions while the one on bottom the integrated mirror position. When the pupil motors are moved a tilt is introduced and instantaneously compensated by the jitter stabilization loop. This effect is present from design and it is not affecting the performance of the system because of the fast response of the jitter loop with respect the pupil one.
Figure 8. Plots of the pupil motor positions (top) and piezo mirror offsets (bottom) when the SX-LGSW system was moved in elevation and the internal loops were closed. Coupling between the pupil motors movement and mirror commands are clearly visible.
-
-" e ;7 ) ).f)s
) .441 :;), c) ):.)-,)) jfKp
f.7 o t+ we If fl C.3. i.))) e.4.) )r C )0
0 ^0.) < t.) C, g.1. -fY_ 0z o
o
S :2 , ). tt , 1). :¡ )e 7: z 0. 1 1, 014/1 A. .7. fro...
'3) l!,
..6
a 0/ t Isei
.4..:. 1.110 -.L = ..0,
'
4. LGSW INTEGRATION ON TELESCOPE AND TEST WITH ASM
As already mentioned in section 1 the ARGOS dichroic optics and their support structure was installed on both eyes of the telescope during February 2014. At the same time the dichroic and fold mirror installed on the right eye were aligned to properly direct the telescope optical axis on the interface table for the LGSW. The installation of the ARGOS system on the right eye of the LBT was completed on March providing it with the DX-LGSW, its control electronics and the deployable calibration source7 necessary to mimic 3 off-axis sources in the LBT prime focus, illuminating the adaptive secondary and generating on the F16 focal plane an asterism of 3 reference sources with the same configuration of the ARGOS LGS and equivalent to a 1” FWHM on-sky.
In May 2014 a first set of calibrations were produced: each SH sensor of the LGSW system was calibrated independently with the LBT adaptive secondary setting to zero the slopes of the other 2 sensors. Several precautions were taken to calibrate the system: first a small number of low order Karhunen-Loeve orthonormal modes were applied to the mirror surface at 300Hz following a push-pull approach. In parallel LGSW slopes were recorded running the system at the same frequency in a high flux regime (> 1000γ ms−1subap−1). Basing on the recorded Interaction Matrices (IM) the 3 SH sensors were calibrated as different SCAO systems using a pseudo-inversion algorithm. Once low order modes were calibrated it was possible to close the AO loop and to apply to the mirror another set of modes reaching higher orders. The procedure was repeated until all the 150 modes were calibrated allowing to properly flatten the mirror. To maximize the sensor signal-to-noise during the IM acquisition the amplitude coefficient of each mode was optimized rescaling it on the variance of the slopes recorded for each mode. In this way it was possible to record a new optimized IM having almost a constant slope rms for all the 150 modes (see Figure 9).
Figure 9. Left: plot of the interaction matrix of the ”Yellow” sensor (corresponding to the bottom-left SH pattern of Figure 3) and the adaptive secondary. 150 Karhunen-Loeve modes were calibrated at 300Hz using the telescope prime focus calibration source. Mode order increases from bottom left to top right. Right: detail of 8 modes: tip-tilt (0-1) on the bottom, 13-14, 26-27 and 39-40.
4.1 Wavefront sensor measurement error
The wavefront sensor measurement noise is estimated at 3 different illumination regimes, corresponding to fluxes of 1000 (high), 750 (medium) and 350γ ms−1subap−1(low) respectively. The mirror was first flattened applying the correction with the full 150 modes running the system at 1kHz. Then the loop gain was turned temporary to 0 and a set of 8000 slopes was recorded. Because the bandwidth required to store the full 1600 slopes vector from the high speed loop it was too big a decimation factor of 2 was inserted. The slopes were multiplied by the reconstructor obtaining the modal coefficients of the wavefront for the full time series. The temporal variance of the modal coefficients is finally computed and plotted in Figure 10. Assuming a linear dependence between the wavefront error variance and the inverse of the light flux it is possible to estimate the WF error per photon expected from the sensor by fitting the data of Figure 10 and obtaining a value of 2 · 107nm2rms γ−1.
1000 100 10 mode number 100 5x10⁴ 4,104 E 3,104 ó 2,104 1,104 0.0015 0.0020
1 /Flux [phot /subap] -1
0.0025
Figure 10. Left: plot of the measurement noise for the Yellow arm of the DX-LGSW evaluated at 3 different levels of illumination running the system at 1kHz in open loop. The wavefront reconstructed on the 150 modes (tip-tilt excluded because of the strong vibration component) results 215, 140 and 120nmrms respectively. Right: fitting the WF measurement errors obtained at different illuminations it was possible to evaluate the expected WF error per photon.
4.2 LGSW closed loop test with ASM
Having calibrated the LGSW as 3 independent SCAO systems it has been possible to check their functionality closing the AO loop with the ASM. In this first test no temporally-evolving disturb, mimicking the atmospheric turbulence, was introduced on the ASM. The ”Yellow” sensor was measuring at 1kHz rate in an high flux regime (> 1000γ subap−1) without slopes offset, so basically trying to remove all the aberrations measured on the 150 modes basis. Since a strong vibration component was present in the test setup the image stabilization was performed by the FLAO pyramid WFS9fed by the on-axis source of the ARGOS calibration source. In this way it was possible to simulate the on-sky working condition where the atmospheric tip-tilt is sensed on a natural reference star by the pyramid WFS.
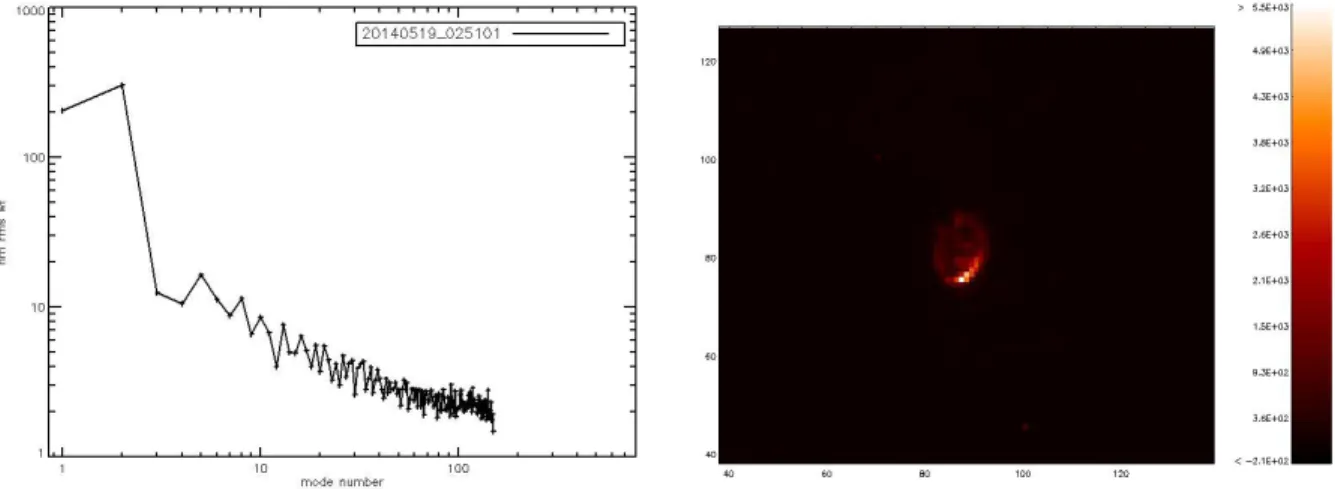
Figure 11 highlights the output of the test. The residuals of the closed loop are evaluated from the Yellow SH sensor slopes, recorded at 500Hz rate and projected on the modal basis. Integrating the modal variance evaluated on the 150 modes base (tip-tilt excluded) we obtained a residual wavefront error of 46nm rms. Figure 11 on right shows the image of the on-axis source taken with LUCI in H band with a 0.125” resolution. The extended PSF is mainly due to the telescope off-axis aberrations mimicked by the calibration source hologram and injected by the SH sensor into the instrument image plane because the non common path aberrations between sensor and instrument were not calibrated.
5. CONCLUSION
We have resumed in this paper the output of test carried out in Arcetri during 2013 and aimed to prove the functionality of the 2 units of the ARGOS LGS wavefront sensors. Specific procedures to test the WFS camera and Pockels cells performance have been developed. The test demonstrated that these devices are working within their design specifications in terms of light suppression (about 1000) and chip characteristics (read-out-noise: 3.7e− at 1kHz, gain: 4.0e− ADU−1). During the test the 2 LGSW units undergo a simulation of the environmental and working conditions present at the telescope, demonstrating that the control loops internal to the sensors are able to maintain the wavefront measurement stable and under the noise level.
Since the first unit of the LGSW was installed on the right eye of the telescope in March 2014 we also discussed some preliminary wavefront error measurement performed after the 3 SH sensors were calibrated with the LBT adaptive secondary using the prime focus calibration source. The test shown that the measurement error for the sensor is within 120nm rms in a high flux regime (> 1000γ subap−1). At last we also shown the results of a closed loop performed without injecting disturbance on the ASM, with the FLAO pyramid WFS measuring the tip-tilt component and one of the LGSW SH sensors measuring up to 150 modes. A WF error of 46nm rms was measured from the residuals of the SH slopes.
1000 100 10 mode number 120 100 80 60 60 80 100 120 4 0E+03 4 3E+03 3 6E+03 3 2E+03 2 6E+03 2.1E+03 1.5E+03 6 3E+02 3 6E+02 < -2.1E+02
Figure 11. Left: plot of the modal variance of the closed loop residuals evaluated from the SH sensor slopes. The integrated WF error (tip-tilt excluded) amounts to 46nm rms. Right: LUCI log-scale image of the on-axis calibration source taken in H band with 0.125” resolution when the AO loop was closed. The coma aberration affecting the PSF is clearly visible.
REFERENCES
1. S. Rabien et al., ARGOS: the laser guide star system for the LBT, Proc. SPIE 7736, 77360E (2010). 2. M. Bonaglia et al., Laboratory characterization of the ARGOS laser wavefront sensor, Proc. SPIE 8447,
84476B (2012).
3. L. Busoni et al., Integration and laboratory characterization of the ARGOS laser guide star wavefront sensors, Proc. AO4ELT3 Conference, 92B (2013).
4. L. Busoni et al., Final design of the wavefront sensor unit for ARGOS, the LBT’s LGS facility, Proc. SPIE 7736, 77365K (2010).
5. G. Orban de Xivry, The ARGOS wavefront sensor detector and computer and the black hole growth of narrow-line Seyfert 1 galaxies, Ph.D thesys at Ludwig-Maximilians-Universit¨at M¨unchen (2014).
6. R. Biasi et al., Dedicated flexible electronics for adaptive secondary control, Proc. SPIE 5490, 1502 (2004). 7. C. Schwab et al., Design of an holographic off-axis calibration light source for ARGOS at the LBT, Proc.
AO4ELT Conference E4007S (2010).
8. A. Riccardi et al., The adaptive secondary mirror for the Large Binocular Telescope: optical acceptance test and preliminary on-sky commissioning results, Proc. SPIE 7736, 77362C (2010).
9. S. Esposito et al., Laboratory characterization and performance of the high-order adaptive optics system of the Large Binocular Telescope., Applied Optics, vol. 49, issue 31, pag. G174 (2010).