HAL Id: hal-01761662
https://hal.archives-ouvertes.fr/hal-01761662
Preprint submitted on 9 Apr 2018HAL is a multi-disciplinary open access archive for the deposit and dissemination of sci-entific research documents, whether they are pub-lished or not. The documents may come from teaching and research institutions in France or abroad, or from public or private research centers.
L’archive ouverte pluridisciplinaire HAL, est destinée au dépôt et à la diffusion de documents scientifiques de niveau recherche, publiés ou non, émanant des établissements d’enseignement et de recherche français ou étrangers, des laboratoires publics ou privés.
Asymmetric detrended fluctuation analysis in neonatal
stress
Matej Šapina, Marcin Kośmider, Karolina Kramarić, Matthieu Garcin, Marko
Pirić, Krešimir Milas, Dario Brdarić
To cite this version:
Matej Šapina, Marcin Kośmider, Karolina Kramarić, Matthieu Garcin, Marko Pirić, et al.. Asymmet-ric detrended fluctuation analysis in neonatal stress. 2018. �hal-01761662�
ASYMMETRIC DETRENDED FLUCTUATION ANALYSIS IN NEONATAL STRESS
Matej Šapina1,2,3, Marcin Kośmider4, Karolina Kramarić1,2,3, Matthieu Garcin5, Marko Pirić2, Krešimir Milas1,2, Dario Brdarić6
1
University hospital Osijek, Pediatric Clinic, J. Huttlera 4, 31000 Osijek, Croatia, 2Medical faculty Osijek, Osijek, Cara Hadrijana 10E, 31000 Osijek, Croatia, 3Faculty of Dental medicine and Health, Crkvena 21, 31000 Osijek, Croatia, 4Institute of Physics, University of Zielona Gora, Prof. Szafrana 4a, 65-516 Zielona Gora, Poland, 5LabEx ReFi-Natixis Asset Management, 21 quai d’Austerlitz, 75013 Paris, France, 6Institute of Public Health for the Osijek-Baranya County, Drinska 8, 31000 Osijek, Croatia
Corresponding author: Matej Šapina, MD
J. Huttlera 4, 31000 Osijek, Croatia Phone: 00 385 95 556 78 76 E-mail: [email protected]
ABSTRACT
We aim at detecting stress in newborns by observing heart rate variability. Thanks to an asymmetric detrended fluctuation analysis (ADFA), we determine the fractal structure of the series of interbeat intervals, in which we distinguish the periods of acceleration of the heart rate from decelerations. Thus, two scaling exponents, α+ and α-, representing decelerations, and accelerations, respectively, are obtained. Forty healthy term newborns were included in this study, undergoing two different types of stress stimuli, using routine heel lance blood sampling for metabolic screening purposes and its simulation applying dull pressure on the heel. It appears that, when newborns face stress, the scaling exponent related to accelerations significantly increases and becomes higher than the deceleration scaling exponent. To test the diagnostic properties of the scaling exponents, a ROC curve analysis was applied. α- showed good diagnostic performance with an AUC of 0.826 and 0.796 respectively, although having a lower sensitivity, it showed a high specificity of 84.62% for both stress phases. This work thus stresses the relevance of ADFA and particularly of the acceleration scaling exponent as a diagnostic tool for neonatal stress.
INTRODUCTION
Acute stress is a useful life-saving evolutionary, physiological response, which, when becoming chronic, harms the organism [1]. Being nonspecific stimuli, which change the bodies homeostasis, stressors have significant effects on humans, from the fetal period, until old age [2,3]. Due to the adapting changes in the human body, stressors which do not harm the adult human, can cause a lot of harm on the term, especially, preterm newborn [4,5]. Various physiological responses occur in the newborns after prolonged stress, from cardiovascular, hormonal to epigenetic and neurodevelopmental effects, which may alter normal neurodevelopment [1,5-8]. In the first few days of their life, newborns experience at least one iatrogenic stressful procedure, which becomes even more painful and more invasive, and more often with lower gestational age [9].
The variability of the duration of consecutive cardiac cycles originating in the sinus node is called heart rate variability (HRV). HRV is used not only for research but clinical purposes, using different mathematical and statistical methods [10,11]. Those methods range from time domain and spectral analysis, entropy measures and tools arising from chaos theory such as the correlation dimension, Poincare plots, recurrence plots or Lyapunov exponents [12-20].
Detrended Fluctuation Analysis (DFA)
Detrended Fluctuation Analysis (DFA) is a common method to study long range correlations following the power law in complex time series. The classical version of DFA has been proposed by Peng et. al. in 1995 [21] and since then original and extended versions of the method have been successfully used in the analysis of time series from broad range of fields such as economy, geology, biology, physiology etc. A comprehensive list of articles related to DFA methods can be found on the physionet web site.
The original idea of the DFA method is based on the elimination of the trend from the time series and dividing the data into segments of the length n. Next, for each segment, the fluctuations around the best straight line are calculated. The DFA method gives, as a result, a scaling exponent α representing the correlation properties of the signal. Usually, the following cases are identified [22,23]:
- 0 < α <0.5 - negative correlations, - α = 0.5 - uncorrelated signal, white noise
- 0.5 < α < 1 - positive long-range correlations - α = 1 - 1/f noise, typical for biological systems
- 1 < α <1.5 - positive long-range correlations which do not follow the power law - α = 1.5 - red (Brownian) noise
A detailed description of DFA algorithm can be found in [23].
J. Alvarez-Ramirez et. al [24] modified classical DFA method to study asymmetric scaling behaviors in financial time series. In ADFA (asymmetric detrended fluctuation analysis) two scaling exponents α+ and α- are calculated for segments with rising and falling trends respectively. The ADFA method has been mainly used to study the asymmetric phenomena in financial time series [22,25,26] but recently applications of ADFA algorithm for the study the heart rate asymmetry has been proposed [27,28].
SUBJECTS AND METHODS
Using simple random sampling, forty (21 females and 19 males, birth weight 3542.05±339.09 g) newborns were included in this study. The newborns were only healthy full-term infants, without prenatal and perinatal risk factors, without prior experienced external, iatrogenic stress stimuli. The research was conducted in the maternity ward, prior discharge, with the age of the subjects being 72 hours. As described previously, in [29], the protocol consisted of three parts: a) dummy stimulation phase, b) the heel stick phase, c) the treatment phase. Only phases a) and b) are used in this work, each consisting of two subphases. Phase a) is the first baseline phase which lasted 10 minutes (further named Phase 1), after which intermittent pressure was applied on the newborns heel, mimicking a heel stick procedure (Phase 2), lasting on average 90 seconds. The duration of 90 seconds was chosen, as this is the average time needed for the nurses to collect enough blood by using the heel stick blood sampling procedure. Phase b) begins at the end of Phase 2), which also consists of two sub-phases. The first part (Phase 3) is the secong baseline phase, lasting 10 minutes, and is followed by the actual heel stick blood sampling procedure (Phase 4).
A high resolution device, with a sampling rate of 1024 Hz was used (Firstbeat Bodyguard 2, Firstbeat TechnologiesLtd, Jyvaskyla, Finland). After visual inspection and artifact removal and interpolation, the prepared data were used for analysis. To ensure the quality of the recordings, the standard procedure was done positioning the infants in supine position after breast- or formula feeding.
ADFA algorithm
The ADFA algorithm used in this work can be summarized as follows:
Step 1. We start with the time series { } , …. , where N is the length of the data. From given time series we construct the profile:
= ∑ − ̄ , for = 1,2,3, . . . . ,
where x̄ is the mean of the time series.
Step 2. The original time series and the profile are divided into series of non-overlapping boxes of length n. The length of the boxes span the values between n=5 to n=N/4 [22]. According to the suggestions made by Peng in the C source code dfa.c, the values of n form a geometric time series with ration 2 / [30].
Step 3. For a given box size n, the best linear fit is calculated for all boxes from the original time series. This fit is used only to determine, via slope, the characteristic of the box trend (rising or falling). The same procedure is applied to all boxes of the size n from the profile. The least-square line fit in a j-th profile box is given by:
, = , + " , , for = 1,2,3, . . . . #
This fit is used to detrend the profile data in a j-th box and the fluctuations error is calculated:
$ # =1# % − , &'
for each profile box j=1,2,... .
The fluctuation errors are divided into two categories $( # for boxes with positive slope in the original time series and $) # for boxes with negative slope in the original time series.
Step 4. The average fluctuation functions $( # and $) # are calculated: $( # = * 1 (% $( # &'+ , / and $) # = * 1 )% $) # &'-, /
Where (and ) are numbers of boxes with positive or negative trend respectively. Step 5. Asymmetric scaling exponents .(and .)are defined as follow:
$± # ∼ #1±
The values of scaling exponents are derived from the slope of the linear fit of log($± # with respect to log(n).
STATISTICAL ANALYSIS
The data were analyzed with the R software (version 3.3.2). The normality of the distributions of numerical variables was assessed by the Kolmogorov-Smirnov test. Normally distributed data are descriptively presented with means and standard deviations. Group differences were assessed with a repeated measures ANOVA. The difference of proportion of newborns in each phase, for which α->α+ is tested with a binomial test. A ROC curve analysis was used to test the diagnostic properties of α- and α+. P-values less than 0.05 were considered statistically significant.
RESULTS
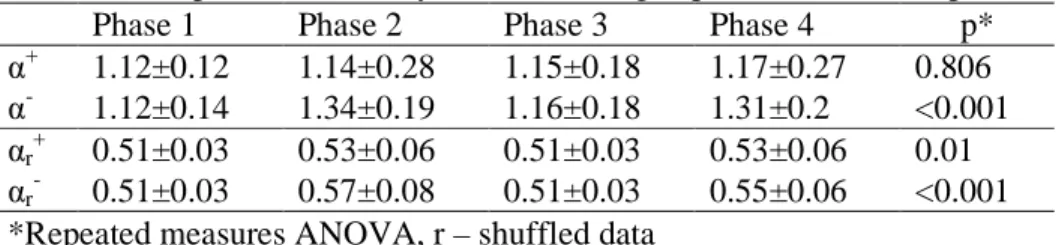
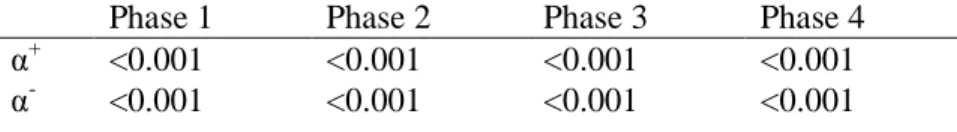
The results of ADFA are presented in the tables and figures. In Table 1. a comparison of .( and .) was made across the phases, both for the obtained signal, and the randomly shuffled data. At baselines (Phase 1 and 3), .( and .) were similar: at phase 1, .( was 1.12±0.12 and .) 1.12±0.14, not significantly differing in phase 3 (.(1.15±0.18, .) 1.16±0.18). Mean levels of .( did not significantly change in the stress phases, but a wider standard deviation was observed (1.14±0.28 in phase 2, and 1.17±0.27). However, .) increased significantly in the stress phases (1.34±0.19 in phase 2, and 1.31±0.2 in phase 4, p<0.001). The mean values of the shuffled data were slightly above 0.5 in all phases, and similarly to the physiological data, increased in a bit in the stress phases, along with a widening of the standard deviations, for .( and .). After statistical analysis comparing the scaling exponents between the physiological and the randomly shuffled data, the obtained p values are presented in Table 2, showing statistically significant differences within every phase of the experiment.
Table 3 contains the comparison of proportions of patients for which .) is greater than .(. Again, significant differences are observed in the stress phases, where, for roughly 70% of newborns, .) was greater than .( (p=0.006 and p=0.017).
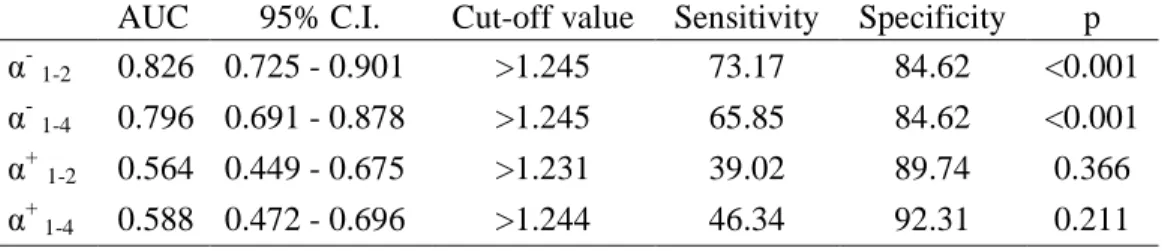
When comparing ROC curves between the first baseline phase and the stress phases, .) showed valuable diagnostic performance with AUC being 0.826 and 0.796, while .( did not significantly differ from randomness (Table 4). Using the same cut off value (>1.245), calculated with the Youden index J for .) in the better performing test (AUC=0.826) the same specificity was obtained (84.62%). The sensitivity varied, for being higher in comparing phases 1 and 2 (73.17%), to phases 1 and 4 (67.85%) (Figure 2., Table 4.).
DISCUSSION
DFA has been already applied in human health and various pathological conditions, covering the entire human age spectrum, from fetal development up to old age [31-34]. DFA is often used to estimate the scaling parameter of a fractional Brownian motion (fBm). This scaling parameter is called Hurst exponent. When, in our work, we estimate a scaling exponent . on the series of RR intervals, it means that the description of this series by the mean of an fBm relies on a Hurst exponent equal to . -1. The analysis of the Hurst exponents of series of RR intervals to detect neonatal stress has already been investigated [29]. The conclusion of the cited work is that the sole Hurst statistic does not provide a satisfying diagnosis tool. However, a refinement of the fBm model, the mean-reverting fractional Lévy-stable motion, in which the Hurst exponent is divided into two components, leads to much more promising results than the standard Hurst analysis. This idea of the limitation of the Hurst exponent, when considered isolated, is confirmed by the crossover phenomenon in HRV analysis, which implies two different scaling rules for low and for high frequencies [23]. In a similar way, this paper does not focus directly on the DFA but on an asymmetric version of it.
However, being a relatively new method, the application of the ADFA remains yet to be discovered. The first application of ADFA was applied to economic time series, where collapses are much more dynamic than recoveries [22,24]. Analogous, RR intervals follow a similar approach. In healthy adults, ADFA has shown asymmetries in the RR intervals time series, where, on average, .) dominates positive ones, both globally and locally [27].
A correlation between ADFA and the autonomic nervous system has been proposed in a way that falling trends could be connected to the sympathetic, and rising trends to the parasympathetic branch of the autonomic nervous system [28,24].
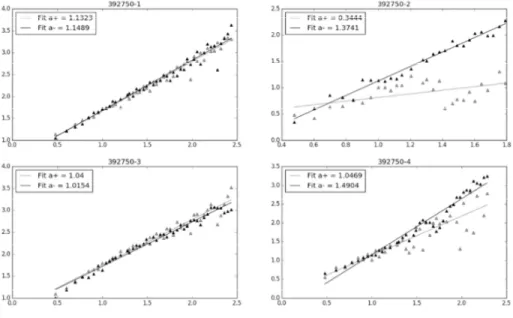
In this study, a much shorter time-series of RR intervals were used for analysis. While resting, the average .( and .) were similar, but significantly different from randomness
(Figure 1.). In contrast, in both stress phase, the average .( is dominated by the .). As it has been discussed previously, the increase of .) in the stress phases might be related to the increase of the sympathetic tone, as a consequence of an acute stress reaction of the neonate to the stimuli, followed by its decrease, when resting. Phases 2 and 4 differ significantly in the type of stress which is applied. In the second phase, continuous stress is applied by pressing the neonates' heel, whereas, in the fourth phase, the stress is caused as a lance prick, followed by a shorter amount of heel pressing. Such might imply that the change in the magnitude of .) might be affected both by the type and duration of the stressor.
Besides showing ADFA in physiological and stress states, another main objective of this study is to validate the diagnostic performance of .) and .(. Comparing both stress phases to the first baseline, .) shows good diagnostic performance with an AUC of 0.826 and 0.796 respectively, whereas .( shows no potential application as a diagnostic marker. A calculated cut-off value of .)>1.245 resulted in a high specificity of 84.62%, whereas the sensitivity was a bit lower.
Again, as previously described, not only being correlated to the sympathetic branch of the autonomic nervous system, but also to accelerations, .) shows great potential in the diagnostics of acute stress in the neonatal population.
CONCLUSION
In conclusion, both the theoretical and practical knowledge and meaning of ADFA are still lacking. In this study, we tried to deepen its understanding, with a focus on acute stress in neonates. The obtained results show a promising application of ADFA by expanding the physiological time-series toolbox in neonates, in which a demarcation on many phenomena is unclear.
REFERENCES
1. Lombroso PJ, Sapolsky R (1998) Development of the cerebral cortex: XII. Stress and brain development: I. Journal of the American academy of child & adolescent psychiatry 37 (12):1337-1339
2. Dellinger EH, Boehm FH, Crane MM (2000) Electronic fetal heart rate monitoring: early neonatal outcomes associated with normal rate, fetal stress, and fetal distress. American Journal of Obstetrics & Gynecology 182 (1):214-220
3. Landau R, Litwin H (2000) The effects of extreme early stress in very old age. Journal of Traumatic Stress 13 (3):473-487
4. Kramarić K, Šapina M, Milas V, Milas K, Dorner S, Varžić D, Šerfezi J, Adelson PD (2017) The effect of ambient noise in the NICU on cerebral oxygenation in preterm neonates on high flow oxygen therapy. Signa vitae 13 (3):52-56
5. Gunnar MR, Hertsgaard L, Larson M, Rigatuso J (1991) Cortisol and behavioral responses to repeated stressors in the human newborn. Developmental Psychobiology 24 (7):487-505 6. Vesoulis ZA, Mathur AM (2017) Cerebral autoregulation, brain injury, and the transitioning premature infant. Frontiers in pediatrics 5:64
7. Gunnar MR, Isensee J, Fust LS (1987) Adrenocortical activity and the Brazelton Neonatal Assessment Scale: Moderating effects of the newborn's biomedical status. Child Development:1448-1458
8. Stone LS, Szyf M (2013) The emerging field of pain epigenetics. Pain 154 (1):1-2
9. Carbajal R, Rousset A, Danan C, Coquery S, Nolent P, Ducrocq S, Saizou C, Lapillonne A, Granier M, Durand P (2008) Epidemiology and treatment of painful procedures in neonates in intensive care units. Jama 300 (1):60-70
10. Acharya UR, Joseph KP, Kannathal N, Lim CM, Suri JS (2006) Heart rate variability: a review. Medical and biological engineering and computing 44 (12):1031-1051
11. Cardiology TFotESo (1996) Heart rate variability, standards of measurement, physiological interpretation, and clinical use. circulation 93:1043-1065
12. Akselrod S, Gordon D, Madwed JB, Snidman N, Shannon D, Cohen R (1985) Hemodynamic regulation: investigation by spectral analysis. American Journal of Physiology-Heart and Circulatory Physiology 249 (4):H867-H875
13. Acharya R, Kannathal N, Sing OW, Ping LY, Chua T (2004) Heart rate analysis in normal subjects of various age groups. Biomedical engineering online 3 (1):24
14. Acharya R, Lim C, Joseph P (2002) Heart rate variability analysis using correlation dimension and detrended fluctuation analysis. ITBM-RBM 23 (6):333-339
15. Bickel DR, Verklan MT, Moon J (1998) Detection of anomalous diffusion using confidence intervals of the scaling exponent with application to preterm neonatal heart rate variability. Physical review E 58 (5):6440
16. Pincus SM (1991) Approximate entropy as a measure of system complexity. Proceedings of the National Academy of Sciences 88 (6):2297-2301
17. Valenza G, Allegrini P, Lanatà A, Scilingo EP (2012) Dominant Lyapunov exponent and approximate entropy in heart rate variability during emotional visual elicitation. Frontiers in neuroengineering 5:3
18. Brennan M, Palaniswami M, Kamen P (2001) Do existing measures of Poincare plot geometry reflect nonlinear features of heart rate variability? IEEE transactions on biomedical engineering 48 (11):1342-1347
19. Mestivier D, Chau NP, Chanudet X, Bauduceau B, Larroque P (1997) Relationship between diabetic autonomic dysfunction and heart rate variability assessed by recurrence plot. American journal of physiology-heart and circulatory physiology 272 (3):H1094-H1099
20. Šapina M, Kramarić K, Milas K, Milas V, Vujčić D, Dobrić H, Pirić M, Brdarić D, Pušeljić S (2017) Poincaré plot indices as a marker for acute pain response in newborns. Signa vitae 13 (4):33-36
21. Peng C-K, Buldyrev SV, Havlin S, Simons M, Stanley HE, Goldberger AL (1994) Mosaic organization of DNA nucleotides. Physical review e 49 (2):1685
22. Rivera-Castro MA, Miranda JG, Cajueiro DO, Andrade RF (2012) Detecting switching points using asymmetric detrended fluctuation analysis. Physica A: Statistical Mechanics and its Applications 391 (1-2):170-179
23. Peng CK, Havlin S, Stanley HE, Goldberger AL (1995) Quantification of scaling exponents and crossover phenomena in nonstationary heartbeat time series. Chaos: An Interdisciplinary Journal of Nonlinear Science 5 (1):82-87
24. Alvarez-Ramirez J, Rodriguez E, Echeverria JC (2009) A DFA approach for assessing asymmetric correlations. Physica A: Statistical Mechanics and its Applications 388 (12):2263-2270
25. Cao G, Cao J, Xu L (2013) Asymmetric multifractal scaling behavior in the Chinese stock market: Based on asymmetric MF-DFA. Physica A: Statistical Mechanics and its Applications 392 (4):797-807
26. Cao G, Cao J, Xu L, He L (2014) Detrended cross-correlation analysis approach for assessing asymmetric multifractal detrended cross-correlations and their application to the Chinese financial market. Physica A: Statistical Mechanics and its Applications 393:460-469 27. Mieszkowski D, Kośmider M, Krauze T, Guzik P, Piskorski J (2016) Asymmetric detrended fluctuation analysis reveals asymmetry in the RR intervals time series. Journal of Applied Mathematics and Computational Mechanics 15 (1):99-106
28. Piskorski J, Kosmider M, Mieszkowski D, Krauze T, Wykretowicz A, Guzik P (2018) Properties of Asymmetric Detrended Fluctuation Analysis in the time series of RR intervals. Physica A: Statistical Mechanics and its Applications 491:347-360
29. Sapina M, Garcin M, Kramaric K, Milas K, Brdaric D, Piric M (2017) The Hurst exponent of heart rate variability in neonatal stress, based on a mean-reverting fractional Lévy stable motion.
30. Goldberger AL, Amaral LA, Glass L, Hausdorff JM, Ivanov PC, Mark RG, Mietus JE, Moody GB, Peng C-K, Stanley HE (2000) Physiobank, physiotoolkit, and physionet. Circulation 101 (23):e215-e220
31. Govindan R, Wilson J, Preißl H, Eswaran H, Campbell J, Lowery C (2007) Detrended fluctuation analysis of short datasets: an application to fetal cardiac data. Physica D: Nonlinear Phenomena 226 (1):23-31
32. Morren G, Lemmerling P, Daniëls H, Naulaers G, Van Huffel S Sensitivity of detrended fluctuation analysis applied to heart rate variability of preterm newborns. In: Engineering in Medicine and Biology Society, 2005. IEEE-EMBS 2005. 27th Annual International Conference of the, 2006. IEEE, pp 319-322
33. Mäkikallio TH, Huikuri HV, Mäkikallio A, Sourander LB, Mitrani RD, Castellanos A, Myerburg RJ (2001) Prediction of sudden cardiac death by fractal analysis of heart rate variability in elderly subjects. Journal of the American College of Cardiology 37 (5):1395-1402
34. Bashan A, Bartsch R, Kantelhardt JW, Havlin S (2008) Comparison of detrending methods for fluctuation analysis. Physica A: Statistical Mechanics and its Applications 387 (21):5080-5090
Tables
Table 1. Comparison of the asymmetric scaling exponents across the phases
Phase 1 Phase 2 Phase 3 Phase 4 p*
α+ 1.12±0.12 1.14±0.28 1.15±0.18 1.17±0.27 0.806
α- 1.12±0.14 1.34±0.19 1.16±0.18 1.31±0.2 <0.001
αr+ 0.51±0.03 0.53±0.06 0.51±0.03 0.53±0.06 0.01
αr- 0.51±0.03 0.57±0.08 0.51±0.03 0.55±0.06 <0.001
Table 2. Pairwise testing p-values between original and shuffled data
Phase 1 Phase 2 Phase 3 Phase 4
α+ <0.001 <0.001 <0.001 <0.001
Table 3. Comparison of proportions of α- > α+ Nα- > α+ (%) No Yes p* Phase 1 17 (42.5) 23 (57.5) 0.430 Phase 2 11 (27.5) 29 (72.5) 0.006 Phase 3 18 (45) 22 (55) 0.636 Phase 4 12 (30) 28 (70) 0.017 *binomial test
Table 4. Comparison of AUC between stress phases and baseline phases
AUC 95% C.I. Cut-off value Sensitivity Specificity p
α-1-2 0.826 0.725 - 0.901 >1.245 73.17 84.62 <0.001
α-1-4 0.796 0.691 - 0.878 >1.245 65.85 84.62 <0.001
α+1-2 0.564 0.449 - 0.675 >1.231 39.02 89.74 0.366
α+ 1-4 0.588 0.472 - 0.696 >1.244 46.34 92.31 0.211
Figures
Figure 1. A visual sample of the obtained scaling exponents through the study phases
Phase 1 – left upper corner, phase 2 – right upper corner, phase 3 – left lower corner, phase 4 – right lower corner, a = α
Figure 2. Comparison of ROC curves between phases 1-2 and 1-4 for α