HAL Id: halshs-00768907
https://halshs.archives-ouvertes.fr/halshs-00768907
Submitted on 26 Dec 2012
HAL is a multi-disciplinary open access archive for the deposit and dissemination of sci-entific research documents, whether they are pub-lished or not. The documents may come from teaching and research institutions in France or abroad, or from public or private research centers.
L’archive ouverte pluridisciplinaire HAL, est destinée au dépôt et à la diffusion de documents scientifiques de niveau recherche, publiés ou non, émanant des établissements d’enseignement et de recherche français ou étrangers, des laboratoires publics ou privés.
Public Support for European Integration : A
comparative analysis
Kristel Jacquier
To cite this version:
Kristel Jacquier. Public Support for European Integration : A comparative analysis. 2012. �halshs-00768907�
Documents de Travail du
Centre d’Economie de la Sorbonne
Public Support for European Integration : A comparative analysis
Kristel JACQUIER
Public Support for European Integration:
A comparative analysis
Kristel JACQUIER
December, 2012 Abstract:
This paper proposes to study how socio-economic characteristics shape preferences in European matters. It is assumed that social groups threatened by liberalization tend to be more euro-skeptical than others. This hypothesis is tested using individual-level data from two rounds of the European Social Survey. Controlling for national fixed effects and income, we focus on variables of occupational status (International Standard Classification of Occupations ISCO-88, and current occupation). Finally, we include a variable of subjective partisan affiliation to make sure that our results are not concealing a left/right positioning. We argue that the economic status of agents plays a crucial role in explaining cross-sectional variations in public support for the European process in each member state. Additionally, the partisan affiliation confirms that in European matters, socio-economic forces are not a mere reflection of the left/right spectrum.
Soutien à l'intégration européenne: une analyse comparative
Résumé:Le présent article propose une étude des déterminants socio-économiques du soutien à l'intégration européenne. A l'aide des données Enquêtes Sociales Européennes, nous testons l'hypothèse selon laquelle les groupes sociaux qui craignent les effets de la libéralisation auront également tendance à être méfiants vis-à-vis de l'intégration européenne. Nous nous focalisons sur les variables d'emploi (CSP, statut d'emploi actuel, syndicalisation) en contrôlant par le revenu et le pays d'origine. Une variable de positionnement subjectif sur l'échelle gauche/droite est introduite afin de s'assurer que nos résultats ne dissimulent pas une affiliation partisane. Les résultats obtenus prouvent que le statut économique des agents est une variable déterminante pour expliquer les préférences des européens et souligne l'importance de l'intégration européenne comme dimension politique.
Keywords: European integration, political economy, globalization, survey research.
Mots clés : Intégration européenne, économie politique, mondialisation, données d'enquêtes. JEL Classification: P16, F55, C25
________________________________
Kristel JACQUIER
Université Paris 1 – Maison des Sciences Economiques, 106-112 Boulevard de l’Hôpital, 75647 Paris cedex 13, France
1 Introduction
A vast literature in political science has attempted to identify the main deterrents of public support for the European Union. This goes from economic benefits at the macro or micro level (Eichenberg and Dalton, 1993 ; Anderson and Kaltenthaler, 1996 ; Gabel and Palmer, 1995) to purely cultural factors (McLaren, 2002 ; Diez Medrano, 2003) or contextual variables (Brinegar and Jolly, 2005 ; Sánchez-Cuenca, Ignacio, 2000). The question has never been settled; therefore it is reasonable to think that several influences work together. As a contribution to the existing literature, this paper proposes to study how socio-economic characteristics shape preferences in European matters. Using individual-level data from two rounds of the European Social Survey, a cross-country analysis is conducted on two samples: the fifteen original EU members, and post communist countries.
In international economic relations, integration is defined as « the gradual elimination of economic frontiers between independent states. As a result the economies of these states end up functioning as one entity » (W.Molle, 2006). This theoretical framework makes clear that European integration is an on-going process.
During the 1950s and the 1960s, a permissive consensus (Lindberg and Scheingold 1970) existed in Europe. A large majority of citizens displayed a tacit support for the European process. Because of such public disinterest, political elites have been able to pursue their own policy interests. After the signing of the Single European Act (SEA) in 1986, citizen support for European integration started to rise and reached a peak in 1991. By then the European integration was considered a purely economic arrangement that brought about macro-economic stability and -to some extent- prosperity.
In the aftermath of the Maastricht Treaty, public opinion was confronted to a more complex situation. The political jurisdictions of the European Union (EU) were extended; the Union now had a word to say in social policy, environmental and defense matters. The year 1992 witnessed a sharp drop in public support. Since then, public opinion on European membership has stabilized to a sizeable minority of supporters (the rest being hostile or indifferent1). In the present day, further integration of the Union boils down to reinforcing constraints. As for development plans, the European Council focuses mainly on deepening competition and
1
liberalization, and calls for structural reforms (see Amable et al.,2009 about the Lisbon strategy). The free market is constantly re-enforced while social objectives are relegated to the background (Amable et al.,2012).
In this study, we focus on two motives of distrust towards the EU: the economic liberalization process and the loss of sovereignty (Beckfield 2009, 2006; Kvist and Saari, 2007; de Vries and Kersbergen 2007). It can be argued that the political agenda of the Union has become more and more detrimental to the low skilled workers on the labor market2, which leads them to be decreasingly supportive of further integration. Adopting a political economy viewpoint we focus on the distributive consequences of European integration.
The paper is organized as follows. Section 2 presents the literature. In Section 3, we describe the methodology. Section 4 exposes the empirical results and section 5 concludes the analysis.
2 Literature
"Citizens are at the core of the European construction: the Union has the imperative to respond concretely to their needs and concerns", as evidenced by this declaration of The European Council in 1996, further integration requires a strong political support. Thus analysts (especially political scientists) attempt to identify what are the main deterrents of public support for the European Union (Keohane and Hoffmann, 1990).
Several studies make the case that citizens evaluate the EU based on macroeconomic performances (Eichenberg and Dalton, 1993; Anderson and Reichert, 1995; Gabel and Palmer, 1995). This is far from surprising since the founders of the European Union justified the integration in terms of welfare gains from trade. The economic performances are still essential today through the ability of the Union to provide price stability. Nevertheless the explanatory power of macro-economic predictors have largely decreased over time, and will not be considered in the present analysis.
2
In France for example, the European Constitution was rejected by referendum in 2005 because a large part of the French electorate feared the Constitution would enforce a neoliberal economic model
Another field of research focuses on micro economic calculations. Gabel (1998) models the personal potential to gain from trade liberalization. He measures the relative competitiveness of individuals based on their occupation. And so does the present article. Bruno Cautrès and Gérard Grunberg (2007) also emphasize an “elitist bias", they demonstrated that more educated and higher-income individuals are more in favor of European integration.
As previously introduced, the signing of the Maastricht Treaty coincides with the drop in Public Support for the EU. Eichenberg and Dalton (2007) argue in favor of a causal relationship and document it. Before Maastricht, the Union was limited to economic purposes. The treaty expands the number of policy areas for which the EU has some responsibility and strengthens the powers of the European Parliament. It is a political shift. They consider Maastricht as a "system transforming event that dramatically altered the nature of the integration process". The authors emphasize that many citizens want to preserve their national arrangements, notably social protection. Indeed Eurobarometer data show that the higher the social expenses, the least citizens support EU action on health and social security. They also insist on the influence of the Economic and Monetary Union (EMU) and its budgetary implications. Citizens dependent on state generosity could fear further integration. They argue that, since Maastricht, the politics of European integration are animated by distributive concerns. The present study is in line with this view. Indeed, even though total income inequality in the EU has declined, within-country income inequalities have increased (Beckfield 20093), suggests that there are winners and losers of further regional integration. Beckfield (2006) provides three arguments to explain why regional integration (both economic and political) should raise income inequality: workers are exposed to international competition, labor unions are weakened and market-oriented EU polities should drive welfare state retrenchment. Kvist and Saari, (2007) precisely investigate the constraining effect of European integration on national welfare states (notably through the EMU). We use the political allegiance argument to assume that support for Europe is low when citizens see the EU as preventing their national regimes from providing the expected level of social protection (de Vries and Kersbergen 2007, 313).
Labor market or social protection policies are at the very root of socio-political compromises that funded post-war European economies. The convergence towards the median redistribution level in Europe would unsettle institutional arrangements. According to Hall and
3
Soskice varieties of capitalism (2001), in liberal market economies (LMEs) more redistribution would cause a raise in taxation and job losses, whereas in coordinated market economies (CMEs) less redistribution would decrease job protection, and lessen investment in specific skills (Iversen and Soskice, 2001). As a result European integration might be destabilizing within both types of capitalism.
A more recent field of research focus on contextual variables and especially how national variables can reinforce or mitigate the impact of previously cited determinants. Brinegar and Jolly (2005) intend to comprehend what they call the "socio-tropic evaluations of the effects of European integration on national capitalism". In their study, the skill level is taken into account through the frame of national factor endowments and varieties of capitalism. They follow Scheve (2000) and use the Heckscher–Ohlin model of factor endowment to predict that in countries relatively well endowed with skilled workers, skilled workers should support integration while less-skilled workers should oppose it. Scheve (2000), focus on the degree of wage bargaining centralization. He argues that centralized wage bargaining tends to reduce wage inequality. Thus the distributive consequences of integration are mitigated and individuals are less threatened by European Integration.
Finally, we use the cleavage theory (Lipset and Rokkan, 1967) in order to draw a multidimensional analysis (both cross national and cross sectional variations are taken into account). This theory distinguishes two types of cleavages. The national level that results from the country economic context (i.e. historical and cultural factors mainly) and the socioeconomic level: social divides, class conflicts or some new subdivisions (post-materialism4, age, education or access to information). According to Inglehart, post-materialist people should support Europeanization. Such an hypothesis won't be tested here because of the lack of empirical validation in previous studies (Janssen, 1991; Gabel, 1998a). Furthermore the decline in left/right partisanship announced by post-materialists has no empirical foundation (Amable 2007). J.Janssen (1991) and Anderson and Reichert (1996) both criticize the idea that the nation state represents materialist value. Following Anderson and Reichert (1996) we assume that the European Union is a purely economic enterprise. The nation state tends to consider non-economic goals when the European Union does not.
4
The idea was introduced by R.Inglehart in 1971. The theory of modernization argues that, social development and economic prosperity drives political changes in advanced economies. These political changes correspond to the rise of post-materialism values among individuals. Materialist values are security, fight against inflation; whereas post-materialist values are
All of the studies previously mentioned focus on western Europe, the preferences of post-communist countries are far less documented. In a study of five transitional countries (Czech Republic, Estonia, Hungary, Poland, and Slovenia) Cichowski (2000) emphasizes three main determinants of public support for EU membership: satisfaction with democracy, promotion of free market and party cues. Tucker, et al. (2002) confirms that free market supporters welcome European integration. They also use individuals' self-assessments of economic progress to ascribe "winner" and "loser" statuses, and regard it as the best predictor of support for EU membership.
3 Empirical strategy
3.1 Data
The analysis is based on the European Social Survey (ESS) dataset. The program was launched by the European Science Foundation (ESF) and designed to compare social attitudes and values across European countries. We focus on the last two rounds of the cross-sectional survey: ESS3 (2006) and ESS4 (2008), merged together into one dataset. The ESS provides a large data sample (at least 1,500 respondents per country) and employs the most rigorous methodologies. Kohler (2007) describes the ESS as the most reliable data for international comparisons. We use the question survey below as a proxy to measure public support for the European Union:
“Now thinking about the European Union, some say European unification* should go further. Others say it has already gone too far. Using this card, what number on the scale best describes your position?”
Unification Unification
has already should go (Don’t gone too far further know) 00 01 02 03 04 05 06 07 08 09 10 88
* “Unification” refers to further integration rather than further enlargement
Even though the scale is not a straightforward response, we expect the respondents who support further integration to give a number between 7 and 10, and those reluctant to the EU to answer under 4. That’s why we reduced the variable to three ordinal categories.
Using such dependent variable it is assumed that further integration reveals support for the political agenda of the Union when the survey was made. I argue that some individuals might consider unification of Europe as a positive step but are dissatisfied with the course of negative integration5 (Scharpf, 1999).
Two groups were defined in order to capture national characteristics6. The EU 15 states (the members of the EU prior to the eastern enlargements in 2004 and 2007) the new member states (also called post-communist countries). Among the EU 15 states, the study encompasses Germany, Austria, Belgium, Denmark, Spain, Finland, France, Great Britain, Greece, Ireland, The Netherlands, Portugal and Sweden. As far as post communist countries (2004 enlargement and afterwards) are concerned, Bulgaria, Czech Republic, Hungary, Estonia, Latvia, Poland, Romania, Slovenia and Slovakia are included. The appendix provides descriptive statistics.
3.2 Econometric specification
Because the dependent variable of the model encompasses discrete choices that can be ordered we run an ordered logit regression. As we have seen in the previous section, the eleven original categories (from 0 to 10) were re-coded to three.
The estimated equation can be defined as:
*
D
+ C
i i i i i i
y
,, , and are parameters to be estimated and *i
y is the latent variable, i.e. the intensity of the support for the European integration. D is a vector of individual socio-demographic characteristics (age and gender). E measures the socioeconomic position of individuals (ISCO classification, employment status and employment relation). C is a country dummy which accounts for any omitted country-specific influence. P stands for partisanship and
is the error term.
We do not observe *
i
y , but a variable yi that goes from 0 to 10 and rises when public support for the European Union rises:
5
Deregulation of national norms rather than new institutions or programs
6 A pooled regression was carried and provides evidence that our main assumptions hold. We choose to create two group of
countries to obtain more details on each group and because the literature usually do not include eastern Europe. In addition, separating the countries in two groups allows to reduce the extent of country fixed effects
if j1 yi*j
For Where are thresholds, with j and
Only the sign and the significance of the coefficient can be interpreted (King et al., 2000). To facilitate the interpretation of the results, odd ratios are provided instead of coefficients. Odd ratios allow to compare dummy variables in a meaningful way (within the same regression, the magnitude of coefficients is comparable). For example, an odd ratio of 0.5 for the dummy variable "female" means that, holding all other variables constant, the odds of having more negative attitudes toward European integration are half as large for women as for men.
3.3 Assumptions
Citizens consider (or experience) distinct benefits from the European Union membership. As mentioned before, two motives of distrust towards the EU can be suggested: the economic liberalization process and the loss of sovereignty.
Firstly, we intend to show that social groups reluctant to further European integration are the same who traditionally fear trade liberalization, i.e. manual workers. International trade models have documented the distributive consequences of trade and individual attitudes towards trade (see Rodrik (1995) for a review of the literature). Most of the studies are based on the factor endowments model (a combination of the Heckscher-Ohlin model and Stolper-Samuelson theorem), and predict that trade liberalization benefits individuals who own the factors with which the economy is relatively well endowed and hurts the others (Rodrik and Mayda 2005). Scheve and Slaughter (2000) find that in the United-States a two-factor model is a powerful predictor of public opinion about trade.
The second motive is linked to the EMU. Its implementation exacerbated worries about European issues. From then on, not only was the European Central Bank delegated the sole authority to conduct monetary policy, budgetary policy would be constrained by the Stability and Growth Pact. Thus countries which adopted the EMU have to bear constraints on both monetary and budgetary policies. And for the others, “more integration” might stand for the adoption of the common currency; so citizens who fear a loss of sovereignty are unlikely to call for more European integration.
Considering those issues, it is reasonable to expect less competitive citizens to fear both a cut in government spending and a surge in labor market flexibility.
Following Gabel (1998) we expect support for the EU to be positively correlated with an individual's level of human capital. Income is used as a proxy of such competitiveness. We also use the International Labor Classification (ISCO-88) as it reflects the education level of individuals. The nine groups are the following: Manager, Professional, Associate professional, Clerk, Service worker, Agricultural worker, Craftsman, Machine operator, and Elementary worker. Opportunities exist for those skilled enough to compete in the European market so we expect the manual laborers to be less supportive of the European integration. In the end we test whether social groups threatened by liberalization tend to be more euro-skeptical.
Then we focus on particular statuses: being unemployed, self-employed, or part of a trade union. We expect the unemployed to be hostile to liberalization as they rely on social transfers. However, Esping-Andersen (1999) emphasize that some outsiders are interested in economic policies that maximize their likelihood of finding a job. Some unemployed people might picture the EU as a land of opportunity. We intend to figure out whether or not unemployed people express distinct preferences from the other respondents. On the opposite self employed should welcome a liberal market and low levels of social transfers (Iversen and Soskice, 2001; Guillaud, 2011). We use a three-category variable to assess whether or not the employment relation has an impact on European preferences: wage earners are the reference category and the others are self employed and employed in a family business. Using a dummy variable we test trade union membership. Trade union members are supposed to be more informed about the risks of liberalization for low-skilled workers and should be opposed to it.
Finally, a variable of subjective partisanship is included. We do not have any strong prior expectations regarding the effects of such variable; we use it as a control. Socioeconomic characteristics determine partisanship (Gabel, 1998) so we want to make sure that the previous results are not concealing a left/right positioning.
Some usual controls are included: gender, age, country dummies. A dummy for the round of the European Social Survey is added in order to make sure that the fusion of rounds 3 and 4 does not bias the estimators. The education level is not presented here because the ISCO classification already provides such information. However we run the estimates with the education level instead of the ISCO variable and we find the same result as in the literature: The more educated individuals are, the more they favor European integration (with a few exceptions among new member states, like Bulgaria for example).
The main assumptions hold for post-communist countries (the literature suggests that in those countries, the most successful individuals promote EU membership. Tucker, et al. (2002) evaluate winners and losers thanks to a self-assessment variable while socio economic characteristics are used here). However it is useful to separate the two groups so as to capture specific traits. There are good reasons to believe that the variables take on a different meaning in new member states, and that some variables stand out more sharply. First the factor endowment model predicts that individuals whose factor is abundant welcome liberalization while scarce factors oppose it, and it appears to us that the skill endowment in eastern Europe is different from western countries. Secondly we expect the partisanship variable to work differently. Indeed euro skeptical political parties are nationalist parties in both western and eastern countries, but in eastern Europe they are traditionally close to the communist party. Consequently, euro skeptical individuals in post-communist countries are likely to self-position to the very left of a left-right scale.
4 Estimation results
4.1 Cross-sectional analysis
To facilitate the interpretation of the results, odd ratios are provided instead of categorical variable estimates. Table 1 and 2 display the results. Column [1] corresponds to the model without partisanship, column [2] involves the same variables but partisanship is included. The estimates confirm that pro-EU preferences are significantly and robustly correlated with an individual's level of human capital.
First we observe that the wealthier the individuals claim to be, the more they support further European integration in both samples (the former and new member states). This is all the more interesting that we control for the education level. The lowest incomes are notably reluctant to the EU, their odds of having more positive attitudes toward European integration are 29 per cent smaller than our reference category ("Coping on present income") for post-communist member states, and 24 per cent for the original member states.
Among the former member states, the gap from one ISCO category to the other is wide, the likelihood to support European integration is 0.55 (45 per cent) inferior for elementary workers compared to professionals. The gaps are much less pronounced among eastern member states (a 22 per cent drop in the support for elementary workers compared to professionals). The issue is addressed in the next section.
Unemployed people do not stand out as a distinct category compared to paid workers; this might be due to heterogeneity among the individuals in the group. In table 1 (the EU 15 states), the estimates also point out that people in education strongly support integration compared to paid workers (the support goes up by 46 per cent). The employment relation does not predict preferences of individuals in European matters.
Data on union membership are missing for Romania and Latvia, consequently the variable was excluded. However tested on the other new member states, union membership is insignificant. Concerning the original fifteen member states, union membership is significant at 10 per cent and as predicted, unionized workers are less supportive of further integration than their non-unionized counterparts (by 4%).
Finally, comparing column [1] and [2] confirms that socioeconomic characteristics do not operate through a left/right positioning. The inclusion of the variable does not distort the previous results: the variables remain significant and the coefficients remain globally unchanged. The present analysis weights in favor of the emergence of a new political cleavage around European integration (Kriesi et al, 2008).
4.2 Cross-national analysis
Two groups were isolated in the study in order to capture national characteristics. The factor endowment model predicts that individuals whose factor is abundant welcome liberalization while scarce factors oppose it. But in countries without a comparative advantage in skill-intensive sectors, the skills-preference link should be attenuated, or even reversed (Scheve, 2000). In line with this assumption skilled workers in the former member states strongly support integration compared to unskilled workers while the situation is attenuated in post-communist states. We notice for example that the support of machine operators is only 16 per cent less than professionals in those countries while the support drop by 52 per cent (the odd ratio is 0, 48) in the fifteen former member states.
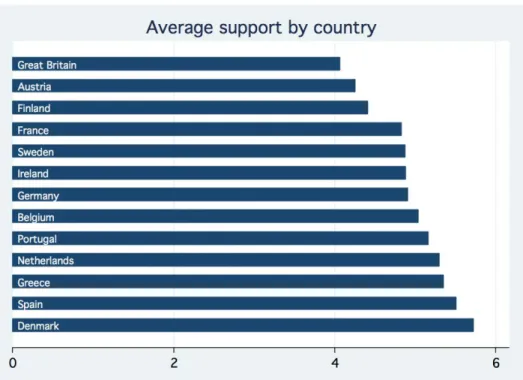
Cross national differences also seem to reflect the country education level. Skilled individuals in coordinated market economies (where the education system invests on specific skills) are thus expected to be less supportive of integration than their counterpart in countries with more general education systems (Brinegar and Jolly, 2005). Indeed country dummies reveal that countries where, ceteris paribus, negative attitudes towards European integration are most widespread are Austria, Finland and Sweden. In the end, estimates demonstrate not only that cross national variations are considerable but also that individual skills may work differently in different institutional contexts.
In line with our assumptions, right wing parties are strong supporters of further integration. As mentioned above, nationalist parties are close to the communist party in eastern Europe7. Euro-skeptical political factions are far left individuals while right wing parties are expected to support market liberalization.
In order to complement the cross national analysis, separated country estimates are run. Table 3 presents the results in four major countries: France, Germany, Great Britain and Sweden. They confirm our findings and some national characteristics stand out.
In the case of Sweden the baseline model is highly relevant. First, occupational variations are marked. Secondly self employment is significantly and positively correlated with public support (41 per cent superior from wage earners) while union members are 27 per cent less supportive of the European Union. The lowest income categories do not significantly differ from the reference category (“coping on present income”), however the highest income display a strong support for further integration. The same can be said about France where medium and low incomes have similar preferences, but very high incomes heavily support European integration.
The opposite can be observed in Great Britain, where only the last income category is negatively correlated with the support. High income individuals do not support the European Union. There are two straightforward reasons: first euro skepticism is widespread in Great Britain, regardless of the socioeconomic background, secondly the level of redistribution is higher in the rest of Europe so rich people might fear convergence towards the other countries. The distrust among poor British respondents is consistent with the variety of capitalism hypothesis that citizens in LMEs fear a raise in taxation and job losses. Indeed, unemployment in Great Britain is historically lower than the European average. Poor workers do not want more
7
taxes or lose their jobs. However it has to be noticed that unemployed people in Great Britain are 37 per cent more supportive of the EU than paid workers (significant at 0.1). It appears that people who do not have a job might support a raise in unemployment benefits.
5 Concluding remarks
Using individual-level data from two rounds of the European Social Survey, a cross-country analysis was conducted on two samples: the fifteen original member states, and the post communist member states. We argued that the European political agenda promotes liberalization and budgetary constraints which leads the less competitive citizens to dread a surge in labor market flexibility and cuts in government spending.
The estimates are consistent with the literature. They tend to prove that social groups reluctant to further European integration are the same who traditionally fear liberalization, i.e. manual workers. Conversely, managers and professionals promote integration in both samples. Even though occupational clusters are taken into account, the highest income categories remain significantly more in favor of the European process than medium or low income ones. Unemployed people do not have distinct preference from workers in our analysis. Union membership is significant and as predicted, unionized workers are less supportive of further integration than their non-unionized counterparts. Respondents in education were heavily supportive of the European Union in both samples.
We focused on cross national variation comparing former member states to new ones. We found that in countries without a comparative advantage in skill-intensive sectors, the skills-preference link is attenuated. Indeed the distributive consequences of European integration are distinct from one institutional setting to another.
In former member states it sounds clear that since the Maastricht treaty was signed, European integration plays a crucial role in shaping national political preferences8. The economic policies implemented by the European Union (notably budgetary orthodoxy or
8
liberalization policies) are unlikely to favor manual workers or people dependent on state generosity. Social democratic countries like Sweden best illustrate theses social divides. The distributive consequences of European integration appear to us as an important aspect to consider for European policy makers. The loss of sovereignty is a burning issue when European authorities decide to adopt the Treaty on Stability, Coordination and Governance in the Economic and Monetary Union to overcome the sovereign-debt crisis.
It has to be noted that when European issues are concerned, preferences are not aligned to traditional partisanship, or well-known dimensions such as economic or cultural drivers. Although changes in party system have not occurred until now, European integration appears increasing like a political cleavage.
The study emphasizes that the preferences of managers across Europe are similar while preferences of managers and manual workers within the same country are distinct, indicating that transnational dimensions are strong. Nevertheless, some social groups stand out more or less sharply from one country to another. Indeed, we argue that European citizens perceive the European Union in a roughly similar manner; but integration has different implications depending on the institutional characteristics of the country of residence. As an example, for British people European integration might stand for more redistribution, whereas Swedish people expect the opposite from the EU. Identifying this contextual preference formation is an important tasks for future research.
References
[1] Amable, B., Demmou, L. and Ledezma, I. (2009) The Lisbon strategy and structural reforms in Europe, Transfer: European Review of Labor and Research 15(1): 33-52.
[2] Amable, B., Guillaud, E. and Palombarini, S. (2012) Changing French Capitalism: Political and Systemic Crises in France, Journal of European Public Policy, Vol. 19(8), 1168-1187
[3] Amable B. (2007). La fin du modèle européen ? Revue d’Economie Politique, vol. 117 No. 4, pp.551-575.
[4] Anderson, Christopher, & Karl Kaltenthaler (1996). The Dynamics of Public Opinion toward European Integration, 1973-1993. European Journal of International Relations 2:175-99.
[5] Anderson, C. J. & Reichert, M. S. (1995). Economic Benefits and Support for Membership in the E.U.: A Cross-National Analysis. Journal of Public Policy vol.15 no.3 (September-December 1996): 231-249.
[6] Beaudonnet, L (2011). Misconstruing the European project? How welfare issues colour attitudes towards Europe. in: Susan Banducci, Mark Franklin, Heiko Giebler, Sara Hobolt, Michael Marsh, Wouter van derBrug and Cees van der Eijk (eds) An Audit of Democracy in the
European Union, EUDO E-Book, Florence,2011.
[7] Beaudonnet, L (2012). You Don't bite the Hand that feeds you: The Impact Of Redistribution On Attitudes Towards Europe. CSD Working Papers, Center for the Study of Democracy, UC Irvine.
[8] Beckfield J (2006) European integration and income inequality. American Sociological
Review 71: 964-85
[9] Beckfield J (2009) Remapping Inequality in Europe: The Net Effect of Regional integration on Total Income Inequality in the European Union. International Journal of Comparative
Sociology 50(5-6): 486-509.
[10] Belot Céline (2002) Les logiques sociologiques de soutien au processus d'intégration Européenne : éléments d'interprétation, Revue internationale de politique comparée, 2002/1 Vol. 9, p. 11-29. DOI : 10.3917/ripc.091.0011
[11] Brinegar, A., Jolly S. (2005). Location, Location, Location: National Contextual Factors and Public Support for European Integration. European Union Politics 6(2): 155–80.
[12] Cautrès B. & Grunberg G. (2007) Position sociale, identité national et attitude à l’égard de l’Europe. La construction européenne souffre-t-elle d’un biais élitiste ? dans Olivier Costa, Paul Magnette (dir.), Une Europe des élites ? Réflexions sur la fracture démocratique de l’Union européenne, éd. de l’Université de Bruxelles, pp. 11-34
[13] Cichowshi, Rachel A. (2000). Western dreams, Eastern realities: Support for the European Union in Central and Eastern Europe. Comparative Political Studies 33: 1243-1278
[14] Diez Medrano, J. (2003). Framing Europe: Attitudes to European Integration in Germany, Spain, and the United Kingdom. Princeton, NJ: Princeton University Press.
[15] Eichenberg, R. C. & Dalton. R. J. (1993). Europeans and the European Community: The Dynamics of Public Support for European Integration. International Organization vol.47 no.4 (Autumn 1993): 507-534.
[16] Eichenberg, R. C. & Dalton. R. J. (2007). Post-Maastricht Blues: The Transformation of Citizen Support for European Integration, 1973–2004. Acta Politica, 8 (2007), 128–52
[17] Ehin, P. (2001). Determinants of Public Support for EU Membership: Data from the Baltic Countries. European Journal of Political Research 40(1): 31–56.
[18] European Council (1996) ‘Presidency Conclusions, Turin, 29 March
[19] Gabel, M. J. (1998a). Interests and Integration: Market Liberalization, Public Opinion, and European Union, Ann Arbor: University of Michigan Press.
[20] Gabel, M. J. (1998b). Economic Integration and Mass Politics: Market Liberalization and Public Attitudes in the European Union. American Journal of Political Science vol.42 no.3 (July 1998): 936-953.
[21] Gabel, M. J. (1998c). Public Support for European Integration: An Empirical Test of Five Theories. Journal of Politics vol.60 no.2 (May 1998): 333-354.
[22] Gabel, M., & Palmer, H.D. (1995). Understanding Variation in Public Support for European Integration. European Journal of Political Research 27(1): 3-19.
[23] Giddens, A. (1994) Beyond Left and Right, Cambridge: Polity Press.
[24] Grunberg, G. and Schweisguth, E. (1997) Vers une tripartition de l'espace politique in D. Boy and N.Mayer (eds), L'électeur a raison, Paris: Presse de Sciences-Po, pp.179-218.
[25] Guillaud E. & Palombarini S. (2006) Evolution des attentes sociales et comportement électoral : France, 1978-2002, document de travail PSE no 2006-37
[26] Guillaud, E. (2011) Preferences for redistribution: an empirical analysis over 33 countries,
Journal of Economic Inequality (forthcoming)
[27] Hall P., Soskice D. (eds) (2001). Varieties of Capitalism : The Institutional Foundations of Comparative Advantage, Oxford, Oxford University Press
[28] Hooghe, L., & Marks G. (2005). Calculation, Community, and Cues. Public Opinion on European Integration. European Union Politics 6 (4): 419-443.
[29] Hurrelmann, A. (2007). ‘European Democracy, the “Permissive Consensus” and the Collapse of the EU Constitution’. European Law Journal, Vol. 13, No. 3, pp. 349–59.
[30] Hix, S. (1999). The political system of the European Union. Deuxième édition. p147-174 London: Macmillan
[31] Inglehart, R. (1977). The Silent Revolution. Princeton: Princeton University Press.
[32] Iversen, T. & Soskice D. (2001). An Asset Theory of Social Policy Preferences. American
Political Science Review 95(4): 875–94.
[33] Janssen, J. H. (1991). Postmaterialism, Cognitive Mobilization, and Support for European Integration. British Journal of Political Science vol.21 no.4 (October 1991): 443-468.
[34] Keohane, R. & Hoffmann S. (1990). Conclusion: Community politics and institutional change. In W. Wallace (ed.), The Dynamics of European Integration London: Pinter.
[35] King, G., Tomz M., & Wittenberg J. (2000). Making the Most of Statistical Analyses: Improving Interpretation and Presentation, American Journal of Political Science, 44(2): 347-361
[36] Kohler, U. (2007) Surveys from Inside: An Assessment of Unit Nonresponse Bias with Internal Criteria. Survey Research Methods 1(2):55–67.
[37] Kriesi H, Grande E, Lachat R, Dolezal M, Bornschier S, Frey T (2008) West European Politics in the Age of Globalization: Cambridge University Press.
[38] Kvist, J & Saari, J (2007) The Europeanisation of social protection. Bristol: Policy Press [39] Lindberg, L. & Scheingold S. (1970) Europe's Would-Be Polity. Englewood Cliffs, NJ: Prentice Hall.
[40] Lipset S.M. & Rokkan S. (1967) Cleavage Structures, Party Systems and Voter Alignments: An Introduction, Lipset S.M. et Rokkan S. (eds.), Party Systems and Voter Alignments. Cross
National Perspectives, The Free Press, New-York, 1967, p. 35.
[41] Long J. S. & Freese J. (2006). Regression Models for Categorical Dependent Variables using Stata, 2nd Edition. Stata Press books, StataCorp LP.
[42] Mayda, A. M. & Rodrik D. (2002). Why Are Some People (and Countries) More Protectionist Than Others?, European Economic Review 49 (2005) 1393-1430
[43] McKelvey, R., and Zavoina, W. (1975). A Statistical Model for the Analysis of Ordinal Level Dependent Variables, Journal of Mathematical Sociology 4, pp. 103-120.
[44] McLaren, L. (2002). Public support for European integration: cost/benefit analysis or perceived cultural threat? The Journal of Politics 64: 551–566.
[45] Molle, W (2006). The Economics of European Integration: Theory, Practice, Policy. Ashgate.
[46] Rodrik, D., (1995). Political economy of trade policy. In: Grossman, G., RogoD, K. (Eds.), Handbook of International Economics, Vol. 3. Elsevier Science Publishers, Amsterdam, pp. 1457–1494
[47] Rogowski, R. (1989). Commerce and Coalitions. Princeton, NJ: Princeton University Press. [48] Sánchez-Cuenca, I. (2000). The Political Bases of Support for European Integration.
European Union Politics 1(2): 147–71.
[49] Scheve, K. (2000). Comparative Context and Public Preferences over Regional Economic Integration, Annual Meeting of the American Political Science Association, Washington, DC. [50] Scheve, Kenneth F., and Matthew J.Slaughter (2000) What determines individual trade-policy preferences. Journal of International Economics
[51] Tucker, Josh A., Pacek, Alexander C. and Berinsky, Adam J. (2002) Transitional Winners and Losers: Attitudes toward EU membership in Post-Communist Countries, American Journal
of Political Science, 46(3): 557–571,
[52] Van Ingelgom V. (2012) Integrating Indifference. A comparative, qualitative and quantitative approach to the legitimacy of European integration, ECPR Press Monographs Series (ECPR Jean Blondel PhD Prize), forthcoming.
[53] Vries, C de, Kersbergen, van K. (2007) Interests, identity and political allegiance in the European Union. ActaPolitica 42(2-3): 307-28.
[54] Williams, R.(2006). Generalized Ordered Logit/ Partial Proportional Odds Models for Ordinal Dependent Variables. The Stata Journal 6(1):58-82.
Appendices
Descriptive statistics
Figure 1- EU 15 states: Average support by country
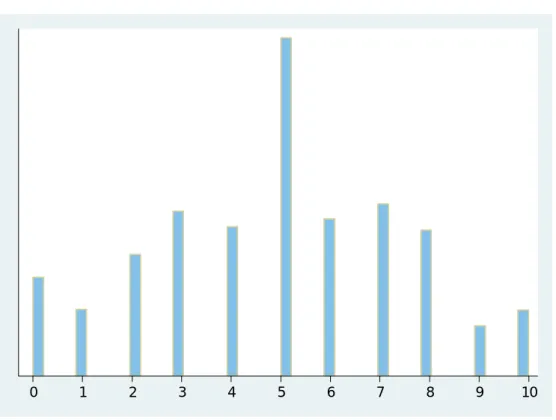
Figure 3- UE 15 states: Main survey question (frequency)
0 1 2 3 4 5 6 7 8 9 10
Figure 4- Post-communist countries: Main survey question (frequency)
0 2 4 6 8 10
Note: The polarization at 5 can be interpreted as a status quo bias or, as suggested by Van Ingelgom (2012), when the permissive consensus ended, a lot of individuals who used to support the European process became indifferent.
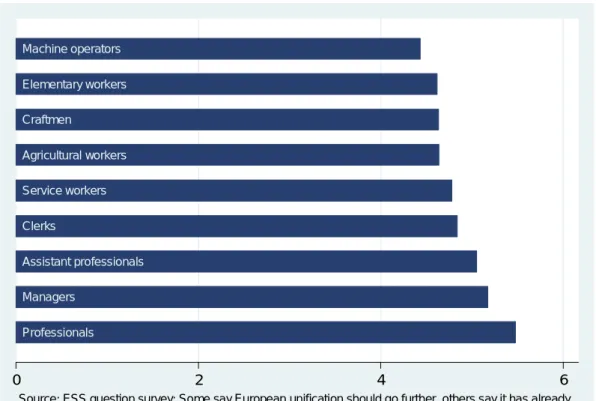
Figure 5- EU 15 states: average support by ISCO Professionals Managers Assistant professionals Clerks Service workers Agricultural workers Craftmen Elementary workers Machine operators 0 2 4 6
Source: ESS question survey: Some say European unification should go further, others say it has already gone too far. Using this card (0-10), what number on the scale best describes your position?
Figure 6- Post communist countries: average support by ISCO
Managers Professionals Assistant professionals Agricultural workers Clerks Machine operators Service workers Craftmen Elementary workers 0 2 4 6
Source: ESS question survey: Some say European unification should go further, others say it has already gone too far. Using this card, what number on the scale best describes your position?
Table 1: Ordered logit: Original member states [1] [2] Demographic characteristics Female 0.845*** 0.844*** (0.000) (0.000) Reference category: 30-54 16-29 age category 1.183*** 1.179*** (0.000) (0.000) over 55 age category 0.886*** 0.891***
(0.000) (0.000)
Occupation
Reference category: Professionals
Managers 0.802*** 0.819*** (0.000) (0.000) Assistant professionals 0.744*** 0.756*** (0.000) (0.000) Clerks 0.667*** 0.682*** (0.000) (0.000) Service workers 0.615*** 0.618*** (0.000) (0.000) Agricultural workers 0.555*** 0.568*** (0.000) (0.000) Craftmen 0.510*** 0.525*** (0.000) (0.000) Machine operators 0.484*** 0.503*** (0.000) (0.000) Elementary workers 0.551*** 0.559*** (0.000) (0.000) Income
Reference category: coping on present income
Living comfortably on present income 1.244*** 1.245*** (0.000) (0.000) Finding it difficult on present income 0.879*** 0.877***
(0.000) (0.000)
Employment status
Reference category: in paid work
In education 1.462*** 1.465*** (0.000) (0.000) Unemployed 1.016 1.037 (0.741) (0.476) non-working 1.018 1.058 (0.776) (0.377) Retired 0.940* 0.957 (0.053) (0.179) doing housework 1.077** 1.109*** (0.049) (0.009) Others 1.044 1.076 (0.664) (0.482) Employment relation
Reference category: wage earners
self employed 1.001 1.011 (0.978) (0.744) working in the family business 0.915 0.920
Unions
Union membership 0.959* 0.945** (0.057) (0.013)
Country fixed effects
Reference country: Belgium
Austria 0.585*** 0.597*** (0.000) (0.000) Germany 0.929 0.910** (0.100) (0.041) Denmark 1.501*** 1.497*** (0.000) (0.000) Spain 1.426*** 1.417*** (0.000) (0.000) Finland 0.653*** 0.660*** (0.000) (0.000) France 0.868*** 0.875*** (0.003) (0.006) Great Britain 0.515*** 0.512*** (0.000) (0.000) Greece 1.398*** 1.382*** (0.000) (0.000) Ireland 0.881*** 0.895** (0.009) (0.028) The Netherlands 1.178*** 1.154*** (0.001) (0.003) Portugal 1.277*** 1.260*** (0.000) (0.000) Sweden 0.839*** 0.844*** (0.000) (0.000) Ess round 4 1.095*** 1.102*** (0.000) (0.000) Partisanship Reference: center Far-left 0.969 (0.521) Center-left 1.229*** (0.000) Center-right 1.050* (0.053) Far-right 0.915* (0.090) Number of observations 40587 37467 Pseudo R-Sq. 0.028 0.029 Log Pseudo likelihood -42685.2 -39340.0 Chi 2 2425.33 2340.45 Note: Robust standard errors in parentheses * p<0.10, **p<0.05, *** p<0.01
Table 2: Ordered logit: Post communist countries [1] [2] Demographic characteristics Female 0.908*** 0.927** (0.002) (0.026) Reference category: 30-54 1.108** 1.121** 16-29 age category (0.024) (0.023) 1.022 1.017 over 55 age category (0.609) (0.716)
Occupation
Reference category: Professionals
Managers 0.950 0.977 (0.429) (0.734) Assistant professionals 0.873** 0.885** (0.014) (0.039) Clerks 0.915 0.944 (0.162) (0.394) Service workers 0.829*** 0.861** (0.001) (0.013) Agricultural workers 0.820** 0.841* (0.034) (0.089) Craftmen 0.794*** 0.818*** (0.000) (0.001) Machine operators 0.833*** 0.885* (0.002) (0.058) Elementary workers 0.775*** 0.800*** (0.000) (0.000) Income
Reference category: coping on present income
Living comfortably on present income 1.162*** 1.137** (0.002) (0.015) Finding it difficult on present income 0.789*** 0.777***
(0.000) (0.000)
Employment status
Reference category: in paid work
In education 0.980 1.005 (0.822) (0.957) Unemployed 0.954 0.958 (0.466) (0.544) non-working 0.881 0.912 (0.194) (0.385) Retired 0.927 0.946 (0.115) (0.285) doing housework 1.094 1.118* (0.128) (0.085) Others 0.868 1.028 (0.384) (0.879) Employment relation
Reference category: wage earners
self employed 1.014 1.030 (0.806) (0.629) working in the family business 0.980 0.928
Country fixed effects
Reference country: Bulgaria
Czech Republic 0.196*** 0.198*** (0.000) (0.000) Hungary 0.275*** 0.280*** (0.000) (0.000) Estonia 0.233*** 0.242*** (0.000) (0.000) Latvia 0.173*** 0.172*** (0.000) (0.000) Poland 0.690*** 0.700*** (0.000) (0.000) Romania 1.325*** 1.326*** (0.001) (0.002) Slovenia 0.288*** 0.311*** (0.000) (0.000) Slovakia 0.365*** 0.380*** (0.000) (0.000) Ess round 4 0.977 0.990 (0.479) (0.778) Partisanship Reference: center Far-left 1.051 (0.440) Center-left 1.055 (0.202) Center-right 1.326*** (0.000) Far-right 1.398*** (0.000) Number of observations 18493 15862 Pseudo R-Sq. 0.053 0.054 Log Pseudo likelihood -18412.6 -15738.3 Chi 2 2046.65 1795.95 Note: Robust standard errors in parentheses * p<0.10, ** p<0.05, *** p<0.01
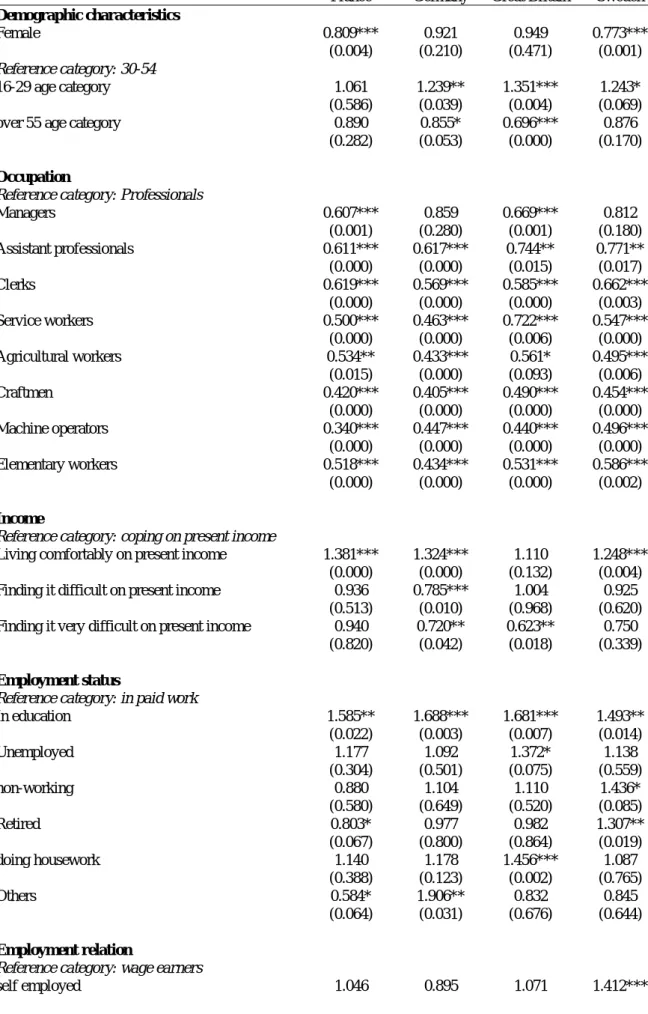
Table 3: Ordered logit: Separated Country Regressions
France Germany Great Britain Sweden
Demographic characteristics Female 0.809*** 0.921 0.949 0.773*** (0.004) (0.210) (0.471) (0.001) Reference category: 30-54 16-29 age category 1.061 1.239** 1.351*** 1.243* (0.586) (0.039) (0.004) (0.069) over 55 age category 0.890 0.855* 0.696*** 0.876
(0.282) (0.053) (0.000) (0.170)
Occupation
Reference category: Professionals
Managers 0.607*** 0.859 0.669*** 0.812 (0.001) (0.280) (0.001) (0.180) Assistant professionals 0.611*** 0.617*** 0.744** 0.771** (0.000) (0.000) (0.015) (0.017) Clerks 0.619*** 0.569*** 0.585*** 0.662*** (0.000) (0.000) (0.000) (0.003) Service workers 0.500*** 0.463*** 0.722*** 0.547*** (0.000) (0.000) (0.006) (0.000) Agricultural workers 0.534** 0.433*** 0.561* 0.495*** (0.015) (0.000) (0.093) (0.006) Craftmen 0.420*** 0.405*** 0.490*** 0.454*** (0.000) (0.000) (0.000) (0.000) Machine operators 0.340*** 0.447*** 0.440*** 0.496*** (0.000) (0.000) (0.000) (0.000) Elementary workers 0.518*** 0.434*** 0.531*** 0.586*** (0.000) (0.000) (0.000) (0.002) Income
Reference category: coping on present income
Living comfortably on present income 1.381*** 1.324*** 1.110 1.248*** (0.000) (0.000) (0.132) (0.004) Finding it difficult on present income 0.936 0.785*** 1.004 0.925
(0.513) (0.010) (0.968) (0.620) Finding it very difficult on present income 0.940 0.720** 0.623** 0.750
(0.820) (0.042) (0.018) (0.339)
Employment status
Reference category: in paid work
In education 1.585** 1.688*** 1.681*** 1.493** (0.022) (0.003) (0.007) (0.014) Unemployed 1.177 1.092 1.372* 1.138 (0.304) (0.501) (0.075) (0.559) non-working 0.880 1.104 1.110 1.436* (0.580) (0.649) (0.520) (0.085) Retired 0.803* 0.977 0.982 1.307** (0.067) (0.800) (0.864) (0.019) doing housework 1.140 1.178 1.456*** 1.087 (0.388) (0.123) (0.002) (0.765) Others 0.584* 1.906** 0.832 0.845 (0.064) (0.031) (0.676) (0.644) Employment relation
Reference category: wage earners
(0.744) (0.232) (0.523) (0.005) working in the family business 0.903 1.465 1.310 0.528*
(0.775) (0.180) (0.246) (0.099) Unions Union membership 0.967 0.894* 0.974 0.731*** (0.685) (0.068) (0.701) (0.002) Ess round 4 1.179** 1.294*** 1.039 1.115 (0.012) (0.000) (0.543) (0.115) Partisanship Reference: center Far-left 0.994 1.241 1.336* 0.737* (0.965) (0.104) (0.090) (0.061) Center-left 1.401*** 1.265*** 1.415*** 0.965 (0.000) (0.000) (0.000) (0.709) Center-right 1.135 0.769*** 0.728*** 1.572*** (0.150) (0.001) (0.000) (0.000) Far-right 1.020 0.745 0.508*** 1.697*** (0.909) (0.199) (0.001) (0.002) Number of observations 3336 4413 3794 3141 Pseudo R-Sq. 0.028 0.032 0.034 0.034 Log Pseudo likelihood -3502.9 -4687.5 -3732.9 -3125.7 Chi 2 201.63 305.71 259.03 218.53 Note: Robust standard errors in parentheses * p<0.10, **p<0.05, *** p<0.01
![Table 1: Ordered logit: Original member states [1] [2] Demographic characteristics Female 0.845*** 0.844*** (0.000) (0.000) Reference category: 30-54 16-29 age category 1.183*** 1.179*** (0.000) (0.000) over 55 age cate](https://thumb-eu.123doks.com/thumbv2/123doknet/13255991.396399/24.892.90.728.162.1151/ordered-original-demographic-characteristics-female-reference-category-category.webp)
![Table 2: Ordered logit: Post communist countries [1] [2] Demographic characteristics Female 0.908*** 0.927** (0.002) (0.026) Reference category: 30-54 1.108** 1.121** 16-29 age category (0.024) (0.023) 1.022 1.017 ov](https://thumb-eu.123doks.com/thumbv2/123doknet/13255991.396399/26.892.85.741.146.1135/ordered-communist-countries-demographic-characteristics-reference-category-category.webp)