HAL Id: hal-00371545
https://hal.archives-ouvertes.fr/hal-00371545
Submitted on 30 Mar 2009
HAL is a multi-disciplinary open access
archive for the deposit and dissemination of
sci-entific research documents, whether they are
pub-lished or not. The documents may come from
teaching and research institutions in France or
abroad, or from public or private research centers.
L’archive ouverte pluridisciplinaire HAL, est
destinée au dépôt et à la diffusion de documents
scientifiques de niveau recherche, publiés ou non,
émanant des établissements d’enseignement et de
recherche français ou étrangers, des laboratoires
publics ou privés.
Counterions release from electrostatic complexes of
polyelectrolytes and proteins of opposite charge : a
direct measurement
Jérémie Gummel, Fabrice Cousin, François Boué
To cite this version:
Jérémie Gummel, Fabrice Cousin, François Boué. Counterions release from electrostatic complexes
of polyelectrolytes and proteins of opposite charge : a direct measurement. Journal of the American
Chemical Society, American Chemical Society, 2007, 129 (18), pp.5806-5807. �hal-00371545�
Counterions release from electrostatic complexes of polyelectrolytes and proteins of
opposite charge : a direct measurement
Jérémie Gummel, Fabrice Cousin* and François Boué
Laboratoire Léon Brillouin, CEA Saclay 91191 Gif-sur-Yvette Cedex France
RECEIVED DATE (automatically inserted by publisher); e-mail: [email protected]
There has been recently a large interest [1] for the understanding of the mechanisms governing the complexation of polyelectrolytes and proteins of opposite charges due to the growing potential of applications (proteins fractionation [2], controlled drug release [3], biosensors [4]). This is also linked to the emergence of new polyelectrolyte assemblies such as spherical brushes or multilayers. While an obvious and confirmed driving force of complexation is electrostatic attraction, the role of the counterions (e.g. the Sodium cations of a polyanion chain, noted c.i. below) is a key point. Being many and of small mass, free c.i. have a high translational entropy: e.g., it increases strikingly the osmotic pressure of polyions solutions. If they are dispersed into the solvent after complexation, the entropy gain will be important, and could balance the loss of conformational entropy of the polymer. To estimate this entropy, one has to account for the “condensation” phenomenon: if the distance a between two charges is shorter than the Bjerrum length above which thermal agitation is higher thanelectrostatic attraction, lB, a large fraction
(1- a / lB) of c.i. is trapped close to the polyion [5] ; condensation
is relevant also for spherical objects [6] like globular proteins. During complexation, the charge neutralization of opposite charged species can lead to a release of the condensed c.i. The released c.i regain as much translational entropy as the free ones [7,8]. Such effects could differentiate strongly charged synthetic polyelectrolyte (a/lB ~2.4Å /7.2 Å ~ 1/3) where condensation is
important, from less charged chains (f=1) like polysaccharides. In numerical simulations [9], condensed and free c.i. release is observed. But experiments gave until now only indirect indications: calorimetric measurements during complexation (proteins/polycation [10] or polyanion/polycation [11]) evidence an endothermic entropically driven contribution. Protein penetration within a polyelectrolyte brush [12] is also indirectly attributed to c.i. release. The present paper reports the first direct structural observation, at our best knowledge.
We present here a ‘yes - no’ experiment, unambiguously linked to the presence or not of the chain c.i. in proteins-polyelectrolyte complexes. The protein is lysozyme, positively charged at low pH, the polyion is polystyrene sulfonate (PSS), with one negative charge per unit. This experiment is based on SANS measurements where we take advantage of the fact that hydrogenated PSS chains and lysozyme have exactly the same neutron density length. Thus the scattering from both species can be switched off simultaneously using a solvent, here a 57%H2O/43%D2O mixture,
which has the same neutron density length: this is called “matching”. The remaining signal is the scattering of the counterions only for such “CI” labeling. We chose 4 samples who should, or not, have only released counterions, hence who should scatter, or not.
Our choice of samples is based on already known structures, observed by SANS [13] in complexes of lysozyme and short Sodium PolystyreneSulfonate (PSSNa) which are in dilute regime.
When the ratio of negative to positive effective charges brought by components, [-]/[+]intro , is close to 1, the system is made of dense
globular primary complexes (radius ~ 10 nm) organized at higher scale in a fractal way. Using this time deuterated PSS chains, we could switch off either the protein scattering (PE labeling) or the d-PSS scattering (Prot labeling). For such globular structure, comparison of data for these two contrasts gives accurately the inner composition of the globules. Typical spectra will be given below in the case of TMA c.i., which gives very similar results. Let us first summarize three points: (i) whatever [-]/[+]intro, globules
have a neutral dense core , i.e. [-]/[+]inner ~ 1 (note that the
negative charge concentration [-]intro comprises all units of the
polyion, so core neutrality suggests the release of condensed c.i.). (ii) The core is in addition surrounded by a polymer corona in excess of PSS (hairy core). (iii) This gives four typical structures (Figure 1.a): for [-]/[+]intro < 1, “naked” cores plus free protein, for
[-]/[+]intro = 1, naked cores, for [-]/[+]intro > 1, hairy cores, for
[-]/[+]intro > 2 hairy cores plus free polyions.
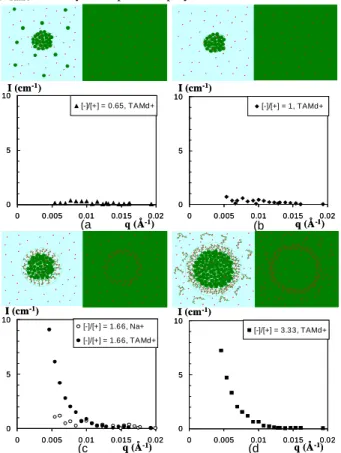
FIGURE 1: Structures of globules made of lysosyme (green), h-PSS (green), and (CD3)4N+ counterions (red) in 100%H2O solvent (left ) or in 57%H2O/43%D2O solvent (right) and corresponding scattering of (CD3)4N+ in the 57%H2O/43%D2O solvent. (a) and (b) : ‘naked cores’ (([-]/[+]intro =
(a (b (c (d 0 5 10 0 0.005 0.01 0.015 0.02 [-]/[+] = 0.65, TAMd+ q (Å-1) I (cm-1) 0 5 10 0 0.005 0.01 0.015 0.02 [-]/[+] = 0.65, TAMd+ q (Å-1) I (cm-1) 0 5 10 0 0.005 0.01 0.015 0.02 [-]/[+] = 1, TAMd+ q (Å-1) I (cm-1) 0 5 10 0 0.005 0.01 0.015 0.02 [-]/[+] = 1, TAMd+ q (Å-1) I (cm-1) 0 5 10 0 0.005 0.01 0.015 0.02 [-]/[+] = 1.66, Na+ [-]/[+] = 1.66, TAMd+ q (Å-1) I (cm-1) 0 5 10 0 0.005 0.01 0.015 0.02 [-]/[+] = 1.66, Na+ [-]/[+] = 1.66, TAMd+ q (Å-1) I (cm-1) 0 5 10 0 0.005 0.01 0.015 0.02 [-]/[+] = 3.33, TAMd+ q (Å-1) I (cm-1) 0 5 10 0 0.005 0.01 0.015 0.02 [-]/[+] = 3.33, TAMd+ q (Å-1) I (cm-1)
0.65 and [-]/[+]intro = 1), (c) and (d) : ‘hairy cores’ ([-]/[+]intro = 1.66 and [-]/[+]intro = 3.33).
Such possibility to tune from “naked” to “hairy” cores permits to compare the scattering where all c.i. should be released - “naked” cores, with the one where some c.i. are still present - “hairy” cores where c.i. are condensed on the dangling polyions of the shell. For a strong conclusion the second should be detectable, while the first should be much lower: using the “CI” labelling conditions, the c.i. scattering would be the one of dispersed very small species, very low [14].
Experimental success relies on the efficiency of the “CI labelling”, i.e. on good contrast of counterions: they have to be visible when lysozyme and hydrogenated PSS are masked by the 57%H2O/43%D2O solvent. The c.i. scattering length density must
be very different from the solvent one (in other words have a high contrast). For this we use deuterated tetramethylammonium c.i., (CD3)4N+ (noted d-TMA), which contains 12 non labile deuterium
atoms (conversely Na+ has -accounting for solvatation, a very poor
contrast in this solvent [15]).
We firstly checked that replacing Na by TMA does not change the structure of complexes: we performed SANS measurements (PAXY spectrometer, LLB, Saclay, France), with same concentrations as in [13], on samples with d-PSS-TMA. The latter is obtained by Makowski sulfonation [16] of deuterated d-PS chains, like for PSSNa. In the last step, polystyrene sulfonic acid (d-PSSH) is neutralized by tetramethylammoniumhydroxyde (h-TMA(OH)) instead of sodium hydroxide NaOH. The chains weight average polymerization degree N is 40. The complexes are made at pH 4.7 (the protein has a net charge +11) in acetic acid/ acetate buffer of ionic strength 5.10-2 M. Lysozyme is at 40 g/L for all 4 samples, and PSS at 0.02M, 0.03M, 0.05M and 0.1M, corresponding to [-]/[+]intro : 0.65, 1, 1.66 and 3.33 respectively.
Solvent is either a 57%H2O/43%D2O mixture that “matches”
protein, yielding d-PSS signal, or a 100% D2O mixture that
“matches” d-PSS and yields the protein signal. Results for [-]/[+]intro = 1.66 and 3.33 are shown on figure 2. For a given
[-]/[+]intro, PSS and lysozyme signals present the same features,
indicating that the two species are spatially organized in the same way in the system [13]. We observe: a correlation peak at 0.2 Å-1 corresponding to the contact distance between two proteins, a q-4
decay at intermediate q due to surface scattering of the globules (which look dense at the corresponding larger scale), and an upturn towards a q-2.1 decay at low q due to the fractal organization of the globules at even larger scale. For [-]/[+]intro > 1 , the upturn onset is at lower q for the PSS signal
because the globule looks larger when the visible species is PSS and a shell is present. Values are lower for d-PSS signal than lysozyme signal because the volume fraction inside the globules when [-]/[+]inner = 1 is lower for PSS than for lysozyme. Thus
features are all the same for h-TMA c.i. than with Na+ [13]. The only small difference is the primary complexes size which is slightly larger with TMA counterions.
Then, the specific signal of TMA c.i. was measured using four samples in the 57%H2O/43%D2O solvent at same concentrations,
but replacing d-PSS h-TMA by h-PSS d-TMA. The latter is obtained by neutralization of h-PSSH by d-TMA(OH) (Eurisotop France). On Figure 1, at first sight, samples containing ‘naked’ globules ([-]/[+]intro = 1 and 0.65) do not scatter at low q, while
samples with ‘hairy’ globules ([-]/[+]intro = 1.66 and [-]/[+]intro =
3.33) do scatter. A control sample with Na+ c.i. has been measured for [-]/[+]intro = 1.66. It is compared on figure 1 with the d-TMA
and does not show any scattering at low q; this confirms that the low q scattering from hairy globules comes from the d-TMA c.i..
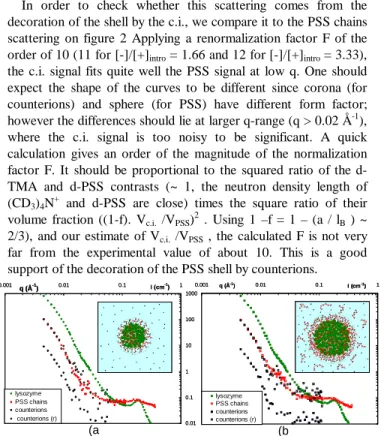
In order to check whether this scattering comes from the decoration of the shell by the c.i., we compare it to the PSS chains scattering on figure 2 Applying a renormalization factor F of the order of 10 (11 for [-]/[+]intro = 1.66 and 12 for [-]/[+]intro = 3.33),
the c.i. signal fits quite well the PSS signal at low q. One should expect the shape of the curves to be different since corona (for counterions) and sphere (for PSS) have different form factor; however the differences should lie at larger q-range (q > 0.02 Å-1), where the c.i. signal is too noisy to be significant. A quick calculation gives an order of the magnitude of the normalization factor F. It should be proportional to the squared ratio of the d-TMA and d-PSS contrasts (~ 1, the neutron density length of (CD3)4N+ and d-PSS are close) times the square ratio of their
volume fraction ((1-f). Vc.i. /VPSS)2 . Using 1 –f = 1 – (a / lB ) ~
2/3), and our estimate of Vc.i. /VPSS , the calculated F is not very
far from the experimental value of about 10. This is a good support of the decoration of the PSS shell by counterions.
FIGURE 2: Comparison of lysozyme scattering (in 100%D2O solvent), PSS scattering (d-PSS in 57%H2O/43%D2O solvent) and c.i. (CD3)4N+ in 57%H2O/43%D2O solvent with h-PSS chains) in hairy globules. The c.i. scattering is also compared with PSS one after normalization. (a) [-]/[+]intro = 1.66, (b) [-]/[+]intro = 3.33
In summary, we have shown by a specific labelling experiment that in a system where proteins and polyelectrolyte chains strongly interact to form dense globules, the inner charge stoichiometry of the globules is accompanied by a complete release of all counterions (condensed as well as not condensed) from the core of the globules (same concentration everywhere in the sample). The only significant scattering signal from c.i. comes from the ones trapped in the shell surrounding the complexes when they exist. [1] (a) C.L. Cooper, P.L. Dubin, A.B. Kayitmazer, S. Turksen, Curr. Opin. Coll. Interface Sci., 2005, 10, 52-78. (b) C. Tribet, Complexation between amphiphilic polyelectrolytes and proteins: from necklaces to gels, Surfactant Science Series “Physical chemistry of polyelectrolytes”, T. Radeva Ed., M. Dekker, 1999, chap 19, 687-741.
[2] V. Izumrudov, I. Galaev, B. Mattiason, Bioseparation, 1998, 7, 207-220. [3] L. Bromberg, E. Ron, Advanced Drug Delivery, 1998, 31, 197-221. [4] N. A. Chaniotakis, Analytical and Bioanalytical Chemistry, 2004, 378, 89-95.
[5] G.S. Manning, J. Chem. Phys., 1969, 51, 3, 924-938
[6] S. Alexander, P. M. Chaikin, P. Grant, G.J. Morales, P. Pincus, D. Hone, J. Chem. Phys. 1984, 80, 5776-5781.
[7] JF Joanny, M Castelnovo, R Netz, J Phys Condens Matter, 2000, 12, 1-7. [8] S. Y. Park, R. F. Bruinsma, W. M. Gelbart, Europhys. Lett, 1999, 46(4), 454-460.
[9] M Skepö, P. Linse, Macromolecules, 2003, 508-519.
[10] V. Ball, M. Winterhalter, P. Schwinte, Ph. Lavalle, J.-C. Voegel and P. Schaaf, J. Phys. Chem. B, 2002, 106, 2357-2364.
[11] C.B. Bucur, Z. Sui, J. B. Schlenoff, J. Am. Chem. Soc.,2006; 128(42); 13690-13691.
[12] S Rosenfeldt, A Wittemann, M Ballauff, E Breininger, J. Bolze, and N. Dingenouts, PRE, 2004, 70, 061403-1.
[13] J Gummel, F. Boué, B. Demé, F. Cousin, J Phys Chem B, 2006, 110, 24837-24846.
[14] The low q scattering of counterions condensed on free proteins and free PSS chains is also negligible (low q scattering of free proteins and PSS is negligible whatever the labeling [13])
[15] E. Dubois, F. Boué, Macromolecules, 2001, 34, 3684-3697. 0.01 0.1 1 10 100 1000 0.001 q (Å-1 0.01 0.1 1 ) I (cm-1) lysozyme PSS chains counterions counterions (r) 0.01 0.1 1 10 100 1000 0.001 q (Å-1 0.01 0.1 1 ) I (cm-1) lysozyme PSS chains counterions counterions (r) 0.01 0.1 1 10 100 1000 0.001 q (Å-1) 0.01 0.1 I (cm-1) 1 lysozyme PSS chains counterions counterions (r) 0.01 0.1 1 10 100 1000 0.001 q (Å-1) 0.01 0.1 I (cm-1) 1 lysozyme PSS chains counterions counterions (r) (b ) (a )
[16] H.S. Makowski, R.D. Lundberg, G.S. Singhal US Patent 3 870 841, 1975, to EXXON Research and Engineering Co.
Abstract
Though often considered as one of the main driving process of the complexation of species of opposite charges, the release of counterions has never been experimentally directly measured. We present here the first structural determination of such a release by Small Angle Neutron Scattering in complexes made of lysozyme, a positively charged protein and of PSS, a negatively charged polyelectrolyte. Both components have the same neutron density length, so their scattering can be switched off simultaneously in an appropriate “matching” solvent; this enables determination of the spatial distribution of the single counterions within the complexes. The counterions (including the one subjected to Manning condensation) are expelled from the cores where the species are at electrostatic stoichiometry.
TOC 0 5 10 0 0.005 0.01 0.015 0.02 [-]/[+] = 1, TAMd+ q (Å-1) I (cm-1) 0 5 10 0 0.005 0.01 0.015 0.02 [-]/[+] = 1, TAMd+ q (Å-1) I (cm-1) 0 5 10 0 0.005 0.01 0.015 0.02 [-]/[+] = 1.66, Na+ [-]/[+] = 1.66, TAMd+ q (Å-1) I (cm-1) 0 5 10 0 0.005 0.01 0.015 0.02 [-]/[+] = 1.66, Na+ [-]/[+] = 1.66, TAMd+ q (Å-1) I (cm-1)