RESEARCH OUTPUTS / RÉSULTATS DE RECHERCHE
Author(s) - Auteur(s) :
Publication date - Date de publication :
Permanent link - Permalien :
Rights / License - Licence de droit d’auteur :
Bibliothèque Universitaire Moretus Plantin
Institutional Repository - Research Portal
Dépôt Institutionnel - Portail de la Recherche
researchportal.unamur.be
University of Namur
Double-peaked breakthrough curves as a consequence of solute transport through
underground lakes : a case study of the Furfooz karst system, Belgium
Dewaide, Lorraine; Hallet, Vincent; Poulain, Amael; Rochez, Gaëtan; Collon, Pauline
Published in: Hydrogeology Journal DOI: 10.1007/s10040-017-1671-4 Publication date: 2017 Document Version
Publisher's PDF, also known as Version of record
Link to publication
Citation for pulished version (HARVARD):
Dewaide, L, Hallet, V, Poulain, A, Rochez, G & Collon, P 2017, 'Double-peaked breakthrough curves as a consequence of solute transport through underground lakes : a case study of the Furfooz karst system, Belgium', Hydrogeology Journal, vol. 26, no. 2, pp. 641-650. https://doi.org/10.1007/s10040-017-1671-4
General rights
Copyright and moral rights for the publications made accessible in the public portal are retained by the authors and/or other copyright owners and it is a condition of accessing publications that users recognise and abide by the legal requirements associated with these rights. • Users may download and print one copy of any publication from the public portal for the purpose of private study or research. • You may not further distribute the material or use it for any profit-making activity or commercial gain
• You may freely distribute the URL identifying the publication in the public portal ?
Take down policy
If you believe that this document breaches copyright please contact us providing details, and we will remove access to the work immediately and investigate your claim.
REPORT
Double-peaked breakthrough curves as a consequence of solute
transport through underground lakes: a case study of the Furfooz
karst system, Belgium
Lorraine Dewaide1&Pauline Collon2&Amaël Poulain1&Gaëtan Rochez1&
Vincent Hallet1
Received: 13 February 2017 / Accepted: 12 September 2017 # Springer-Verlag GmbH Germany 2017
Abstract The existence of double-peaked breakthrough curves (BTC), which are the result of the transport of a dye tracer through underground lakes, is reported. Investigations were undertaken on the Furfooz karst sys-tem in southern Belgium. In this syssys-tem, the River Lesse sinks partially into a swallow hole. The water follows a solitary conduit leading to an underground lake that is directly connected to a second underground lake. Double-peaked BTCs were detected in the resurgent wa-ter, downstream of this second lake. The report first de-scribes field data (tracer tests in various hydrologic con-ditions) which point towards the double peak being linked to a nonlinear process that originates within the lakes. Complementary investigations within the lakes show a complex behavior of the dye tracer related to a specific hydrodynamic feature that leads to the separation of the solute plume. A conceptual model of the solute transport within the lakes is proposed. This model emphasizes the physical effect of the lakes on the dye flow-through process.
Keywords Karst . Tracer tests . Double-peaked breakthrough curve . Underground lake . Belgium
Introduction
The existence of double-peaked breakthrough curves (BTCs) in karst systems is documented but often poorly understood. The modeling of multipeaked recovery curves is an issue that has been considered in several studies. The multidispersion model of Maloszewski et al. (1992) has been successfully applied to multipeaked BTCs by several researchers such as Werner et al. (1997) and Käss (1998, pp 377–381). Field and
Leij (2012) proposed a new model, the dual-advection disper-sion equation (DADE), able to model dual-peaked BTCs due to solute transport in two conduits that are connected and that can exchange solutes between them. Few studies have considered the physical origin of those double curves. Goldscheider et al. (2008) recorded double peaks in a tracer test at Mammoth Cave, USA, for which they explained the double-peaked curves by the possible presence of an unknown bifurcated flow path. Several sampling sites were settled for the Mammoth Cave system, from the injection point to the main resurgence, so that the researchers could identify the likely location at which subsurface flow conditions resulted in double-peaked recovery curves. Sometimes, double-peaked BTCs are also attributed to the injection mode (Brouyère and Rentier1997). Indeed, tracer tests in karst environments are, most of the time, performed through impulse injections (Dirac type). This usually involves injection of a supplementary vol-ume of water to chase the tracer as quickly as possible. The repeatability of the results with respect to distinct double peaks depends on the injection mode or factors linked to the specific subsurface flow conditions. Two studies have established a link between those double peaks and the existence of a lake or a pool on the tracer path. Hauns and Jeannin (1998) showed that a secondary peak can appear when important changes in a section of the conduit system are observed, which could potentially be linked to the
* Lorraine Dewaide
1
Department of Geology, University of Namur, 61 Rue de Bruxelles, 5000 Namur, Belgium
2 Georessources, University of Lorraine, CNRS, CREGU, ENSG, 2
Rue du Doyen Marcel Roubault, BP 10162, 54505 Vandoeuvre-Lès-Nancy Cedex, France Hydrogeol J
presence of a pool in the flow path. The authors attribute secondary peaks to the trapping of the tracer in eddies. They produced double-peaked BTCs through physical and numerical modeling. Field and Leij (2012) realized laboratory analogs to produce experimental double-peaked BTCs. One of those analogs simulated a pool where water flows in and out via small pipes simulating solitary conduits. In both cited studies, the authors have highlighted the strong control of conduit geometries on the resulting BTCs, as also shown in other studies (Hauns et al.2001; Massei et al.2006; Morales et al.2010). The work reported in this article shows field evidence of a real karst system characterized by the presence of underground lakes that produce double-peaked BTCs. These observations could thus constitute reference data for future works that make use of numerical modeling.
The tracer tests presented here are used in a qualitative and quantitative approach. The resulting BTCs are analyzed in order to characterize solute transport in karst conduits, as usu-ally done in karst hydrogeology (Käss1998; Schudel et al.
2003; Jeannin et al. 2007; Dewaide et al.2016). It is first shown that the double-peaked BTCs should be explained by a process taking place in the lakes. Then, through the estima-tion of the transport and hydrodynamic parameters, the other features of the two BTC peaks are demonstrated to be inherited from different dynamics in the first and second lakes. Finally, complementary investigations highlight the different behaviors of the dye tracer in the two lakes.
Study site: overview of the underground system
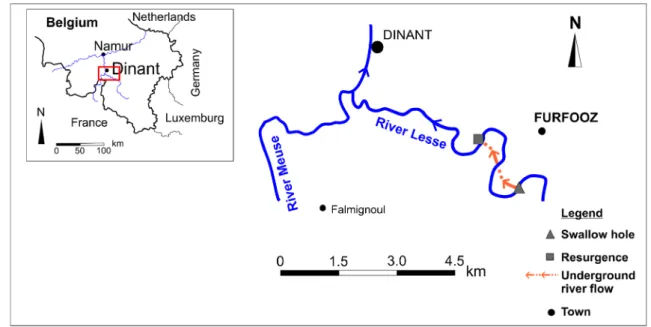
The karstic system of Furfooz, located near Dinant in southern Belgium, is developed in Carbonifereous Dinantian carbon-ates. The River Lesse partially sinks through a small swallow hole. It reappears about 1.2 km downstream via a diffuse re-surgence, after traveling below two surface-river meanders (Fig.1).
Thanks to several speleological access points to the under-ground River Lesse (i.e. at sites 1, 2, 3, 4, and 5, Fig.2), the system benefits from a good knowledge, except for the under-ground flow route between sites 3 and 4. The karstic river flows mainly through conduits with flooded cross sections of 1–2 m2
in moderate flow conditions and crosses a major heterogeneity in the form of two successive underground lakes. The discharge cannot be measured at the exit of the system because the resurgence there is widely dispersed. For this reason, site 5 will not be mentioned any further in this report and site 4 will be the most downstream point considered for the experiments described hereafter. Site 4 is the only location in the system where a continuous monitoring of the discharge could be done. This monitoring shows that the dis-charge at site 4 varies between 5 and 70 l/s depending on the
surface flow conditions. Occasional measurements have veri-fied that the flows at sites 1 and 4 are similar.
Regarding the present study, particular attention must be accorded to sites 2 and 3. They both represent underground lakes that are connected but separated by a fractured rocky spur or by interconnected massive blocks of rock. The geom-etry of these lakes are not exactly known but the cave diving reports have enabled a conceptual layout, as shown in Fig.3. From site 1, the underground river can easily be followed to the mouth of the site 2 lake, which has a narrow shape and a supposed depth of 32 m. The speleological junction between site 2 and site 3 has never been found; therefore, the site 3 lake has to be accessed via the ground surface above it. At site 3, the surface area of the lake is around 30 m2and the depth is at least 25 m. The lake’s downstream water exit seems to be located at 15 m of depth.
Field tracer tests
In order to characterize solute transport through the Furfooz system, and more specifically to evaluate the influence of the lakes on the tracer recovery, several tracer tests were per-formed in 2013, under various flow conditions and from dif-ferent injection points. To describe the dye tracer transport through the lakes, the nearest sampling station available downstream was used (site 4). Each test was undertaken in stable and moderate flow conditions and any false interpreta-tions of the BTCs due to sudden floods or variable discharge can therefore be excluded. The dye tracers used during those tests were fluorescein or sulforhodamine B and the sampling devices were the automatic fluorometers GGUN-FL30 (Schnegg and Doerfliger1997) and the FLUO-G, developed recently by Poulain et al. (2017). Injections were performed at the swallow hole and at site 3. The fluorometers were there-fore placed at sites 1, 3, and 4. There was no possibility at this time to place a fluorometer into the lake at site 2. Recovery rates at sites 1 and 4 are based on the discharge measurements done at each site. Recovery is not calculated for site 3 as the fluorometer was located at the surface of the lake where a real discharge cannot be measured.
Injections at the swallow hole
Injections (200 g of sulforhodamine B or fluorescein) were performed at the swallow hole and fluorometers were placed at sites 1, 3, and 4 (Fig.2). Three injections were performed in different but stable flow conditions (mean discharge of 20, 11 and 7 l/s respectively) in order to ensure the reliability of the results.
The results are shown in Fig. 4. The main transport parameters were calculated from these curves and are shown in Table 1. At site 1, where the fluorometer is
located about 150 m downstream from the swallow hole, the dye tracer arrives very quickly and transits very fast. The entire mass of injected tracer flows through this point (recovery of 100%). The solute is therefore entering the site 2 lake in a very advective way. This behavior is in contrast with the wide curve observed in site 3, located 310 m downstream from the swallow hole. The dye tracer arrives there 20–36 h after the injection depending of the flow conditions, implying a maximum velocity of 15–8 m/ h. The mean transit time is about 150 h but the complete recovery time is at least of 400 h, implying some skewness in the BTCs especially in higher flow conditions. This shows that the solute arriving at the surface of the site 3 lake has been subjected to an important dispersion through a consequent volume of water. The skewness observed in the BTC could be related to the diffusion of the tracer to
immobile water zones in the lakes where it is temporarily caught (Field and Pinsky 2000). All in all, the most sur-prising result of these tests is the appearance of a double-peaked BTC at site 4. The two peaks seem to have a dif-ferent shape, and so they could be the result of difdif-ferent processes. Therefore, the peaks were treated separately in order to characterize them properly. The first peak arrives rather quickly at site 4 (less than 60 h). Actually it arrives nearly at the same time at site 4 as at the surface of the site 3 lake and it has a short transit time (less than 100 h) compared to the second peak. The second peak at site 4 is detected only 60–150 h after the injection and has a total transit time of at least 500 h. The recovery rates at site 4 are rather weak (maximum of 41.7% when considering the two peaks together). This implies some loss of the tracer during transport. The reduction in tracer signal could be linked to
Fig. 2 Plan view of the River Lesse and the underground system with the speleological networks. The figure shows also the position of the fluorometers (green circles) used during the tracer tests. The I– II line locates the cross-section presented in Fig.3
Fig. 1 Location of the karstic system of Furfooz. Note that the underground river crosses two surface-river meanders Hydrogeol J
Fig. 3 Cross-section of the lake conceptual model based on diving descriptions. The position of the cross-section is shown in Fig.2
Fig. 4 Breakthrough curves of three tracer tests performed in different discharge (Q) conditions. The arrow below the X-axis shows the injection time. On the main plot (the left one), note the secondary Y-axis on the right that gives concentration at site 1 only. On the right, detailed plots of site 1 are also given
it being trapped in dead zones that would exist in the lakes. Furthermore, the masses of dye tracer implied in the two peaks are very different. The first peak represents 5, 20 and 30% of the second peak restituted mass for the test at 20, 11, and 7 l/s, respectively. The discharge seems therefore to have some control on the distribution of the dye tracer between the two peaks.
The QTracer2 program (Field2002) was used to estimate some hydrodynamic parameters: the longitudinal dispersion coefficient (DL), the longitudinal dispersivity (aL), the conduit cross-sectional area (Cs), and the Peclet (Pe) and Reynolds (Re) numbers (Table 2). Pe gives an idea about the relative
contribution of dispersion to transport, while Re represents the resistance to flow. Pe and Re are defined as (Grey and Pinder1976):
Pe¼vl
D ð1Þ
Re¼ρvd
μ ð2Þ
Where v is the solute mean velocity (m/s), l is the distance of transport (m), D the dispersion (m2/s),ρ the density of the fluid (g/m3), d the conduit diameter (m) and μ the fluid
Table 1 Main solute transport parameters from the BTCs analysis (injection at the swallow hole)
Tracer tests 1st A. (h) Tmean(h) Vmax(m/h) Vmean(m/h) Cpeak(ppb) Tpeak(h) R.R. (%)
Tracer test 1 Q = 20 l/s Site 1 1.5 3.1 100 45.5 2,100 2.3 100
Site 3 19.7 143.6 15.2 2.1 6.4 74.1 –
Site 4 1st peak 22.0 34.5 32.7 20.9 4.0 33.0 1.8
Site 4 2nd peak 48.2 174.9 14.9 4.1 8.0 112.0 39.9
Tracer test 2 Q = 11 l/s Site 3 36.4 148.3 8.2 2.0 7.37 82.9 –
Site 4 1st peak 38.7 68.2 19.9 11.3 4.40 61.0 2.4
Site 4 2nd peak 85.0 219.1 8.4 3.5 4.20 153.7 12.9
Tracer test 3 Q = 7 l/s Site 1 1.9 3.8 78.9 38.6 3,367.8 2.4 100
Site 3 30.0 157.8 10.3 2.0 12.7 125.8 –
Site 4 1st peak 40.3 86.8 19.1 8.9 9.5 78.2 5.5
Site 4 2nd peak 129.3 270.1 5.9 2.8 8.5 214.9 18.3
1stA. first arrival; Tmeanmean travel time; Vmaxmaximum velocity; Vmeanmean velocity; Cpeakmaximum peak concentration (in parts per billion); Tpeak
time to the maximum peak concentration; R.R. recovery rate; − no data
Table 2 Estimation of some hydrodynamic parameters from QTRACER2 (injections at the swallow hole)
Tracer tests DL (m2/s) aL (m) Cs (m2) Pe Re Tracer test 1 Q = 20 l/s Site 1 0.016 1.63 1.91 67.5 13,500 Site 3 0.037 63.8 32.7 4.71 3,287 Site 4 1stpeak 0.014 2.42 3.52 298 10,658 Site 4 2nd peak 0.070 60.9 17.5 11.8 4,733 Tracer test 2 Q = 11 l/s Site 3 0.023 41.4 18.7 7.25 2,404 Site 4 1st peak 0.019 6.17 3.33 126 5,679 Site 4 2nd peak 0.052 53.1 10.7 14.5 3,169 Tracer test 3 Q = 7 l/s Site 1 0.045 3.34 0.56 32.9 9,630 Site 3 0.021 39.1 12.9 7.92 1,934 Site 4 1st peak 0.044 17.8 2.81 43.2 4,110 Site 4 2nd peak 0.024 30.2 8.84 25.5 2,330
DLlongitudinal dispersion coefficient; aLlongitudinal dispersivity; Cs conduit cross-section; Pe Peclet number; Re Reynolds number
viscosity (g/m·s). It is usually considered that karst transport in conduits should be characterized by a Pe value that exceeds several times the value of 6 and by a Re value far greater than 2,000, which reveals a turbulent flow (Landau and Lifshitz
1987).
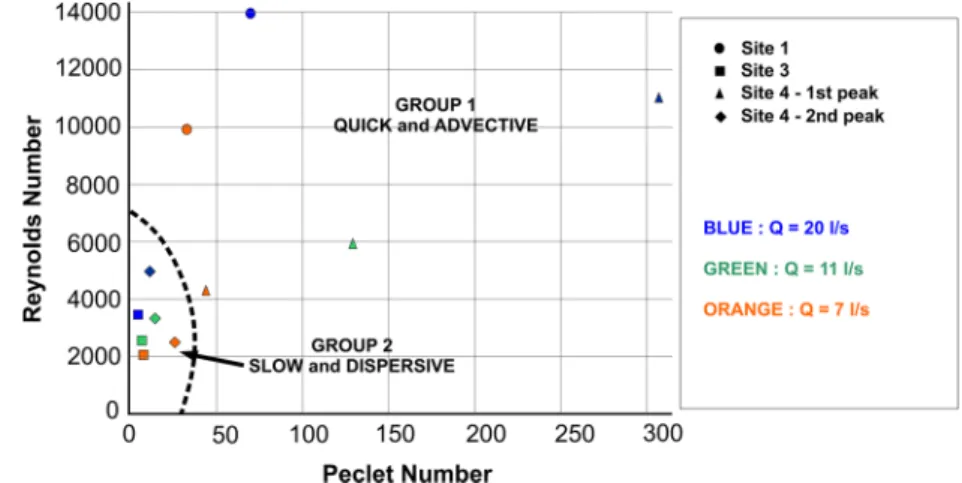
The use of QTracer2 allows one to characterize in a quan-titative way the hydrodynamic behavior shown by the differ-ent curves. The results confirm two contrasting behaviors at sites 1 and 3. BTCs at site 1 reveal a very advective transport with low dispersivity, and very high Pe and Re, while solute transport at site 3 is characterized by high dispersivity, and weak Pe and Re in large flow sections. A similar distinction is shown by the first and the second peaks of the double-peaked BTCs at site 4. The first peak reveals a classical be-havior of transport in karst conduits with moderate dispersivity and high Pe and Re numbers, while the second peak, for which transport is much slower, is dominated by high dispersivity in large flow sections. Re and Pe are also weaker for the second peak. Given the contrasting Re and Pe values obtained in the different tests at each site, it was decid-ed to plot the two parameters, see Fig.5. From this graphic, and given what has just been discussed, two groups of plots are distinguished, that correspond to two different hydrody-namics. The first group, with high Re and Pe, represents more turbulent and less dispersive transport, as is usual in karst transport mode. This group corresponds also to the peaks il-lustrating the quick and advective transport observed on the BTCs, i.e. the curves at site 1 and the first peaks at site 4. The second group gathers the slow and dispersive transport that is illustrated by BTCs at site 3 and the second peaks at site 4. This group is characterized by rather low Re and low Pe, and so by low turbulence and high dispersion which is not so usual for a classic conduit transport. Figure5shows also the ence of the discharge on the transport dynamic, but this influ-ence is different between the two groups. In group 1, Pe and Re are greatly impacted by the flow conditions with higher values when the flow increases, and much smaller values for small discharge. When the flow is low, transport tends to be
less turbulent and more dispersive. The orange triangle is, besides, very close to group 2 values because of this discharge influence. In group 2 the impact is, however, less obvious because the range of values is less wide but the decrease in Re is still obvious. However, the Pe values of the second group plots tend here to increase when the flow decreases, which would therefore suggest that the transport in group 2 is not only less turbulent but also less dispersive when the flow decreases.
Injection at site 3
An additional test was realized in order to have more informa-tion about the double peak appearance. An injecinforma-tion (200 g of fluorescein) was performed at the surface of the lake at site 3. The discharge (measured at site 4) was 6 l/s and remained steady during the test. The resulting BTC obtained at site 4 is shown in Fig. 6. The main transport and hydrodynamic parameters are presented in Table3.
The injection within the site 3 lake does not produce a double-peaked BTC but rather a single-peaked one that ex-presses a dispersive behavior (aL= 34.3 m). Transport is slow (v mean = 4.1 m/h) and values of Pe (12.5) and Re (2,593) would enter into group 2 which is shown in Fig.5. The cal-culated recovery rate is very low (7.48%)—probably suggest-ing that a great part of the tracer is lost into the site 3 lake. Long-term monitoring could probably not have recovered much more of the tracer, as natural decay and a wide dilution would make it pass under the detection limit (< 1 ppb).
Complementary investigations within the lakes
Investigations that were more specific were performed in the lakes at sites 2 and 3 to highlight heterogeneities that could be related to the behavior traits of the tracer. Different probe-systems were used to investigate the evolution of electrical conductivity, temperature and fluorescence related to depth
Fig. 5 A two-dimensional plot of Reynolds number and Peclet number evolution through the different sites in different flow conditions. The proposed dashed line delimits two groups of values that illustrate different
within the lakes during a tracer test. Regarding the difficult access conditions at site 2 and site 3, different equipment strategies were applied to those two lakes.
Site 2 lake equipment and results
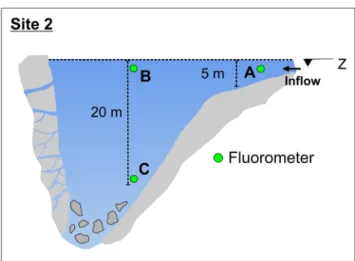
The site 2 lake can only be accessed after a long progression into a speleological cave (site 1) with narrow passages and muddy galleries. As a consequence, the supply of equipment to the lake is limited. The lake was explored once by diving; however, given the dangerousness of this dive, the diver was not asked to intervene further regarding the equipment. The lake was equipped with three fluorometers (Fig.7): one at the lake entrance (point A) and two in the center, about 30 m from the shore thanks to a boat. One of those two devices was placed 1 m below the water surface (point B) and the second 20 m deep (point C). A conductivity and temperature profile was also performed from the boat, which consisted of taking measurements every meter on a vertical profile from the sur-face to the bottom of the lake.
The conductivity and temperature profiles, made in the springtime, showed very homogeneous results with no clear changes in temperature or conductivity with the depth. A small variation of less than 1 °C was observed between the surface (12.1 °C) and the bottom at 21 m (11.3 °C). A con-ductivity value of 330μS/m was constant along the profile except at the bottom where it reached 360μS/m, but this is probably caused by sediment accumulation.
A dye tracer injection was made at the swallow hole. The discharge was estimated to be 9 l/s and stayed steady during the recovery. Results of this test show a clear difference in the
tracer behavior between the surface and the bottom of the lake (Fig.8). Indeed, the two fluorometers at the surface (points A and B) show a rapid arrival of highly concentrated tracer: the signal at point A shows a first arrival 1 h after the injection and the concentration increases in a few minutes up to 600 ppb. At point B the tracer arrives 1.8 h after injection and reaches a concentration of 450 ppb; for those two BTCs, the concentra-tion drops rapidly (within three hours) below 50 ppb and both show a little retardation in the recovery and a total disappear-ance of the tracer within 35 h. At point C, the situation is very different. The tracer reaches the fluorometer at the bottom of the lake after nearly 4 h and the concentration there does not exceed 50 ppb. The BTC shows a rather wide and skewed shape indicating some dispersion compared to what happens at the surface. The solute leaves point C location after less than 80 h but the mean transit time is less than 20 h.
Site 3 lake equipment and results
At site 3, it was decided to equip the lake with a screened casing from the surface to the bottom (about 25 m deep), which was possible thanks to the help of a diver. The casing was chosen large enough so that a piezometric fluorometer could be inserted in it. The experiment consisted of making a concentration profile through the depth of the lake. An in-jection was performed at the swallow hole (200 g of
Fig. 6 The BTC observed at site 4 for an injection at site 3
Table 3 Estimation of the transport parameters for the BTC obtained at site 4 from injection (6 l/s) at site 3 Transport
parameter
1st A. (h) Tmean(h) Vmax(m/h) Vmean
(m/h) Cpeak(ppb) Tpeak (h) R.R. (%) DL (m2/s) aL (m) Cs (m2) Pe Re Value 33.5 104 12.8 4.12 6.53 76.3 7.48 0.039 34.3 6.25 12.5 2,593
1stA. first arrival; Tmeanmean travel time; Vmaxmaximum velocity; Vmeanmean velocity; Cpeakmaximum peak concentration; Tpeaktime to the maximum
peak concentration; R.R. recovery rate; DLlongitudinal dispersion coefficient; aLlongitudinal dispersivity; Cs conduit cross-section; Pe Peclet number;
Re Reynolds number
Fig. 7 The site 2 lake was equipped with three fluorometers (A, B, C) placed at different positions and different depths during complementary investigations
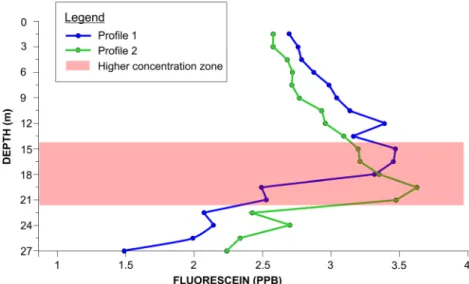
fluorescein) and a sounding of the lake with the fluorometer through the casing was realized 120 h after the injection (for results see Fig.9). Two concentration profiles were realized: one in ascending the fluorometer from the base of the casing to the top, and the other in descending the device. While fluo-rescein is observed in the whole profile, it clearly shows a higher concentration zone at a depth between 15 and 22 m, which would mean that the dye tracer coming from site 2 is entering site 3 at this depth.
Discussion
The experiments performed underscore a complex function-ing of the Furfooz system—a complexity that seems linked to the existence of two consecutive underground lakes. The most
remarkable feature of these experiments is the double-peaked BTC observed downstream of the lakes.
The double-peaked BTCs appear at site 4 if the injection is performed at the swallow hole. When the injection is made into the site 3 lake; however, the BTC at site 4 is single peaked; therefore, the origin of the double recovery has to be upstream of site 3. Furthermore, recovery observed at site 1 is total (recovery rates of 100%) which means that there is no bifurcated path upstream of site 1 sampling station. As a con-sequence, there is reasonable proof for locating the responsi-ble process for the douresponsi-ble recovery within the site 2 and site 3 lakes.
The BTCs analysis has shown that the two peaks are inherited from two different hydrodynamic behaviors. The behavior revealed by the first peak shows a rather quick trans-port dominated by advection, while the second peak is char-acterized by a slow and dispersive transport. The complemen-tary investigations within the lakes showed that the dye tracer has a very heterogeneous distribution into sites 2 and 3, highlighting some preferential route followed by the tracer. Given all the field observations, and particularly the very het-erogeneous behavior of the tracer into the site 2 and site 3 lakes, it is reasonable to propose that the double recovery is not linked to a bifurcated flow path but rather to a dual dy-namic within the lakes.
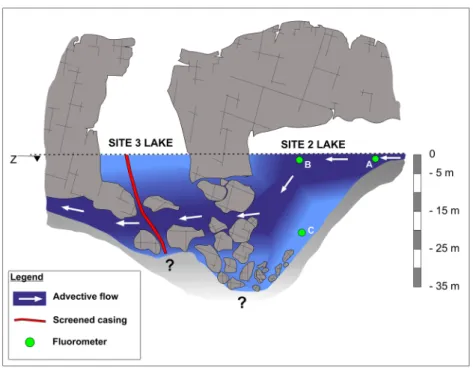
Figure10is a new conceptual model that gathers all the field measurements. In this model, a dual dynamic is forced by an advective flow that takes place in the lakes. In site 2, this ad-vective flow would follow a route located at the surface of the lake and at around 15 m of depth. There, this flow could enter a breach that ensures the connection with site 3. In the site 3 lake, the advective flow would exist at a depth between 15 to 22 m and it finally also leaves the lake around this depth. When an injection is performed at the swallow hole, a minor part of the solute arriving at site 2 will firstly follow this advective flow, while the remaining tracer is dispersed into the lake. In this first
Fig. 8 The BTCs observed in the site 2 lake at each fluorometer for an injection at the swallow hole (Q: 9 l/s)
Fig. 9 Concentration profiles performed in site 3 lake. Two profiles were realized: profile 1 in ascending the fluorometer from the bottom to the surface; profile 2 in descending the fluorometer. Those two profiles clearly show a higher dye tracer concentration around 20 m of depth
step, the tracer that has followed the advective flow quickly leaves the lake in an advective way and produces the first peak at site 4. The fact that this first flow keeps a very small disper-sion could be linked to a specific geometric feature that cannot be precisely defined as yet. In a second step, the remaining tracer that has spent time dispersing into the water is finally evacuated from the lakes by the same exit but in a slow and dispersive way. Regarding the BTCs recorded at the surface of the site 3 lake, they are single-peaked because the fluorometer there is not placed on the advective flow path and so it records only the dispersion of the tracer into the lake. As for the injec-tion made in site 3, it cannot produce a double-peaked BTC because it takes time for the tracer to disperse in the lake before reaching the advective flow feature.
Conclusion
This study reports surprising results brought about by field ex-periments. The existence of double-peaked BTCs due to solute transport through underground lakes is an exceptional fact that has been here observed. Numerous multisampling site tracer tests were performed to highlight this phenomenon. Original investigations, like a concentration profile and a depth-related tracer test within the lakes, led to an insight of the solute behav-ior. It appears that the dye tracer flows through the lakes in a non-linear way. These observations lead to the proposition of a conceptual model in which the presence of an advective flow responsible for the separation of the tracer plume is suggested.
A few studies have reported double-peaked BTCs as the result of solute transport through lakes or pools; however, this was brought out by physical laboratory experiments only
(Hauns and Jeannin1998; Field and Leij2012). The present study is, for its part, based on field observations and ends in a conceptual model which is an attempt to give a physical expla-nation to a remarkable natural phenomenon. In this sense, a few new perspectives can be expected from this work. Firstly, the conceptual model could be re-enforced by additional field in-vestigations. In particular, the screened casing at site 3 lake could be equipped with several fluorometers that would be placed at different depths during the entire recovery of an injection made at the swallow hole. Secondly, the conceptual model could be concretized in the form of a scaled physical model whose pur-pose would be to test the hypothesis of the advective flow and the resultant double peak. Finally, in order to quantify and add dimension to the physical processes that take place in the lakes, numerical modeling should be considered.
Acknowledgements The authors would like to thank theBArdennes et Gaume^ NPO for giving us access to the Furfooz Natural Reserve. Special thanks goes to Michel Pauwels, an experienced diver, whose precious information helped us to build the conceptual model and who was brave enough to take the casing to the bottom of the lake. The authors are grateful to the reviewers, in particular to Malcolm Field, whose re-marks improved the quality of this report.
References
Brouyère S, Rentier C (1997) About the influence of the injection mode on tracer test results. In: Kranjc A (ed) Tracer hydrology 97, Proceedings of the 7th International Symposium on Water Tracing. International Association of Tracer Hydrology (ATH) and Karst R e s e a r c h I ns t i t u t e Z R C S A Z U . B a l k e m a , R o t t e r da m , The Netherlands, pp 11–17
Fig. 10 New conceptual model showing the advective flow highlighted by the field investigations. The figure also displays the screened casing and fluorometers used in the investigations described in section‘Complementary investigations within the lakes’.
When the dye tracer enters the site 2 lake, some part of it follows this advective flow path and exits the lake quickly, while the remaining tracer disperses slowly into the volume of water that represents the lakes. After a while, the dispersed tracer also leaves the lake and produces the second peak visible at site 4 Hydrogeol J
Dewaide L, Bonniver I, Rochez G, Hallet V (2016) Solute transport in heterogeneous karst systems: dimensioning and estimation of trans-port parameters via multi-sampling tracer tests modelling using the OTIS (one-dimensional transport with inflow and storage) program. J Hydrol 534:567–578
Field MS (2002) The QTRACER2 program for tracer-breakthrough curve analysis for tracer tests in karstic aquifers and other hydrologic systems. EPA/600/R-02/001, US EPA, National Center for Environmental Assessment, Washington, DC
Field MS, Leij F (2012) Solute transport in solution conduits exhibiting multi-peaked breakthrough curves. J Hydrol 440–441:26–35 Field MS, Pinsky PF (2000) A two-region nonequilibrium model for
solute transport in solution conduits in karstic aquifers. J Contam Hydrol 44(3/4):329–351
Goldscheider N, Meiman J, Pronk M, Smart C (2008) Tracer tests in karst hydrogeology and speleology. Int J Speleol 37(1):27–40
Grey WG, Pinder GF (1976) An analysis of the numerical solution of the transport equation. Water Resour Res 12(3):547–555
Hauns M, Jeannin P-Y (1998) Tracer transport in underground rivers in karst: tailing effects and channel geometry. Bull Hydrogéol 16:123– 142
Hauns M, Jeannin P-Y, Atteia O (2001) Dispersion, retardation and scale effect in tracer breakthrough curves in karst conduits. J Hydrol 241(3–4):177–193
Jeannin P-Y, Groves C, Häuselmann P (2007) Speleological investiga-tions. In: Goldscheider N, Drew D (eds) Methods in karst hydroge-ology international contributions to hydrogehydroge-ology. Taylor and Francis, London, pp 25–44
Käss W (1998) Tracing technique in geohydrology. Balkema, Rotterdam, The Netherlands, 600 pp
Landau LD, Lifshitz EM (1987) Fluid mechanics, 2nd edn. Pergamon, Oxford, UK, 558 pp
Maloszewski P, Harum T, Benischke R (1992) Mathematical modelling of tracer experiments in the karst of Lurbach system. In: Himmelsbach T, Hötzl H, Käss W, Leibundgut C, Maloszewski P, Meyer T, Moser H, Rajner V, Rank D, Stichler W, Trimborn P, Veulliet E (eds) Application of tracer models, Steirische Beiträge zur Hydrogeologie [Styrian contribution to hydrogeologie], 6th International Symposium on Water Tracing: Transport Phenomena in Different Aquifers (investigations 1987–1992), vol 43. Joanneum, Graz, Austria, pp 116–158
Massei N, Wang HQ, Field MS, Dupont JP, Bakalowicz M, Rodet J (2006) Interpreting tracer breakthrough tailing in a conduit-dominated karst aquifer. Hydrogeol J 14(6):849–858
Morales T, Uriarte JA, Olazar M, Antigüedad I, Angulo B (2010) Solute transport modelling in karst conduits with slow zones during differ-ent hydrologic conditions. J Hydrol 390:182–189
Poulain A, Rochez G, Van Roy JP, Dewaide L, Hallet V, De Sadelear G (2017) A compact field fluorometer and its application for dye trac-ing in karst environments. Hydrogeol J.https://doi.org/10.1007/ s10040-017-1577-1
Schnegg PA, Doerfliger N (1997) An inexpensive flow-through field fluorometer. Proceedings of the 6th Conference on Limestone Hydrology and Fissured Media, la Chaux-de-Fonds, vol 2. Centre of Hydrogeology, University of Neuchatel, Neuchatel, Switzerland, pp 47–50
Schudel B, Biaggi D, Dervey T, Kozel R, Müller I, Ross JH, Schindler U (2003) Application of artificial tracers in hydrogeology: guideline. Bull Hydrogéol, 20(Spec Issue):1–91
Werner A, Hötlz H, Maloszewski P, Käss W (1997) Interpretation of tracer tests in karst systems with unsteady flow conditions. In: Leibundgut C, Gunn J, Dassargues A (eds) Karst hydrology: pro-ceedings of an international workshop held at Rabat, Morocco dur-ing the Fifth Scientific Assembly of the IAHS (23 April to 3 May 1997), IAHS Pub. no. 247, IAHS, Wallingford, UK, pp 15–26