DISSOLVED INORGANIC AND
PARTICULATE IODINE IN THE OCEANS by
GEORGE TIN FUK WONG
B.S., California State University. Los Angeles (1971)
S.M., Massachusetts Institute of Technology (1973)
SUBMITTED IN PARTIAL FULFILLMENT OF THE REQUIREMENTS FOR THE DEGREE OF
DOCTOR OF PHILOSOPHY at the
MASSACHUSETTS INSTITUTE OF TECHNOLOGY and the
WOODS HOLE OCEANOGRAPHIC INSTITUTION February, 1976
Signature of A h . .. .. . ..
Joint Progvm in Oceanography, ilIsachu-setts Institute of Technology - Woods Hole Oceanographic Institution, and Department of karth and Planetary
gciences, and Department'of Meteorology, Massachusetts Institute of Technology,
Certified I
h7-Certified by
---Accepted by
Chai ian, Joint Oceanography Committee in the Arth Sciences, Massachusetts Insti-tute of Technology - Woods Hole Oceano-graphic Institution
ACKNOWLEDGMENTS
I am much indebted to Dr. Peter Brewer, who has not only been a thesis advisor but also a precious friend
to me, for his timely and invaluable advice, patience,
guidance and encouragement which have made this work enjoy-able and possible.
Instructive discussions with Drs. Derek Spencer, John Edmond, Oliver Zafiriou, Vaughan Bowen and Carrell Morris at various stages of this work have helped to shape
the course of this study.
Drs. Peter Brewer, Oliver Zafiriou, Derek Spencer, John Edmond, Vaughan Bowen and Carrell Morris have
critical-ly reviewed the preliminary versions of this manuscript. Roy Smith, Alan Fleer, Susan Kadar and Janet Fredericks have provided valuable technical assistance and advice during cruises and sample analyses.
Dr. Michael Bender and the reactor staff at the Rhode Island Nuclear Science Center provided facilities,
laboratory space and technical assistance for neutron acti-vation analysis.
This work was supported at various phases by NSF Grant GA-13574, NSF-IDOE Grant GX 33295, NSF Grant DES
74-22292 and by a research fellowship from the Woods Hole Oceanographic Institution.
Finally, I wish to thank my parents for their sacrifices in their effort to provide opportunities for a
-2-higher education to their children, and, my wife for her
love, understanding and devotion which have made my life as
a graduate student enjoyable.
BIOGRAPHY
The author came to the United States in 1967 upon the completion of his high school education in Hong Kong. After spending a year at the Santa Ana College, he trans-ferred to the California State University, Los Angeles
where he subsequently received his B.S. degree in chemistry in 1971 with honors from the University and from the chem-istry department. He transferred to the Massachusetts Ins-titute of Technology in the same year and received a S.M. degree in oceanography in 1973. Since then, he has been a doctoral candidate in chemical oceanography in the joint program of the Massachusetts Institute of Technology and the Woods Hole Oceanographic Institution. He has been nomin-ated for membership in Alpha Gamma Sigma, Phi Theta Kappa, Phi Kappa Phi and Sigma Xi. He is an active member of the American Association for the Advancement of Science, the American Geophysical Union and the American Society of Limnology and Oceanography. He is married to the former Virginia Wai-Shu Chin. His contributions to the literature
are as follows:
Onak, T. P. and G. T. F. Wong (1970). Preparation of the pentagonal pyramidal carborane, 2,3,4,5-tetra carba-nido-hexaborane (6). J. Amer. Chem. Soc., 92, 5226. Wong, G. T. F. (1970). The preparation and structural
determination of 2,3,4,5-tetra carba-nido-hexaborane (6). Honors Thesis, B.S., California State University, Los
Angeles.
Groszek, E., J. B. Leach, G. T. F. Wong, C. Ungermann and T. Onak (1971). Carboranes from alkylboron hydrides. Inorg. Chem., 10, 2770-2775.
Wong, G. T. F. (1973). The marine chemistry of iodate. Thesis, M.S., Massachusetts Institute of Technology. Wong, G. T. F. and P. G. Brewer (1974). The determination
and distribution of iodate in South Atlantic waters. J. Mar. Res., 32, 25-36.
Brewer, P. G., G. T. F. Wong, M. P. Bacon and D. W. Spencer (1975). An oceanic calcium problem? Earth Plan. Sci. Lett., 26, 81-87.
Wong, G. T. F. and P. G. Brewer (1976). The determination of iodide in seawater by neutron activation analysis. Anal. Chim. Acta, 81, 81-90.
Wong, G. T. F. (1976). The distribution of iodine in the upper layers of the Equatorial Atlantic. Submitted to Deep-Sea Res.
Wong, G. T. F. and P. G. Brewer (1976). The marine chem-istry of iodine in anoxic basins. Trans. Amer. Geophys. Union (Abstract), 56, 1002. Submitted to Geochim.
TABLE OF CONTENTS Page Approval Pg... Biography. . .. . . .. .. . .. .. . . ... a 4 Table of Contents... 6 List of Figures . . . ... 9 L is t of Table s. . . ...
6
16
Chapter I. Introduction... 20 1. Introduction. ... *... 21 2. A brief review of some aspects of thegeochemistry of iodine... 25 3. The scope and organization of the
re search... 42
II. The analytical chemistry of iodine in
sea-water... 43 1. Introduction.o... '44 2. Historicalreview... 45
3.
The determination of iodate in seawater 50 4. The determination of iodide in seawaterby instrumental neutron activation
analys
is ...--.----...----
0 0 0 0
6 1
5.
The determination of iodine in marinesuspended matter...,... 84
-6-III. Field observations... 99
1. The distribution of iodine in the upper layers of the Equatorial Atlantic... 100
2. The marine chemistry of iodine in anoxic basins... 123
3.
The distribution of iodine in a coastal basin, the Gulf of Maine..--- 1544. The distribution of iodine in marine suspended matter... 167
IV. The interconversion of the dissolved iodine species in the ocean... 182
1. Introduction... 183
2. The thermodynamic properties of the aqueous iodine system... 184
3. The complexation of iodide in sea water 195 4. Chemical kinetics in the interconver-sion of aqueous iodine species... 199
5.
Biologically mediated interconversion of the iodine species..,... 2056. Previous laboratory studies... 209
7. Laboratorystudies... 211
8. A possible oceanic iodine cycle... 228
V. Concluding remarks.. ... 231
References.- ...
Appendix A. Dissolved iodine measurements in the Equatorial Atlantic during cruise
AII-83 (June, July, 1974)... 251 Appendix B. Dissolved iodine measurements and
hydrographic data from the Venezuela Basin and the Cariaco Trench during cruise
AII-79 . .. . .. . .. . .. .. ... 258 Appendix C. Dissolved iodine measurements and
hydrographic data from the Black Sea
during cruise CHAIN-120...* 263 Appendix D. Dissolved iodine measurements and
hydrographic data from the Gulf of Maine
during cruise AII-86... 266 Appendix E. Iodine content of suspended
particulate matter collected during the
GEOSECS Atlantic Expedition... 269
-8-LIST OF FIGURES
Figure Page
I-2-1 The vertical distribution of iodine at 120
O1'N, 158002'E in the North Pacific...
33
1-2-2 The cycle of iodine in the ocean... 40 11-3-1 A calibration curve for the colorimetric
determination ofiodate...---- 55 11-3-2 A comparison of data by the colorimetric
and the titrimetric methods...-.. 56 11-3-3 A profile of iodate determined on board
11-4-1 An analytical scheme for the determination
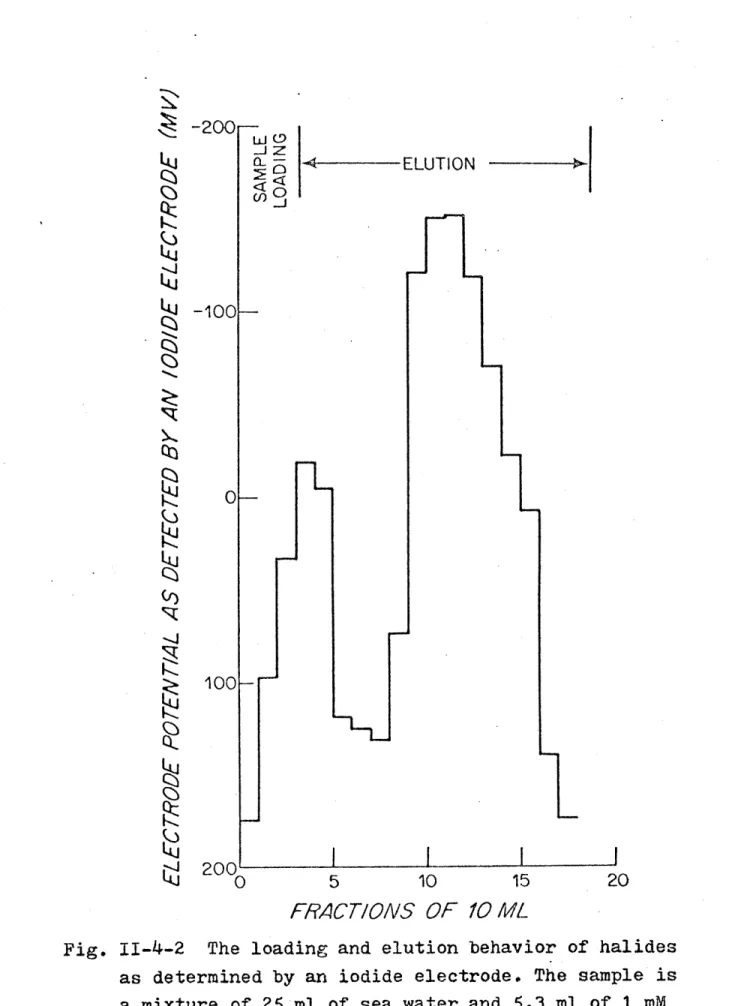
of iodide in seawater... 67 11-4-2 The loading and elution behavior of halides
as determined by an iodide electrode... 69 11-4-3 Changes in the concentration of total
halide in the eluate during loading and
elution of 250 ml of seawater... 71 11-4-4 The elution behavior of iodide from 250 ml
of seawater... 72 11-4-5 Test of the ion-exchange capacity of the
column during loading and elution of 1
liter of seawater... 74
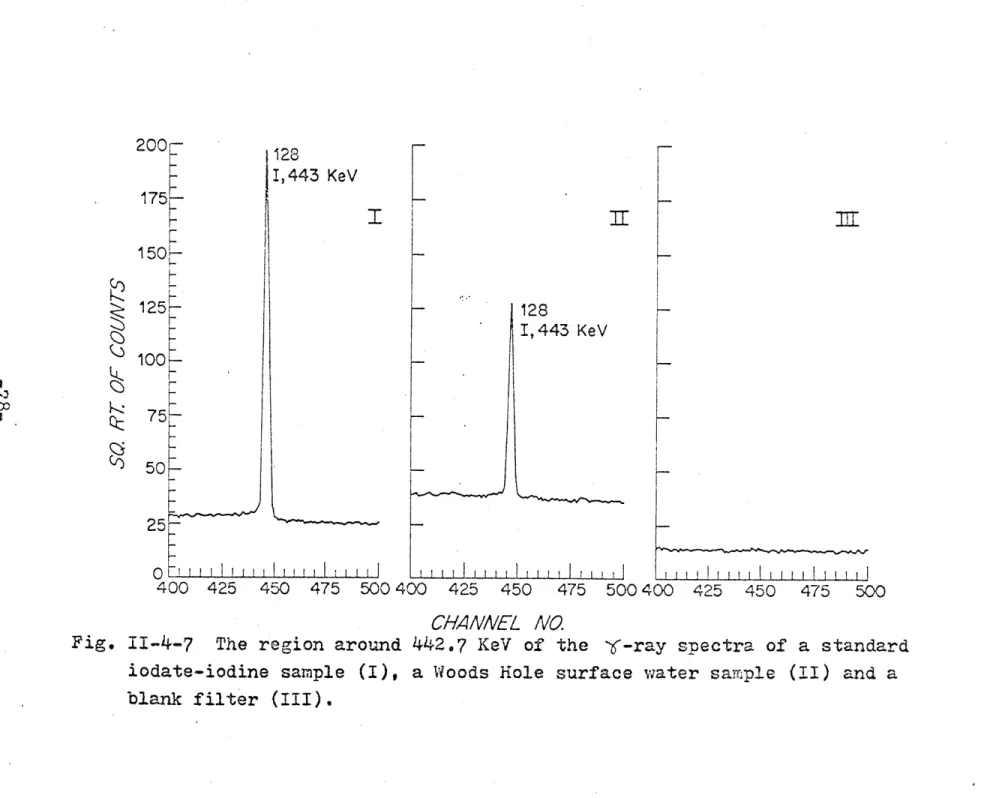
11-4-6 The 6-ray spectra of a standard iodate-iodine sample, a Woods Hole surface water
The region around 442.7 KeV of the Y-ray spectra of a standard iodate-iodine sample, a Woods Hole surface water sample and a
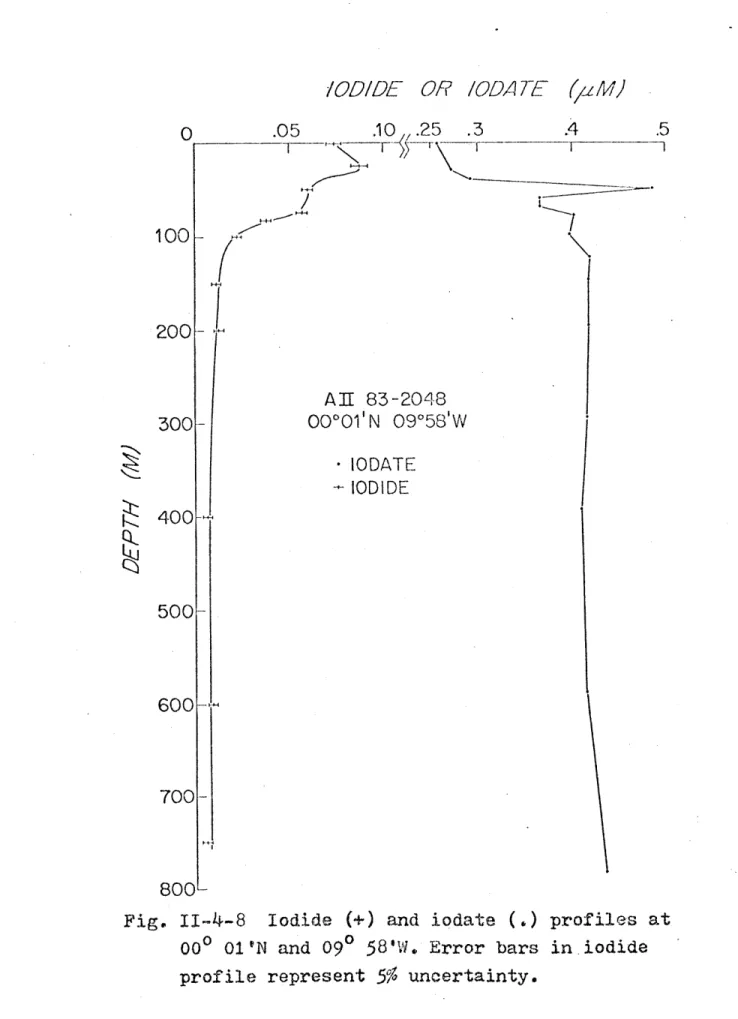
blank filter ... ... . . 78 11-4-8 Iodide and iodate profiles at 00001'N,
094 5 8'W ... *...*. . ...--. * 82
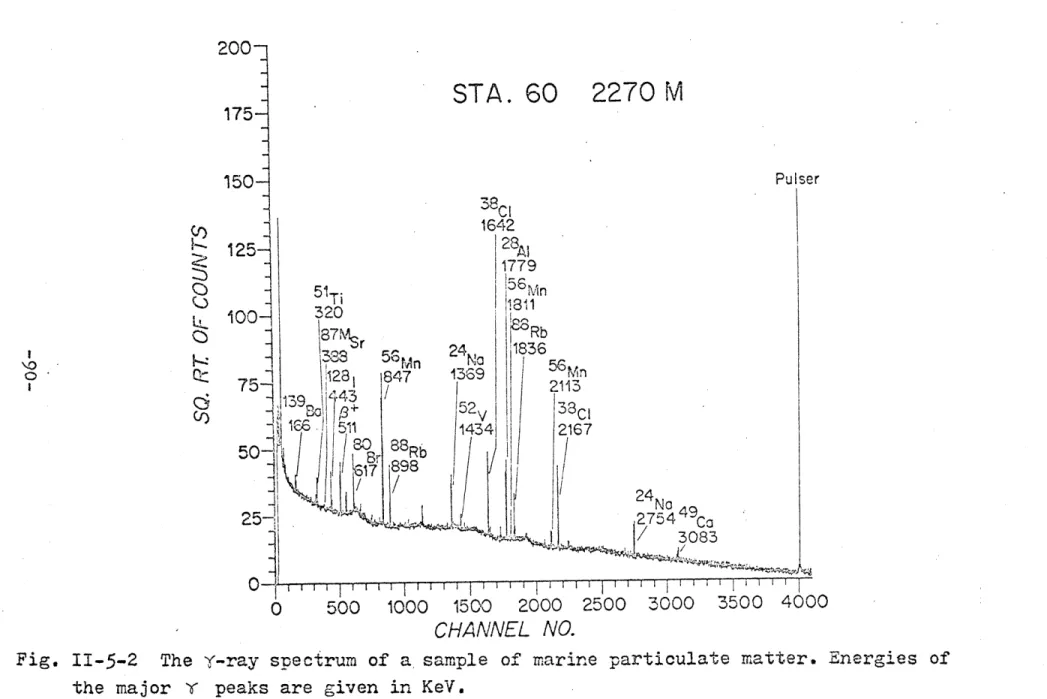
11-5-1 The i-ray spectrum of a standard... 89 11-5-2 The v-ray spectrum of a sample of marine
suspended matter.g... 90
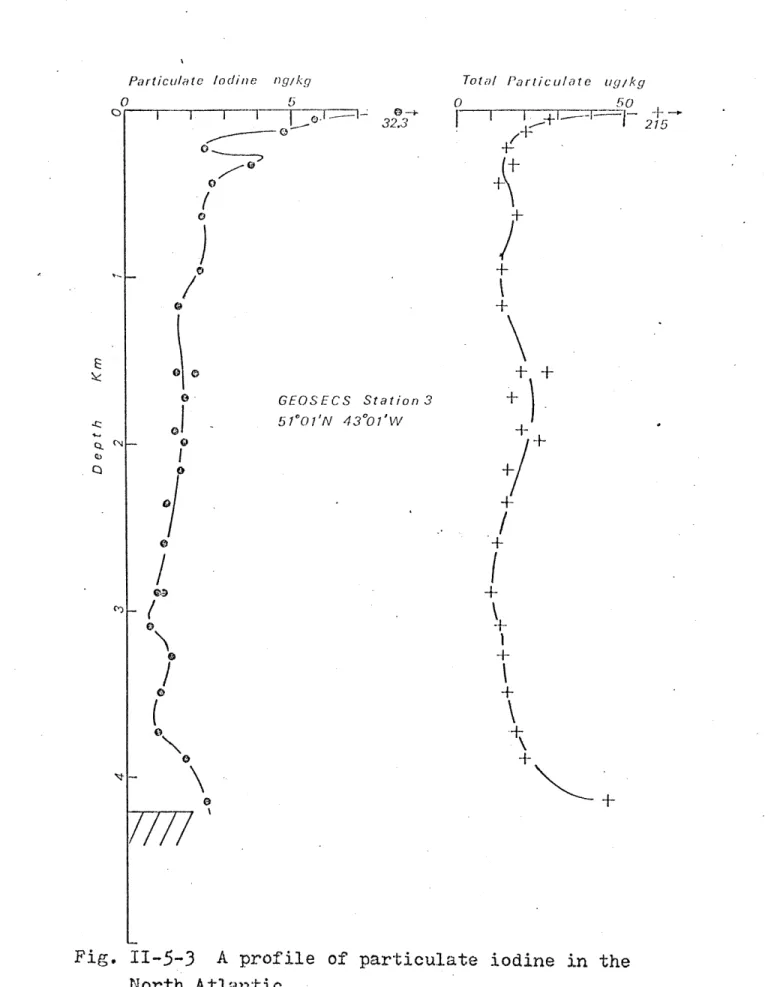
11-5-3 A profile of particulate iodine in the
North Alni... 97
III-1-1 The cruise track and station locations of
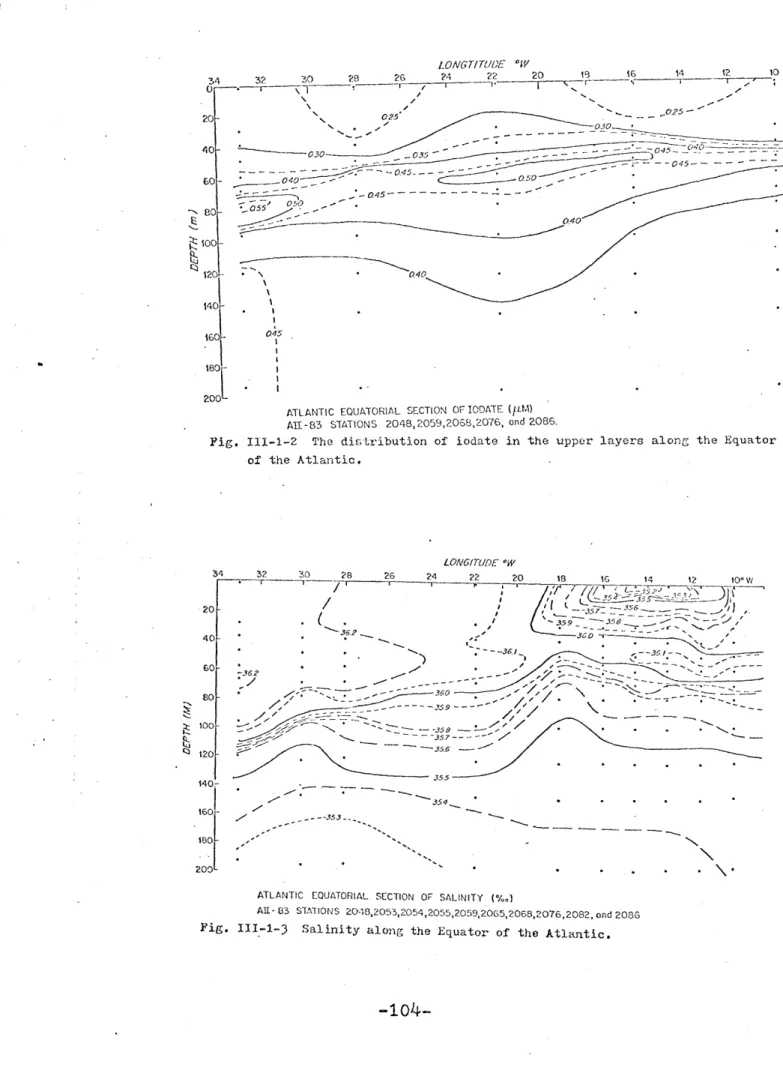
cruise AII-83... 102 111-1-2 The distribution of iodate in the upper
layers along the Equator of the Atlantic'... 104
111-1-3
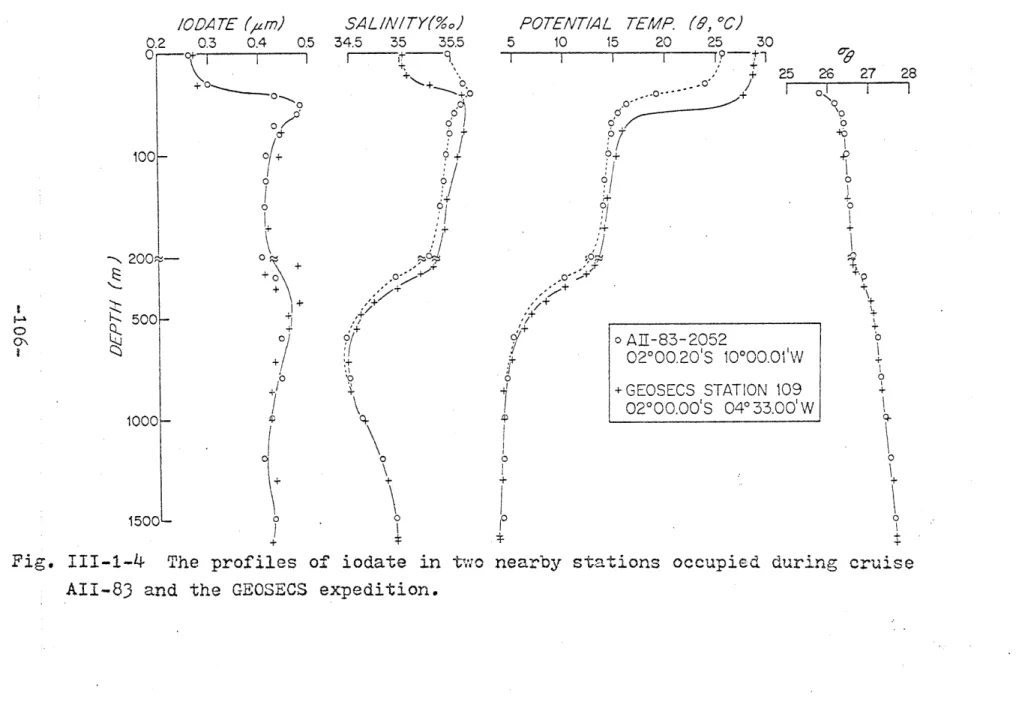
Salinity along the Equator of the Atlantic. 104 111-1-4 The profiles of iodate in two nearbystations occupied during cruise AII-83 and
the GEOSECS expedition... 106 111-1-5 The concentrations of iodate in the
Equa-torial Atlantic along 33W... 107 III-1-6 A section of salinity in the Equatorial
Atlantic along 33oW... 107 111-1-7 A section of oxygen in the Equatorial
Atlantic along 33W... 107 111-1-8 A section of the E-W current velocity in
-10-II-4-7
the Equatorial Atlantic along 330W... 107 111-1-9 The concentrations of iodate in the
Equa-torial Atlantic along 28lW... 109 III-1-10 A section of salinity in the Equatorial
Atlantic along 280W... ... 109 III-1-11 A section of oxygen in the Equatorial
Atlantic along28W... 109 111-1-12 A section of the E-W current velocity in
the Equatorial Atlantic along 28OW... 109 111-1-13 The concentrations of iodate in the
Equa-torial Atlantic along 220W... 111 111-1-14 A section of salinity in the Equatorial
Atlantic along 220W... 111 111-1-15 A section of oxygen in the Equatorial
Atlantic along 220... 111
111-1-16 A section of the E-W current velocity in
the Equatorial Atlantic along 22cW... 111 111-1-17 The concentrations of iodate in the
Equa-torial Atlantic along 160W... 112 111-1-18 A section of salinity in the Equatorial
Atlantic along 160W... 112 111-1-19 A section of oxygen in the Equatorial
Atlantic along 164W... 112 111-1-20 A section of the E-W current velocity in
the Equatorial Atlantic along 160W... 112 111-1-21 The concentrations of iodate in the
Equa-111-1-22
111-1-23
111-1-24
torial Atlantic along 100
A section of salinity in the Equatorial Atlantic along 10 0W... A section of oxygen in the Equatorial
Atlantic along 10 0W... A section of the E-W current velocity in the Equatorial Atlantic along 100W...
111-1-25 Profiles of iodate, iodide, phosphate and
T
at station AII-83-2086... 111-1-26 Profiles of iodate, iodide, phosphate andG- at station AII-83-2078... 111-1-27 Profiles of iodate, iodide, phosphate and
G at station AII-83-2068... 111-1-28 Profiles of iodate, iodide, phosphate and
T at station AII-83-2048... 111-2-1 Profiles of salinity and 9 in the Black Sea
at station CHAIN-120-1355,... 111-2-2 Profiles of salinity and 9 in the Cariaco
Trench...*... ... .... *
111-2-3 Positions of the stations in the Black Sea, the Cariaco Trench and the Venezuela Basin. 111-2-4 Profiles of iodate and iodide in the
Venezuela Basin at station AII-29-2033... 111-2-5 Profiles of iodate and iodide in the
Cariaco Trench at station AII-79-2038... 111-2-6 Profile of iodate in the Cariaco Trench at
-12-113 113 113 113 116 11? 118 119 128 130 133 135 136
station AII-79-2037---.---... 137 111-2-7 Profiles of iodate and iodide in the Black
Sea at station CHAIN-120-1355-.---.--- 138 111-2-8 A concentration diagram of the iodine
sys-tem in an aqueous solution at pH 8.1 and a
total iodine concentration of 0.5 uM... 141 111-2-9 Profiles of specific total iodine in the
Venezuela Basin, the Cariaco Trench and the
Black Sea... 144
111-2-10 The distribution of iodide, iodate and total iodine in the mixing zone of the Black Sa...,.,..147
111-2-11 The distribution of iodide, iodate and total iodine in the mixing zone of the
Cariaco Trench...,... 148 111-3-1 The cruise track and station locations of
cruise AI8*.*.-*.e*e,-.---156
111-3-2 Profiles of iodate, iodide and specific
total iodine at station AII-86-2122.--- 159 111-3-3 Profiles of Q', salinity and 9 at station
111-3-4 Profiles of phosphate, silicate and oxygen
at station AII-86-2122... 16o 111-3-5 Profiles of V., salinity and 9 at station
.161
oxygen at station AII-86-2138... 161 III-3-7 Profiles of G), salinity and 9 at station
AII-86-2151... 162 111-3-8 Profiles of iodate, phosphate, silicate and
oxygen at station AII-86-2151... 162 111-4-1 The cruise track and station locations of
the GEOSECS Atlantic expedition... 169 III-4-2 Typical profiles of particulate iodine and
total particulate matter... 173 111-4-3 A profile of the ratio of particulate iodine
to particulate scandium... 176 111-4-4 A section of particulate iodine in the
Western Atlantic from 75ON to
55
0S...177 111-4-5 The distribution of primary productivity
in the Atlantic0cean... 180 IV-2-1 A concentration diagram of the aqueous
iodine system at a pH of 8.1 and a total
iodine concentration of 0.5 um... 187 IV-2-2 The oxidation state diagram of the aqueous
iodine system... 189 IV-2-3 The electron free energy level diagram of
the iodine system and some other redox
coup es. .... ... ... .. ,. ... .... ... ... 192 IV-3-1 Potentiometric titrations of sea water and
a 0.5 M sodium chloride solution with
IV-5-1 A possible mechanism for the absorption of
iodide by brown algae... 207 IV-7-1 An apparatus for studying the
interconver-sion of iodine species... 212 IV-7-2 Dark auto-oxidation of iodide, experiments
1
to
3...,...
213
IV-7-3 Dark auto-oxidation of iodide, experiments
4 and
5...
214
IV-7-4 Rate of production of iodate in sea water
at 25 0 . . . 218 IV-7-5 The stability of elemental iodine in
various media... 223
LIST OF TABLES
Table Page
I-1-1 The calculated and observed ratios of the concentrations of the reduced species to the concentrations of the oxidized species in the nitrogen, arsenic and iodine systems
in the sea at a pH of 8 and a pE of 12.5... 23 1-2-1 Iodine content of rocks and minerals... 26 1-2-2 Iodine containing minerals... 27 1-2-3 The concentration of total iodine in
various geochemical reservoirs and agents.. 29 1-2-4 Ion pairing of the iodide ion with the
major ions in the ocean.,... 31 1-2-5 The concentration of iodine in marine
orgcanisms.. . . . . .. . . . .. . ... 35 I-2-6 Concentration factor of iodine in marine
11-2-1 Analytical methods for the determination of
dissolved iodine in sea water...,.... 46 11-3-1 Data for the calibration curves for the
colorimetric determination of iodate during
cruise AII-83...---... 54 11-4-1 Check of recovery of added radiotracer from
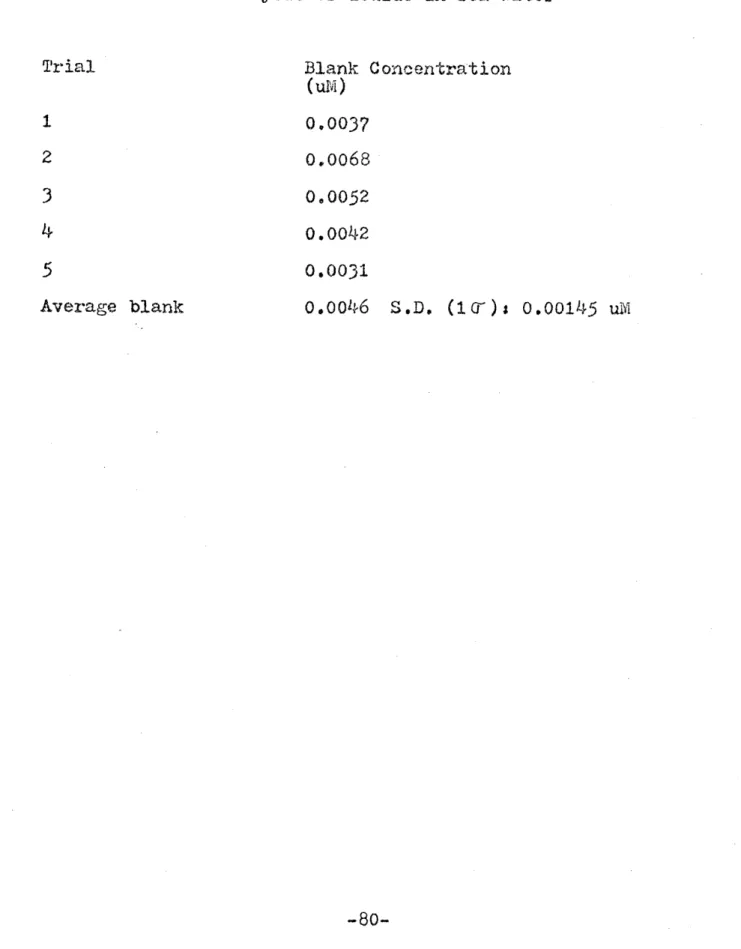
sea water... 75 11-4-2 Reagent blank of the instrumental neutron
activation analysis of iodide in sea water. 80
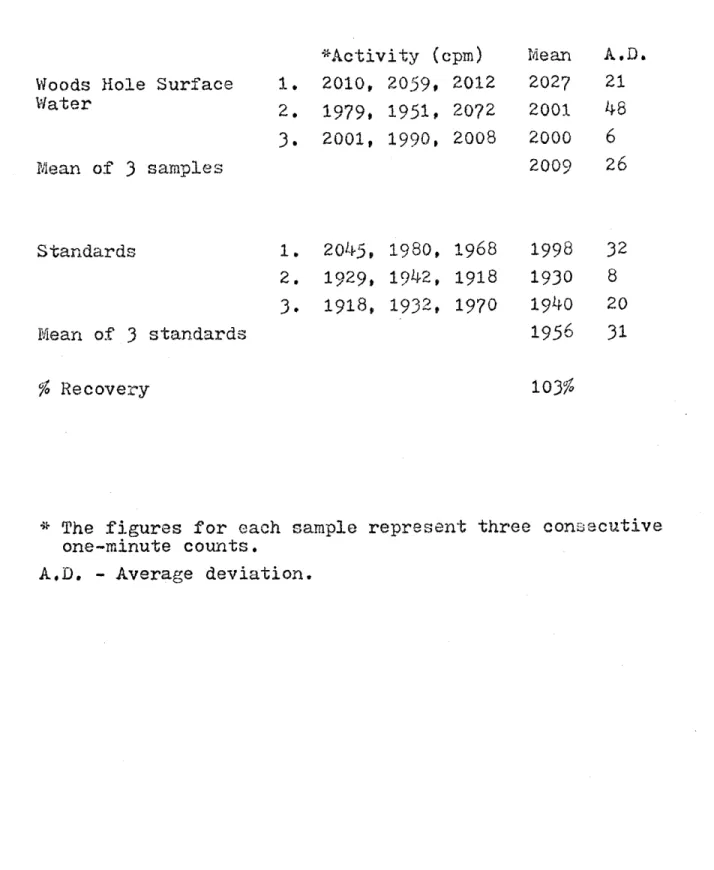
-16-11-4-3 Precision of repeated analyses of Woods
Hole surface water... . . .. 81
11-5-1 Blanks in the neutron activation analysis
of particulate iodine... 91 11-5-2 Check on flux and geometry variations... 94 11-5-3 Reproducibility of sample counts... 96 III-1-1 Properties at the iodate concentration
maxima. . .. .. .. * * 0 .. . ... . 115 111-2-1 The redox buffer capacity of oxygen and
sulfide in the mixing zone and the oxic
and anoxic layers... 142
111-4-1 Iodine content of particulate matter collected closest to the surface and the
bottom of the Atlantic... 171 111-4-2 Standing crops of particulate iodine in the
top 200 m of the Atlantic... 179 IV-2-1 The thermodynamic properties of some iodine
spe cie
s...
0...
*
0
185
IV-2-2 Thermodynamic properties for the
intercon-version of iodine species... 186 IV-2-3 Data for the construction of the oxidation
state diagram of the aqueous iodine system. 190 IV-2-4 The thermodynamic properties of some common
redox couples in natural waters... 193 IV-4-i The dark auto-oxidation of iodide... 200 IV-4-2 The disproportionation of hypoiodite... 204
ABSTRACT
DISSOLVED INORGANIC AND
PARTICULATE IODINE IN THE OCEANS GEORGE TIN FUK WONG
Submitted to the Department of Earth and Planetary Sciences on February 20, 1976 in partial fulfillment of the requirements for
the degree of Doctor of Philosophy
Analytical methods have been developed for the determination of iodate, iodide and particulate iodine in sea water. Iodate is converted to tri-iodide and the absor-bance of tri-iodide at 353 nm is measured. The precision of
this method is ca. +3%. Iodide is first separated from most other anions by an AG 1-x8 anion exchange column and then precipitated as palladous iodide with elemental palladium
as the carrier. The precipitate is analyzed by neutron acti-vation analysis. The precision of the method is
+5%
and thereagent blank is 0.005 uM. Marine suspended matter is col-lected by passing sea water under pressure through a 0.6 u
(37 mm diameter) Nuclepore filter. The iodine content of the particles is determined by neutron activation analysis. The method has excellent reproducibility and the filter blank is
ca. 3 ng.
Iodate is depleted in the surface waters of the Equatorial Atlantic. The depletion is more pronounced than in the Argentine Basin and possibly reflects the higher pro-ductivity in the equatorial area. Superimposed on this fea-ture, a thin lens of water, of a few tens of meters thick and with high iodate concentrations, can be traced across the Atlantic. Along the equator, this lens occurs at 80 m at 330W and rises upwards to 55 m at 100W and it coincides with a core of highly saline water which is characteristic of the Equatorial Undercurrent. Longitudinal sections reflect the complexity of the equatorial current system. At least three cores of water with high iodate concentrations may be iden-tified. These waters may be transported to the equatorial region from the highly productive areas along the north-west-ern and westnorth-west-ern African coasts and the Amazon plume.
In anoxic basins, the concentration of iodide in-creases rapidly in the mixing zone from 0.02 uM to 0.44 uM in the Cariaco Trench and from 0.01 uM to 0.23 uM in the Black Sea. The iodate concentration, meanwhile, decreases to
zero. A maximum in the total iodine to salinity ratio is ob-served just above the oxygen-sulfide interface (15 to 17
-18-nmoles/g); it is suggestive of particle dissolution in a strong pycnocline. Below the interface, the total iodine to salinity ratio is constant at 12.3 nmoles/g in the anoxic
zone of the Cariaco Trench, whereas, in the Black Sea, it increases with depth from 10.0 to 19.4-nmoles/g and suggests a possible flux of iodide from the sediments. By considering the distribution of iodate and iodide in oxic and anoxic
basins and our present analytical capability, the lower limit of the pE of the oceans is estimated to be 10.7. Thermodyna-mic considerations further suggest that the iodide-iodate
couple is a poor indicator for the pE of the oceans with a limited usable range of 10.0 to 10.7.
In the Gulf of Maine during the winter of 1974 to 1975, the effect of winter mixing was conspicuous. Uniform concentrations of iodide and iodate were observed in the mixed layer above the sill. The absence of a depletion of
iodate and the low iodide concentration (0.04 uM) in the sur-face waters reflect the low biological activity in this
re-gion during winters.
Profiles of particulate iodine are characterized by high concentrations in the euphotic zone (>5 ng/kg), and
lower concentrations (<2 ng/kg) at greater depths. Occasion-ally, high concentrations have also been observed in the
nepheloid layer. The iodine-containing particles are probably biogenic. A section in the Western Atlantic from 750N to 550S shows evidence of the transport of particles along isopycnals and the re-suspension of surface sediments to considerable distance from the bottom. The standing crops in the top 200 m may be qualitatively correlated with the primary producti-vity.
Thermodynamic considerations show that iodide is a metastable form at the pH of sea water. Laboratory studies
fail to show the oxidation of iodide at measurable rates.
Elemental iodine is unstable in sea water and undergoes hydro-lysis to form hypoiodous acid in seconds. Hypoiodous acid is also unstable and has a life time of minutes to hours. It may react with organic compounds to form iodinated derivatives or it may be reduced to iodide by a reducing agent. The dispro-portionation of hypoiodite to form iodate seems to be a
slower process. A possible chemical cycle for iodine in the marine environment is proposed.
Thesis Supervisor: Peter G. Brewer Title: Associate Scientist
Department of Chemistry
Woods Hole Oceanographic Institution Woods Hole, Massachusetts.
CHAPTER I. INTRODUCTION
-20-1.1 Introduction
This thesis presents an investigation on the mar-ine chemistry of the element iodmar-ine, a multi-oxidation-state element known to be in redox dis-equilibrium, in an attempt to gain a better understanding concerning biological-chemi-cal interactions in the ocean.
Ever since Sillen's classic paper on ' the physi-cal chemistry of sea water' (1961), many attempts have been made to examine the controls on the chemical composition of
the oceans by computing the composition of an equilibrium mixture from the existing thermodynamic information (Garrels
and Thompson, 1962; Sillen, 1963; Holland, 1965; Kramer, 1965; Zirino and Yamamoto, 1972). There are two basic assum-ptions in this model. First, that the ocean is a closed sys-tem and secondly, that sufficient time is available for the attainment of a chemical equilibrium. However, the ocean in reality is not a closed system as there are frequent exchan-ges of both energy and matter among the atmosphere, hydros-phere and the lithoshydros-phere. Moreover, since different ele-ments have different residence times in the ocean varying
from 100 years for aluminum to 108 years for chloride
(
Brewer, 1975 and references cited therein), it is unclearthat there is sufficient time for all elements to reach a chemical equilibrium. Thus, it is not surprising that 'ex-ceptions' are often observed and, even in his classic paper,
occur in some elements.
Dis-equilibria are especially noticeable in the bio-active and multi-oxidation-state elements, Some of the better known examples are: iodide-iodate, ammonia-nitrogen-nitrite-nitrate and arsenite-arsenate (Goldberg, 1963; Riley and Chester, 1971; Johnson and Pilson, 1972). Under the
oceanic conditions of a ph of 8 and a pE of 12.5 (Sillen, 1961), the reduced species in all these systems should be undetectable within the limits of our present analytical
capabilities. However, significant quantities of these re-duced species are often found. The predicted and observed concentrations of the different species in these systems are summarized in table I-1-1.
At least two processes are involved in maintaining an observed redox dis-equilibrium. The first one is the per-turbation of a stable system to produce the unstable species. This reaction will be thermodynamically unfavorable. The
production of these unstable species such as iodide, arsenite and nitrite has often been attributed to biological activity
(Tsunogai and Sase, 1969; Johnson, 1972; Fiadeiro and Strick-land, 1968) for a number of reasons. First, organisms can utilize solar energy through photosynthetic processes and they may subsequently use this energy, directly or indirect-ly, to drive these thermodynamically unfavorable reactions. Secondly, organisms possess complicated enzyme systems which can be used as catalysts to lower the activation energies
-22-Table I-1-1 The calculated and observed ratios of the concentrations of the reduced species to the concentrations of the oxidized species in the nitrogen, arsenic and iodine systems in the sea at a pH of 8 and a pE of 12.5
Reaction log K log of log of Concentration
Calculated Observed Observed
Ratio Ratio
NO ~ + 2H+ + 2e~ = NO2 ~ + H20 28.3 (NO2) -12.9 35 (NO~) = 3 x 10⁻⁵
(NO3 (NO2 ) = 10 -8 * + NO ~ + 10H+ 8e = NH + + 3H20 119.2 (NH) = -61.8
-3.5
(N+) = 108M** (NO )( 1 * (3 78 atm pTX7 NO ~ + 6H+ + 5e~=
N2(g) + 3H20 105.25 (pW 2 2 3 2___ = -5.85 4.5 (NOHAs04= + 4H+ + 2e~ = HAs02 + 2H20 30.9 (HAs02) = -26.5 -0.2 (HAsOL~) = 0.05 uM
(HA.sO)
103 + 6H+ + 6e~ = I~ + 3H20 110.1 = -13.5 -0.4 (103~) = 0.5 udMf
(103 (1-) = 0 .2 um"
* Wada and Hattori (1972) ** Sagi (1969)
. .
of these reactions. Thirdly, organisms need an electron
acceptor during their metabolic processes. The primary elec-tron acceptor for aerobic organisms is oxygen. In the absence of oxygen, some organisms may use in succession nitrate,
sulfate and carbon dioxide as the terminal electron acceptor. During such processes, other species may be directly or
in-directly reduced.
The second process is the tendency to re-esta-blish the stable system. The rate of this thermodynamically favorable process will determine the persistence of the
dis-equilibrium. For example, although molecular nitrogen is unstable relative to nitrate (table I-1-1), it amounts to 78% of our atmosphere and its presence is ubiquitous in our oceans. Sillen (1961) suggested that its presence is due to the high internal energy barrier of the N-N bond which
greatly reduces its rate of oxidation. However, although this step is thermodynamically favorable, the possibility of biological mediations such as nitrification is not ruled out, and, in such cases, the rate of the reaction may either be enhanced or retarded.
In this study, I have chosen to use the iodine system to illustrate some of the implications of these con-cepts on the chemistry of the oceans.
-24-1.2 A brief review of some aspects of the geochemistry of iodine
1.2.1 Occurrence
Iodine, as an element, was not recognized until the early nineteenth century when Courtois isolated elemen-tal iodine from seaweed (Courtois, 1813). Elemenelemen-tal iodine has not been detected in the lithosphere, except as small traces in certain mineral springs. However, as iodide and iodate, it occurs widely as a trace constituent (Anonymous, 1951; Sneed et al., 1954; Hills, 1956; Fuge, 1974). Table 1-2-1 summarizes the iodine contents of various rocks and minerals. Minerals having iodine as an essential consti-tuent are rare although dietzeite and lautarite have been found in the Chilean saltpetre deposits. A list of the known iodine-containing minerals is presented in table I-2-2.
The history of investigations on the chemistry of iodine in marine environments has been briefly reviewed by Riley (1965a). He traced the first study to 1825 when Pfaff detected iodine in Baltic Sea water. This report was later confirmed by Laurens (1835) who found iodine in French
coastal water. Early investigators reported a wide range of concentrations from 0.017 ug/l (Macadam, 1852) to 8000 ug/l
(Marchand, 1855). Since then, a series of measurements have been made (Reith, 1930; Skopintsev and Michailovskaya, 1933; Dubravcic, 1955; Sugawara et al., 1955; Sugawara and Terada,
Table 1-2-1 Iodine content of rocks and minerals* Rock Type Amphibolite Basalt Diabase Gneiss Granite Limestone Marble Mica Schist Porphyry Pumice Quartzite Iodine Content (ppm) 0.25-0.38 0.31-0.80 0.49-1.04 0.38 0.20-1.25 0.44 0.07-1.98 0.54 0.38-0.54 0.25 1. 10-3.70 Mineral Type Apatite Biotite Calcite Cinnabar Cuprite Dolomite Fluorite Gypsum Limonite Pitchblende Pyrite Serpentine Wulfenite Iodine Content (ppm) 0.23-0.44 0.50 0.23 0.50
3.8-4000
0.32 0*55 0.25-0.2? 0.75 0.94 0.20 0.38 8.56* Data from Hills (1956).
-26-Table I-2-2 Iodine containing minerals*
Mineral Name Formula
Coccinite
Hg2i2
Cuproiodargyrite (Ag, Cu)I
Iodembolite Ag(Br, I, Cl)
Iodobromite 2AgCl, 2AgBr, AgI
lodargyrite AgI
Marshite
Cu212
Miersite 4AgI, CuI
Salesite CuIO OH
Schwarzembergite Pb(I, Cl)2, 2Pb0
Tocornalite (Ag, Hg)I
Dietzeite 7Ca(IO 3)2 , 8CaCrO04
Lautarite Ca(IO
3)2
1957; Barkley and Thompson, 1960a, 1960b; Voipio, 1961; Kappanna et al., 1962; Tsunogai, 1971a, 1971b; Tsunogai and Henmi, 1971; Liss et al., 1973; Wong and Brewer, 1974), and, presently, most investigators agree that the concentration
of total dissolved iodine in sea water is about 60 to 70 ug/l (0.5 u'M) (Goldberg et al., 1971).
Relative to sea salt, iodine is more concentrated in the atmosphere, in rain, in river waters and in inter-stitial waters. Surface sediments also have high iodine concentrations. The concentrations of iodine in natural waters, sediments and the atmosphere are summarized in
table 1-2-3.
-28-Table 1-2-3 The concentration of total iodine in various geochemical reservoirs and agents Material Sea water Atmosphere Aerosol Gaseous phase Rain water Concentration Range 0.5-25 ng/SCM 2,4-18.3 ng/SCM 1-15 ug/kg River water Interstitial water Surface sediment 0.35-1.9 mg/kg 121-900 ppm Average Concentration 60 ug/kg 2 ng/SCM 6 ng/SCM 4 ug/kg 7 ug/kg 1 mg/kg 300 ppm
I/Cl
3x10⁻⁶ 1x10⁻³ 3x10~ 5x10-39x10~
4 Reference Goldberg et al. (1971) Duce et al. (1965) Duce et al. (1965) Miyake and Tsunogai(1963)
Turekian (1971) Bojanowski and Paslawska (1970)
Price and Calvert
(1973)
3
1.2.2 The speciation of dissolved iodine in sea water
Thermodynamic calculations show that iodate should be the only detectable iodine species in the sea (Sillen, 1961). However, it has been long recognized that at least two species of iodine are present. Winkler (1916) suggested that they are iodate and iodide. The identity of the
oxid-ized species later developed into a controversial subject. Sugawara (1957) supported Winkler's view of iodate as the
oxidized species while Shaw and Cooper (1957) thought that hypoiodous acid might be the dominantv oxidized species ins-tead. Later investigations by Sugawara and Terada (1958) and Johanneson (1958) confirmed the presence of iodate and Shaw and Cooper (1958) subsequently retracted their hypothesis. The fraction of the inorganic iodide that may be present as
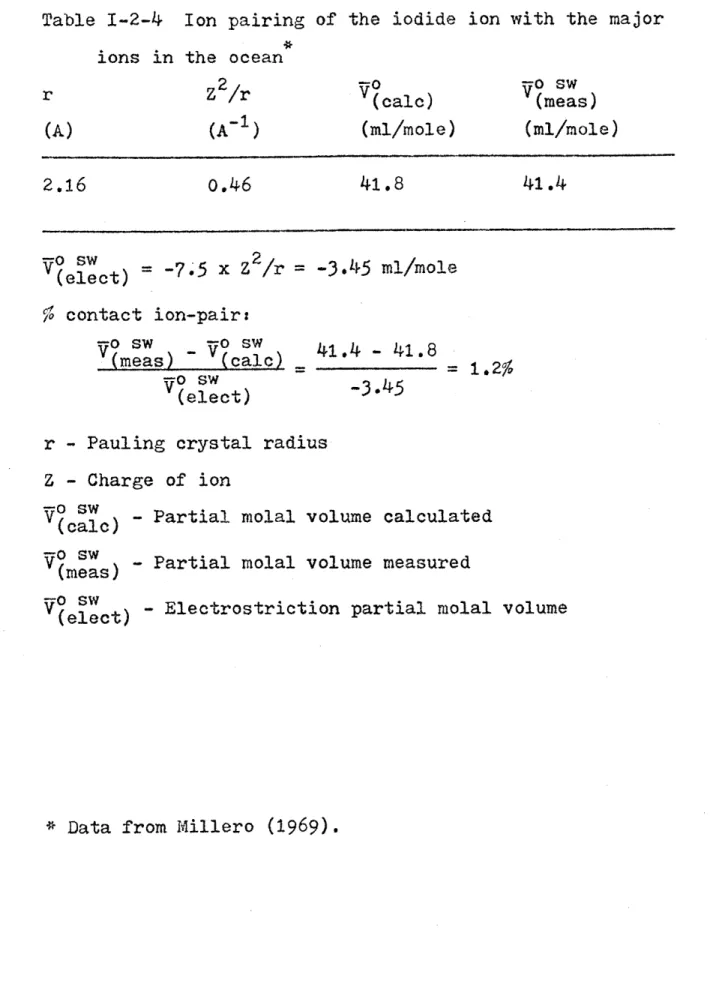
ion pairs with the major ions can be estimated from partial molal volumes (Millero, 1969). It is negligible (table 1-2-4). Recently, the possibility of the presence of 'organic
iodine' has been proposed by Truesdale (1975). He claimed concentrations of up to 501 of the total dissolved iodine in the surface waters of the Irish Sea. Lovelock et al. (1973) detected the presence of methyl iodide. However, its kinetic stability in sea water is low and it is susceptible to ex-change reactions with chloride ions to form iodide ions ins-tead (Zafiriou, 1975). The present discussion will deal only with the inorganic species.
-30-Table 1-2-4 Ion pairing of the iodide ion with the major ions in the ocean
Vo
(calc) (ml/mole) -o sw (meas) (ml/mole)2.16
o.46
41.8
41.4
(ect) = -7.5 x Z 2/r = -3.45 ml/mole N contact ion-pair:Yo
sw _ go sw (meas) (cal) (ect) 41.4 - 41.83=
1.42%
-3.45
r - Pauling crystal radius Z - Charge of ion
YO sw Partial molal volume calculated
(cae) -Prilroa ouecluae
V - Partial molal volume measured (meas)
lct) - Electrostriction partial molal volume
* Data from Millero (1969). r
(A)
2 Z /r
1.2.3 The distribution of iodine in the oceans
The average concentration of total dissolved iod-ine in the oceans is about 0.5 um (64 ug/l) (Goldberg et al., 1971). The ratio of iodide to iodate varies with depth and with geographical locality. The concentration ranges of iodide and iodate in the open oceans are <0.01 uM to 0.2 uM and 0.2 uM to 0.5 uld respectively (Tsunogai and Henmi, 1971). Iodide maxima and corresponding iodate minima are often
found in surface waters. Below the euphotic zone, iodide decreases to below the detection limit of about 0.01 uM while iodate increases to an approximately constant level. Low but significant iodide concentrations have been observed
in bottom waters (Tsunogai, 1971b; Tsunogai and Henmi, 1971). Typical profiles of iodide and iodate are shown in figure 1-2-1. The distribution of organic iodine in the water col-umn is unknown. The concentration of iodine in marine sus-pended matter has not previously been measured.
-32-S 0.1 1000 lodide 2000
-
3000.-0.2 -0.3 0.4 pM 40001-5000!71
Fig. 1-2-1 The vertical distribution of iodine at 12001'N,
158002'E in the North Pacific where the depth is
1.2.4 The biogeochemistry of iodine
The presence of measurable amounts of iodide in the oceans implies that the iodine system in the sea is not at chemical equilibrium with the 02-H20 system. Sugawara and Terada (1967) found that the alga Navicula can interconvert iodate and iodide. Tsunogai and Sase (1969) demonstrated that bacteria that are capable of reducing nitrate to nit-rite, or their enzyme extracts, can also reduce iodate to iodide. Thus, they proposed the enzymatic reduction of iod-ate to iodide using nitriod-ate-reductase as the catalyst.
Tsunogai and Henmi (1971) later observed that the concentrations of iodide in the surface waters of various parts of the Pacific can be qualitatively correlated to
their primary productivity. Wong and Brewer (1974) reported that in the Argentine Basin, iodate is linearly related to the micronutrients phosphate and nitrate, and consequently to apparent oxygen utilization (AOU) as well. They obtained the molar ratios of AOU:NO ~:P0~3:IO ~ of 2440:357:23:1. These relationships and the recent detection of methyl
iodide (Lovelock et al., 1973), which is a possible metabo-lite, in sea water, suggest that iodine may be intimately involved in the marine biochemical cycles.
Indeed, iodine can be found in the body tissue of all marine species (Hansen, 1963). (The concentrations of
iodine in various organisms are shown in tables 1-2-5 and 1-2-6.) It is an essential nutrient for red and brown
-34-Table I-2-5 The concentration of iodine in marine organisms Iodine Reference
Content
(ppm dry weight) I. Plant Plankton Brown algae Marine algae Indian sea weed II. AnimalsCoelenterata Mollusca
Echinodermata Crustacea
III. Hard tissues Red algae (CaCO 3) Porifera (CaCO3 ) Porifera (SiO2 Corals (CaCO 3) 300 1500 4-500 104 15 4
6
1 Vinogradov (1953) Vinogradov (1953)Young and Langille (1958)
Young and Langille (1958)
Pillai (1956) Vinogradov Vinogradov Vinogradov Vinogradov
55
4800 2100 5000 Vinogradov Low (1949) Low (1949) Vinogradov(1953)
(1953) (1953) (1953) (1953) (1953)Table 1-2-6 Concentration factor of iodine in marine organisms Concen-tration Factor I. Plant Plankton Brown algae Brown algae Algae Marine algae Gracilaria foliifera II. Animal Fish Shrimp Sea urchin Shell fish III. Hard tissue
Shell fish shell 1200 6200 3000-10000 184
500-60000
150 4 30 39 1 Reference Bowen (1966) Bowen (1966)Mauchline and Templeton (1964)
Hiyama and Khan (1964) Young and Langille (1958)
US Dept. of Interior (1966)
Hiyama and Khan Hiyama and Khan Hiyama and Khan Hiyama and Khan
Hiyama and Khan
(1964) (1964) (1964)
(1964)
(1964)-36-algae (Bowen, 1966) and Shaw (1959, 1962) reported that only iodide can be absorbed. Marine plankton also take in and excrete iodine, mostly in the form of iodide (Kolemainen, 1969; Kuenzler, 1969). For land plants, a suitable amount of iodine is actually necessary for optimal growth (Hanson, 1963) and it is also essential for mammals (Bowen, 1966). However, although iodine has long been classified as a bio-phile (Goldschmidt, 1954) and its metabolic-pathways in the higher mammals have already been intensively studied (Gross,
1962), its physiological functions in marine organisms in general are not well documented, Thus, the link between
iodine and biological activity in the sea is still based on indirect observations.
1.2.5 Iodine in the sediments and interstitial waters Price and co-workers (Price et al., 1970; Price and Calvert, 1973) have studied the distribution of iodine
in sediments. They observed high iodine content in surface sediments which decreased rapidly with depth and also
decreased from oxidizing to reducing sediments. A linear relationship between iodine and organic carbon content was shown. Shishkina and Pavlova (1965) have also reported
enrichment of iodine in sediments and the iodine content was found to increase with increasing organic content and
the degree of fineness of the sediments. Bojanowski and Paslawska (1970) measured iodine in interstitial waters and reported the range of iodine concentrations to be 0.35
to 1.9 mg/kg. Recently, Pavlova and Shishkina (1973) further reported that the concentration of iodine in intersitital waters increases with depth. These observations suggest
intense diagenesis and post-depositional migration of iodine in recent sediments and indicate a possible flux of iodine from the sediments into the ocean. This was proposed by Tsunogai (1971b) who observed a low but significant excess
of iodide in the bottom waters.
-38-1.2.7 The marine geochemical cycle of iodine
Since iodine is involved in many geochemical pro-cesses as described earlier, its geochemical cycle will no doubt be complex. Miyake and Tsunogai (1963) presented a scheme for the cycling of iodine in the oceans and it has subsequently been modified twice (Tsunogai and Sase, 1969; Tsunogai, 1971b). The latest version is shown in figure 1-2 -2. Many of the values of the fluxes involved are specula-tive and unconfirmed. However, the relaspecula-tive magnitudes of the processes in the cycle are worth noting.
The permanent loss of iodine to the sediments by burial is the smallest flux. It is at least three orders of magnitude smaller than other fluxes and suggests the cyclic nature of iodine in the water column. Three cycles can be readily identified. By far the most important cycle quanti-tatively is the incorporation of iodine into the organisms in the surface layers and subsequent re-mineralization at depth. The regenerated iodine is transported back to the euphotic zone by advection and diffusion. A secondary, and possibly significant, cycle is the sedimentation of iodine containing particles which undergo diagenesis in the sedi-ments. The dissolved iodine thus formed diffuses back into the water column. The quantitatively almost insignificant cycle is the input of iodine from river runoff and fallout and the removal by transferring iodine from the oceans to
River Rain 011 005 Rain River o O . 5 Evapor 0 0 .l 001. n3 67(net) < - Org. 33 A67 100- 347 V34 Org. 45 A 1000 _ _ 1-8 2-0 0 6 1-2 7 44 12 Bottom 0 OOCO5
Fig. 1-2-2 The cycle of iodine in the ocean. The figures indicated are the annual rates in a unit of 10
g at/m2-yr or 3.6 x 10¹⁰ g at/yr in the whole ocean. (Tsunogai, 1971b)
-40-1.2.6 Iodine in the atmosphere
Since the report of an enrichment of iodine in the atmosphere and especially in the marine atmosphere (Rankama and Sahama, 1949; Goldschmidt, 1954; Duce et al.., 1963), much effort has been devoted to study the atmospheric
chem-istry of iodine. It is generally accepted that the ocean is the most likely source of the excess iodine in the atmos-phere. However, the mechanism for the transfer of iodine from the ocean into the atmosphere is still unclear. Miyake
and Tsunogai (1963) suggested that the transfer is accom-plished by the evaporation of the volatile elemental iodine which may be formed by the photo-oxidation of iodide
accord-ing to the reaction
21 + 202 + 2+ + hv I2 + H20 (1-2-1)
Others (Bolin, 1959; Dean, 1963) favored the transfer of organic iodine into the atmosphere by a bubble bursting mechanism. The volatile methyl iodide has been suggested as a possible candidate (Lovelock et al., 1973). Seto and Duce (1972) found in their laboratory experiments that both the organic and the gaseous iodine are important in deter-mining the total iodine enrichment on marine atmospheric particles.
1.3 The scope and organization of the research
My efforts in studying the marine chemistry of iodine can be sub-divided into three sections. First, tech-niques were developed for the analysis of dissolved iodine
in both oxidation states, namely, iodate and iodide, and also for particulate iodine with improvements in simplicity, sensitivity and precision over the existing methods. Then, samples were collected for analysis from specific geogra-phical areas with distinct characteristics in their produc-tivity or oxidation potential. Data for dissolved iodine have been obtained from the Equatorial Atlantic, the Black Sea, the Cariaco Trench, the Venezuela Basin and the Gulf
of Maine. Samples of marine suspended matter were obtained from the Atlantic through the GEOSECS (Geochemical Ocean Sections Study) program. Laboratory experiments have also
been designed to study the stability, and the mechanisms for the interconversion, of the iodine species in sea water.
II.1 Introduction
Since iodine is present in the oceans at the uM level, it is considered a trace element. The concentration ranges of iodate and iodide in the open oceans are usually 0.2 to 0.5 uM and <0.01 to 0.2 uM respectively. With such low abundances and narrow ranges of concentrations, precise and sensitive analytical techniques are absolutely necessary for reliable quantitative studies. I have developed a suit-able method for measuring iodate in the oceans with a preci-sion of better than 1% in an earlier study (Wong, 1973; Wong and Brewer, 1974). In this chapter, I shall report on methods for measuring iodide and particulate iodine in sea water. Moreover, the method for the determination of iodate has been modified. This modified version is simpler and more suitable for rapid surveys although the precision may be slightly poorer.
-44-11.2 Historical review
Riley (1965) has reviewed the earlier literature through 1962. A few more methods have been reported since then. They are all summarized in table 11-2-1.
Analytical schemes for the determination of iodate can be categorized into three groups according to their
methodologies: titrimetry (Skopintsev and Mikhailovskaya, 1933; Barkley and Thompson, 1960a, 1960b; Matthews and Riley, 1970; Wong and Brewer, 1974; Truesdale and Spencer, 1974), photometry (Reith, 1930; Dubravcic, 1955; Sugawara et al., 1955; Voipio, 1961; Kappanna et al., 1962; Tsunogai, 1971a; Schnepfe, 1972; Truesdale and Spencer, 1974) and
polarography (Petek and Branica, 1968, 1969; Herring and Liss, 1973). The titrimetric methods involve the titration
of liberated iodine using the starch-iodine or the tri-iodide ion color as the end point indicator. Amperometric end point detection has also been used. The photometric pro-cedures may depend on: (1) the catalytic action of iodide on the oxidation of arsenic (III) by cerium (IV); (2) the color intensity of the extracted iodine; or (3) the color intensity of the iodine-starch complex. Some of the procedures require tedious initial concentration and separation steps (for
example, Reith, 1930; Skopintsev and Mikhailovskaya, 1933; Sugawara et al, 1955; Matthews and Riley, 1970; Tsunogai, 1971a). Others may require stringent control of experimental
Table 11-2-1
Approx. conc. found (ug/1)
Analytical methods for the determination of dissolved iodine in sea water Method of separation and detection Methodology Reference
43
26-56
61 Total I = 7-57 10 3-I = 0-50 Total I=45-70 10 ~-I= 50-76Iodate reduced with As203 + HCl, iodine liberated with nitrite and extracted with CCl4 .
Oxidized to 10 with Mno 4, reduced the
latter with C204-, treated with I~ and
acid, liberated iodine titrated.
Direct method, depending on catalytic action of I~ on reaction between Ce4+ and As3+, remaining Ce4+ determined. I~ co-precipitated with AgCl, converted
to 10 3 with Br. Reacted with acidified
I~, liberated iodine measured. Total I
by reduction of 10 with SO 3, followed by determination of I~ as described above. 10 reacted with I, liberated iodine
treated with excess S203-, which was
titrated with 10 3-. Total I by oxidation of I~ with Br to 10 3~ which was determined as described above. Total I also determined
by its catalytic effect on the reaction of
Ce with As3 . Photometry Titrimetry Photometry Photometry with starch iodine color Amperometric titration Reith 1930. Skopintsev and Mikhailovskaya
1933,
Dubravcic 1955. Sugawara et al. 1955; Sugawara and Terada 1957. Barkley and Thompson 1960a, 1960b. Photometry with brucineTotal I=60-118 I0 ~-I=36-172 I~-I=0-25 I0 ~-I=25-50 Total I=55-90 10 ~-1=37-64 I0 ~-i=41-56 I -I=1-116
Catalytic effect of I~ on reaction of Ce4+ with As3+.
Direct method. Acidify to pH 3. Remove 0., Record 10 peak at -0.3 V.
Modified Sugawara method, reduction of 10
3~
with (NH2)2 .H2SO4. 13 determined by
photometry or photometric micro-titration. Improved Sugawara method.
10 reacted with iodide-starch mixture
3
directly. Total I by oxidation of I with alkaline KMnO4 to 103 and reaction with I~-starch mixture.
Direct method for 10 Record 103 peak
3
4
at -1.090 v. I~ determined by difference
by oxidizing I to 10~ by UV irradiation.
I0 ~ react with I~ and acid to form I ~.
3
3-I color measured or titrated with S20
3
23
Total I by catalytic effect of 1 on reac-tion of Ce4+ with As3+. Measure brucine
color. Photometry Ce4+ color Pulse pola-rography Photometry I ~ color. Titrimetry Photometry Starch-I 2 color, Photometry starch-12 color Differential' pulse polarography Photometry Amperometric titration Voipio 1961; Kappanna et al. 1962. Petek and Branica 1968,1969. Matthews and Riley
1970.
Tsunogai 1971a.
Schnepfe 1972.
Herring and Liss
1973
Truesdale and Spencer 1974.
conditions (Dubravcic, 1955; Barkley and Thompson, 1960a; Voipio, 1961; Kappanna et al., 1962; Truesdale and Spencer,
1974). Some of the earlier methods (Reith, 1930; Skopintsev and Mikhailovskaya, 1933; Dubravcic, 1955) do not distin-guish between the oxidation states and may not have suffi-cient precision and sensitivity to detail the variations of iodate in the oceans.
Because of its low abundance, the measurement of iodide in sea water is even more difficult. In most cases, iodide is measured as the difference between iodate and total iodine. Consequently, the precision and sensitivity, and
thus the usefulness, of such methods are much reduced. The only known direct method is Sugawara's method and its later modifications (Sugawara et al., 1955; Matthews and Riley, 1970; Tsunogai, 1971a). In these methods, iodide is first concentrated from sea water by precipitating mixed silver halides. The precipitate is treated with bromine water to oxidize iodide to iodate, The excess bromine and hypobro-mite are carefully removed and the iodate is determined by iodometric titration. This method is time consuming and considerable manipulative skill is required to remove the bromine compounds quantitatively. Moreover, the use of rather large amounts of the obnoxious bromine water can become a problem especially on board ship where fume hood facilities may not be available.
Most of the presently available data were
-48-sured by Sugawara's method and its modifications (Sugawara and Terada, 1957; Sugawara, 1957; Sugawara et al., 1962; Tsunogai, 1971b; Tsunogai and Henmi, 1971). Few of the re-maining methods have been tested by measuring natural sam-ples from the open oceans. Representative profiles of iodide and iodate are shown in figure 1-2-1. Although the claimed precision of the analytical methods used is +3% for iodide and +6% for iodate, large haphazard variations are found in
these profiles and they are almost certainly due to analyti-cal uncertainties.
In light of the above, the precision and reliabi-lity of the existing analytical methods seemed inappropriate for this study. Consequently, I have developed new schemes for the analysis of iodide, iodate and particulate iodine in the oceans,
11.3 The determination of iodate in sea water II.3.1 Introduction
In my earlier work, I have reported a method for the determination of iodate in sea water by spectrophoto-metric micro-titration (Wong, 1973; Wong and Brewer, 1974).
The precision of this method is better than 1%. I also found that the iodate can be determined colorimetrically by measu-ring at 353 nm the absorbance of the tri-iodide ions gener-ated by the addition of acid and excess potassium iodide to
the sample using a scheme of standard additiors.The precision is about
±3%
(Wong, 1973). Although its precision is poorer, this method is simpler and will be most appropriate forsurveying the large variations (up to
50%)
of the iodate concentrations in the surface layers. The addition method has been modified and the results will be reported in this section.My previous data (Wong and Brewer,
1974) were
obtained from frozen samples analyzed in my laboratory at Woods Hole. There was some concern about the possible interference by nitrite. I have tested the sea-worthiness of the titration method and designed schemes to remove nitrite from the samples and the results will also be included in this section.
-50-11.3.2 Experimental II.3.2.1 Reagents
All reagents used were of the analytical reagent grade.
Standard potassium iodate solution (8 uM). Dissolve 0.856 g (4 mmoles) of potassium iodate in distilled water and dilute to 500 ml. The resulting solution is 8 mM. Prepare an 8 uN solution from this stock solution by
suc-cessive dilutions.
Potassium iodide solution (10% w/v). Dissolve 2.5 g of potassium iodide in distilled water and dilute to 25 ml. This solution should be prepared daily.
Sulfuric acid (0.1 M). Add 25 ml of concentrated sulfuric acid (18 M) to 400 ml of distilled water in small increments with intermittent swirling and cooling in an ice-water slush bath. Add 25 ml of distilled water. The resulting solution is approximately 1 M. Prepare a 0.1 M
solution from this stock solution by a ten-fold dilution. Sulfamic acid solution (0.1 % w/v). Dissolve 0.1 g of sulfamic acid in distilled water and dilute to 100 ml.
11.3.2.2 Procedure
Filter about 250 Ml of surface sea water through a Whatman 40 filter paper. Pipette 40 ml of the filtered sea water into each of a set of four 50 ml volumetric flasks and mark them 0, 1, 2 and 3. Add 1 ml of 0.1 M
sulfuric acid and 1 ml of 0.1% sulfamic acid to each flask. Swirl each flask and allow the solutions to sit for 15
minutes with occasional shaking. Pipette 1,2 and
3
ml of 8 uM potassium iodate solution to the flasks marked 1, 2 and 3 respectively, Add 1 ml of the 10% potassium iodide solution and dilute to volume with distilled water. Again, allow the solutions to sit with occasional swirling for 15 minutes. Then, measure the absorbance of the solution ineach flask at 353 nm in a 10 cm cell. Repeat the procedure twice for the same surface sea water. Plot absorbance
against the amount of iodate-iodine added and compute the slope (S) of the graph.
Treat each sample in the same manner except
omitting the addition of iodate. Note the absorbance (A) of each sample. The concentration of iodate in the samples can be calculated from the formula
(11-3-1)
11.3.3 Results and discussions
Sea water samples were collected in the Equatorial Atlantic during cruise AII-83 and were analyzed for iodate on board ship by the colorimetric method. Table 11-3-1 shows the raw data for constructing the calibration curves through out the entire cruise. Figure 11-3-1 shows one of the calibration curves. The slopes of the calibration curves were calculated by a linear least square fit. Within each
day, the uncertainty of the slope varies from +_0.2% to +1.3%. The average slope for the calibration curves in six weeks has 10' of +2.3%. The precision of the colorimetric method relies heavily on the consistency of the slope of
the calibration curve as shown in equation 11-3-1. Thus, it is comforting to observe such reproducible results and the uncertainty of the method can be estimated to be about
In order to further check the reliability of the colorimetric method, I have attempted to intercalibrate results from this method and the titration method. Figure 11-3-2 shows the data from GEOSECS station 109 (20s, 4033'W) and the nearby station AII-83-2052 (20S, 100W). The GEOSECS samples were analyzed by the titrimetric method while
station AII-83-2052 samples were analyzed by the colori-metric method. The profiles of Go- of these stations are indistinguishable below 40 m while the profiles of salinity and potential temperature become identical below 500 m. The
Table
1-3-1
Data for the calibration curves for the colorimetric determination of iodate during cruise AII-83Absorbances with various amount of I0 ~-I added (in ug)
0 1.015 2.03 3.045
Slope for the day June 17, 1974 June 25, 1974 1
July 8, 1974
July 11, July 20, July 27, 0.173 0.166 0.167 0.162 0.172 0.171 0.171 0.170 0.170 0.173 0.171 0.162 0.170 0.190 1974 1974 0.267 0.268 0.260 0.260 0.263 0.265 0.257 0.260 0.257 0.258 0.255 0.262 0.266 0.276 0.357 0.352 0.352 0.347 0.352 0.354 0.348 0.347 0.349 0.349 0.344 0.348 0.351 0.361 0.441 0.439 o.438 0.435 0.442 0.440 0.436 0.436 0.437 0.434 0.438 0.438 0.445Average slope for the entire
0.0887 + 1.1% 0.0887 i 1.1% 0.0873 + 0.3% 0.0865 t 0.8% 0.0888 i 1.3% 0.0837 i 0.25 0.0873 + 2.3% Date Trial
cruise
Cy)
C)
Cs
0 1 2 3
ug
K1O
3-1
added
Fig.
11-3-1
A calibration curve for the colorimetric determination of iodate. (July 8, 1974)/ODATE (pazm) 0.2 0.3 0.4 0.5 0 04 0 0/ ++
I-
+
DO-+/ DO O 001-00- +SAL iN!T Y(%o)
34.5 35 35.5 |+ 0 01
I1
POTENT/AL TEMP. (9, 0C) 5 10 15 20 25 30 I I ~ ~ ~ ~ + .0O O 0+ ~0 . *: 25 26 27 28 1 01 0 46 0 109+ 00'0WFig. 11-3-2 A comparison of data
methods.
by the colorimetric and the titrimetric
Ic
20 5 15 oAII-83-2052
02000.20'S 100O0.0
+GEOSECS
STATION 02000.00'S 04033.iodate profiles, within the precision of the analytical methods, are indistinguishable throughout the entire depth. This agreement indicates that there is no systematic dif-ference between these two methods.
I have also measured iodate in the Venezuela
Basin on board ship during cruise AII-?9 by the spectropho-tometric micro-titration method. No special difficulties were encountered and the method seems to be sea-worthy.
This profile of iodate is shown in figure 11-3-3. The profile is remarkably smooth and the variation in the deep water is only +2%. A few of the samples were frozen and analyzed in the laboratory four months later. The stored samples give absolute concentrations that are slightly lower than those nearby samples analyzed on board ship as shown in figure 11-3-3. However, this difference is insignificant within the uncertainty of the analytical method and may be due to a slight error in calibrating the strength of the sodium thiosulfate titrant, as different titrant solutions have been used. Thus, it is apparently safe to freeze sea water for an extended period of time for the analysis of iodate on a later date. A more detailed study on the effect of storage on iodate analysis has been reported in Wong (1973).
The interference of nitrite on iodometric titra-tions is well known. The reaction involved is
21 + 2HNO2 + 2H+ = 2N0 + 12 + 2H20 (11-3-2) Thus, in an acidic solution, nitrite may oxidize the
lodate (p M)
0.3 0.4 0.5 0 A||7 9-2 03 3 Venezuela Basin 13*22'N 64*43'VW 010 0Fig. II-3.-3 A profile-, of iodate determined on board ship. + denote samples stored frozen and analyzed four months later.
-58-excess potassium iodide added to produce additional tri-iodide ions and yield high results. Furthermore, nitrite can be regenerated from nitric oxide by the reactions
2N0 + 02 = 2N02 (11-3-3)
2N 2 + H20 = HNO2 + HNO3 (11-3-4) Nitrogen dioxide can also oxidize iodide to iodine in an acidic solution according to the equation
NO-2 + 2I~ + 2H = 12 + NO + H20 (11-3-5)
Thus, theoretically, in the presence of acid and even a trace of nitrite, iodide may be continuously oxidized to
iodine until it is exhausted, Mlethods for the removal of this interference have been well studied (Kolthoff and Belcher, 1957). Cohen and Ruchhoft (1941) proposed the use of sulfamic acid for removing nitrite in the Winkler
titrations for dissolved oxygen by the reaction
NH2SO2OH + HNO2 = H2S04 + N2 + H120 (11-3-6)
This reaction is rapid and quantitative and the products do not react with any iodine species. Thus, I have adopted the use of sulfamic acid as a precaution against the
interference by nitrite.
Nitrite occurs at very low concentrations in the open oceans. In deep waters, its concentration is less than 0.024 uM (Wada and Hattori, 1972). In the surface layers, the concentration is quite variable. I have tested for possible interference in the oxic zone of the Cariaco Trench. I chose two close bysamples that were about 100 m