HAL Id: obspm-02513138
https://hal-obspm.ccsd.cnrs.fr/obspm-02513138
Submitted on 20 Mar 2020
HAL is a multi-disciplinary open access
archive for the deposit and dissemination of
sci-entific research documents, whether they are
pub-lished or not. The documents may come from
teaching and research institutions in France or
abroad, or from public or private research centers.
L’archive ouverte pluridisciplinaire HAL, est
destinée au dépôt et à la diffusion de documents
scientifiques de niveau recherche, publiés ou non,
émanant des établissements d’enseignement et de
recherche français ou étrangers, des laboratoires
publics ou privés.
round? Investigations into the early phases of the Milky
Way’s formation through stellar kinematics and
chemical abundances
P. Di Matteo, M. Spite, M. Haywood, P. Bonifacio, A. Gómez, F. Spite, E.
Caffau
To cite this version:
P. Di Matteo, M. Spite, M. Haywood, P. Bonifacio, A. Gómez, et al.. Reviving old controversies: is the
early Galaxy flat or round? Investigations into the early phases of the Milky Way’s formation through
stellar kinematics and chemical abundances. Astronomy and Astrophysics - A&A, EDP Sciences, In
press, 636, pp.A115. �10.1051/0004-6361/201937016�. �obspm-02513138�
March 9, 2020
Reviving old controversies: is the early Galaxy flat or round?
Investigations into the early phases of the Milky Way’s formation through stellar
kinematics and chemical abundances
?P. Di Matteo
1, 2, M. Spite
1, M. Haywood
1, 2, P. Bonifacio
1, A. Gómez
1, F. Spite
1, E. Caffau
11 GEPI, Observatoire de Paris, PSL Research University, CNRS, Place Jules Janssen, 92190 Meudon, France e-mail: paola.dimatteo@obspm.fr
2 Sorbonne Université, CNRS UMR 7095, Institut d’Astrophysique de Paris, 98bis bd Arago, 75014 Paris, France Received; accepted
ABSTRACT
We analysed a set of very metal-poor stars, for which accurate chemical abundances have been obtained as part of the ESO Large Program ’First stars’ in the light of the Gaia DR2 data. The kinematics and orbital properties of the stars in the sample show they probably belong to the thick disc, partially heated to halo kinematics, and to the accreted Gaia Sausage-Enceladus satellite. The continuity of these properties with stars at both higher ([Fe/H] > −2) and lower metallicities ([Fe/H] < −4.) suggests that the Galaxy at [Fe/H] . −0.5 and down to at least [Fe/H] ∼ −6 is dominated by these two populations. In particular, we show that the disc extends continuously from [Fe/H] ≤ −4 (where stars with disc-like kinematics have recently been discovered) up to [Fe/H] ≥ −2, the metallicity regime of the Galactic thick disc. An ‘ultra metal-poor thick disc’ does indeed exist, constituting the extremely metal-poor tail of the canonical Galactic thick disc, and extending the latter from [Fe/H] ∼ −0.5 up to the most metal-poor stars discovered in the Galaxy to date. These results suggest that the disc may be the main, and possibly the only, stellar population that has formed in the Galaxy at these metallicities. This would mean that the dissipative collapse that led to the formation of the old Galactic disc must have been extremely fast. We also discuss these results in the light of recent simulation efforts made to reproduce the first stages of Milky Way-type galaxies.
Key words. Stars: Abundances – Galaxy: abundances – Galaxy: halo – Galaxy: disc – Galaxy: kinematics and dynamics – Galaxy:
evolution
1. Introduction
Our definitions and understanding of the Galactic halo, and, more generally, of the old Galactic stellar populations have been strongly shaken by the results obtained from the Gaia data releases (Gaia Collaboration et al. 2016, 2018a). Because we like to cling to good ideas (as much as we like good stories), the vision that we had of the Galactic halo before Gaia was built on two studies published more than half a century ago: the articles of Eggen et al. (1962) and Searle & Zinn (1978). After having elaborated for a few decades on these two studies, the halo was standardly described only a few years ago as the combination of collapsed and accreted components, with relative weights not easily quantifiable (see, for example, Helmi 2008; Carollo et al. 2007). The in-situ component was believed to have formed from the collapsing gas, eventually brought into the Galaxy via gas-rich mergers, while the accreted component was thought to be formed from a multitude (several tens) of
stellar sub-haloes (Gao et al. 2010; Griffen et al. 2018). The
possibility that solar vicinity halo stars were dominated by the presence of possibly one only satellite has already been raised by Brook et al. (2003), based on the stellar kinematics of halo stars, and by Nissen & Schuster (2010, 2012); Schuster et al. (2012), on the basis of their chemical abundances, kinematics,
? Based on observations collected at the European Organisation for Astronomical Research in the Southern Hemisphere under ESO pro-grammes 165.N-0276(A) (P.I.: R. Cayrel).
and ages. The analysis of the Gaia DR1 and DR2 has allowed us to extend our view beyond the solar vicinity, and to show
that the Galaxy at low metallicity (−2.5 . [Fe/H] . −1) is,
most probably, dominated by the remnant of a single accretion event that occurred 9-11 Gyr ago (Belokurov et al. 2018; Haywood et al. 2018; Helmi et al. 2018; Di Matteo et al. 2018; Mackereth et al. 2019; Myeong et al. 2018; Gallart et al. 2019) and that the in-situ part of the Galactic halo may be attributed to heated disc stars (Bonaca et al. 2017; Haywood et al. 2018; Di Matteo et al. 2018; Belokurov et al. 2019; Gallart et al. 2019) rather than a collapsing halo (Haywood et al. 2018; Di Matteo et al. 2018), thus supporting the predictions of N-body models (Zolotov et al. 2010; Purcell et al. 2010; Font et al. 2011; Qu et al. 2011; McCarthy et al. 2012; Jean-Baptiste et al. 2017). Even more surprising, in this context, has been the result, from Sestito et al. (2019), that about 20% of all ultra-metal-poor
([Fe/H] < −4)1 stars known are on thin or thick disc orbits.
Stars at [Fe/H] < −4 or even [Fe/H] < −6 are expected to form a few hundreds Myr after the Big Bang, raising two fundamental questions: was the gaseous disc already the main, and possibly the only, structure of the Milky Way to form stars at these early epochs?; and, how could the fossil signatures of such kine-matically cold stars have not been erased by the passage of time?
1 We adopt the classical notations that, for each element X, [X/H]= log(NX/NH)star− log(NX/NH)Sun and [X/Fe]=[X/H]–[Fe/H].
The assembly sequence of our Galactic halo is encoded in spectra of its surviving low-metallicity stars, given that their el-emental abundance ratios reflect the successive nucleosynthesis processes and the nature of the stars creating them. In the frame of the ESO Large Program ‘First stars - First nucleosynthesis’ (hereafter LP First stars) a sample of very metal-poor field stars,
giants and turnoff stars, with −4.2 < [Fe/H] < −2, was studied
homogeneously from high-resolution and high S/N spectra.
Since these stars are very or extremely metal poor, it is supposed that they are very old and formed shortly after the Big Bang. For many of these stars, the main astrometric parameters – pre-cise position, proper motion and parallax – are now available in the second data release of the Gaia mission (Gaia Collaboration et al. 2018a). The aim of the present paper is therefore to make a step toward a better understanding of the very metal-poor populations in the Galaxy and of their origin, by comparing the kinematics of the LP First stars to the kinematics of different samples of metal-poor, as well as more metal-rich, stars.
The outline of the paper is as follows: in the following sec-tion, we describe the characteristics of our sample. In Section 3, we analyse and discuss the kinematics and orbital properties of our stars. In Section 4, we undertake an extensive compari-son of the kinematic properties of our sample with the higher metallicity sample studied by Nissen & Schuster (2010), and also with the Gaia DR2-APOGEE sample studied by Di Matteo et al. (2018) on the one side, and with the lower metallicity sam-ple studied by Sestito et al. (2019) on the other side. In Section 5, we analyse the chemical properties of stars in the LP First stars, and compare it to the sample of r-rich stars at similar metallici-ties studied by Roederer et al. (2018). Finally, in Sects. 6 and 7, we discuss our results and derive our conclusions.
2. Data
2.1. LP First stars sample in the Gaia DR2 survey
In the frame of the LP First stars, a sample of 54 very metal-poor
field stars, giants, and turnoff stars was studied homogeneously
from high-resolution (R ≈ 45 000), high-S/N (S/N better than
200 per resolution element at 400 nm) spectra. This sample of stars was selected from the the HK survey of Beers et al. (1985, 1992) for their low metallicity after a medium resolution follow-up, without considering their kinematics. The metallicity of the stars was found to be in the range −4.2 < [Fe/H] < −2, with a peak at [Fe/H] ≈ −3. Following Beers (2005), these stars are re-ferred to as ’very metal-poor’ (VMP) if −3.0 < [Fe/H] ≤ −2.0, or ’extremely metal-poor’ (EMP) if −4.0 < [Fe/H] ≤ −3.0. A complete LTE analysis using OSMARCS models (Gustafsson et al. 1975, 2003, 2008) was carried out, based on the spectral analysis code turbospectrum (Alvarez & Plez 1998). The re-sults of this analysis were published in a series of papers entitled First Stars I to First Stars XVI (see, in particular: Cayrel et al. 2004; Bonifacio et al. 2009).
At low metallicities, many stars are carbon-enhanced
com-pared to the normal EMP stars2. At [Fe/H]= −3, for example,
about 30% of the stars are carbon-rich with [C/Fe] >+1.0. They
are referred to as ‘carbon-enhanced metal-poor’ (CEMP) stars (Beers & Christlieb 2005), and their fraction increases when the metallicity decreases. A few CEMP stars (six in total) are
2 The origin of this high C abundance is not always completely clear. It can be due to an enrichment of a normal EMP binary star by its more massive companion in its AGB phase, or the star could have been formed from a C-rich cloud.
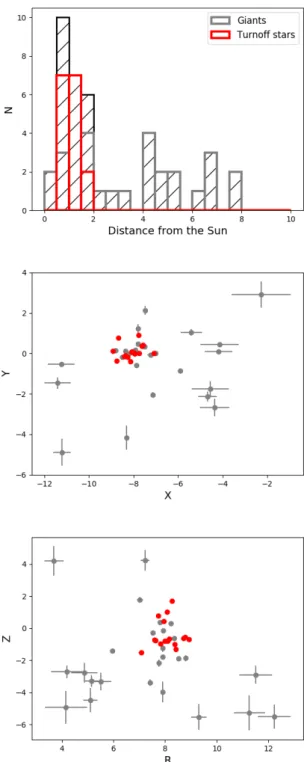
Fig. 1. Top panel: Histogram (hatched black) of the distances (in kpc) to the Sun, of the sample of stars studied in the frame of the ESO LP First Stars. The grey histogram shows the distance distribution of giant stars, the red histogram that of turnoff stars; Middle panel: X-Y spatial distri-bution of stars in the sample (grey dots for giants, red dots for turnoff stars), and their uncertainties; Bottom panel: R-Z spatial distribution of stars in the sample (grey dots for giants, red dots for turnoff stars) and their uncertainties.
also present among the LP First stars (e.g. Depagne et al. 2002; Sivarani et al. 2004, 2006). For the sake of homogeneity, we do not include these CEMP stars in our present sample. We did, however, verify that these CEMP stars do not show any
peculiar-Fig. 2. From top to bottom: [Fe/H] distribution (hatched black) of stars in sample. The grey histogram shows the [Fe/H] distribution of giant stars, the red histogram that of turnoff stars; [Mg/Fe] − [Fe/H] and [Ca/Fe] − [Fe/H] distributions of stars in the sample (grey dots for gi-ants, red dots for turnoff stars); [Ba/Fe] − [Fe/H] distribution of stars in the sample (grey dots for giants, red dots for turnoff stars). Stars have only an upper limit estimate of the [Ba/Fe] ratio are indicated by an arrow.
ity in their kinematic properties when they are compared to the full LP First stars sample, as discussed in Appendix A.
Most of the stars in the sample are too faint to have a line-of-sight velocity in the Gaia DR2 (Gaia Collaboration et al. 2018a,b), but precise line-of-sight velocities were measured on each UVES spectrum of the stars and were published in
Boni-facio et al. (2007, 2009). Taking into account the position of the
telluric lines, the error is estimated to 0.5 km s−1for the turnoff
stars and 0.3 km s−1 for the giants. When they exist in Gaia DR2,
there is a good agreement, within the error bars, between the line-of-sight velocities measured by Gaia and by UVES.
Three turnoff stars have a variable line-of-sight velocity (CS
29499-060, CS 29527-015, CS 30339-069), and as a conse-quence, were not taken into account in this study. The charac-teristics of the remaining stars, angular position on the sky, line-of-sight velocity, proper motions, and parallaxes πwere extracted from the Gaia DR2. We only kept stars whose uncertainty on the
parallax σπ/π was less than 20%, after correcting by the
zero-point offset of –0.03 (Arenou et al. 2018; Gaia Collaboration
et al. 2018a; Lindegren et al. 2018). This leaves us with a final sample of 42 stars (16 turnoff stars and 26 giants), whose char-acteristics are given in Appendix B in Table B.1. For this final sample, distances were calculated by simply inverting the paral-laxes.
In Fig. 1, we present the histogram of the distances from the Sun of the stars in the final sample, as well as their spatial coordinates. For a description of the method adopted to estimate distances, and to derive the spatial coordinates of the stars, as well as their uncertainties, we refer the reader to Sect. 3.1. The
turnoff stars are, as expected, on average, closer to the Sun than
the giants. The giants are almost regularly spaced between zero
and 8 kpc. On the contrary, all the turnoff stars are concentrated
between zero and only 2 kpc. The metallicity distribution of the
final sample of stars (see Fig. 2) peaks around [Fe/H]= −3.0.
2.2. Chemical properties of the LP First stars sample
A surprise result of the spectroscopic study of the LP First stars sample (VMP and EMP stars) was the great homogeneity of their abundance ratios. From C to Zn, the abundance ratios are very similar in all the stars, although the clouds from which they were formed have probably been enriched in metals by a very small number of massive SN II supernovae (see Cayrel et al. 2004; Bonifacio et al. 2009). In order to explain the abundance pat-tern of the elements, the mass of these supernovae should be
be-tween 10 and 30 M (Cayrel et al. 2004). All these stars are, in
particular, almost uniformly α-rich (see Fig. 2, and Andrievsky et al. 2010; Spite et al. 2012), with a very small scatter after the non-LTE corrections.
This uniform α enhancement suggests that these stars were all formed from a matter only enriched by massive SN II su-pernovae, before the explosion of the first SN I ejected lower N(α)/N(Fe) ratio. At higher metallicity ([Fe/H] > −1.6), the
ra-tio [α/Fe] has often been used to distinguish different halo
pop-ulations (Nissen & Schuster 2010; Hayes et al. 2018), but this does not currently seem possible in the VMP and EMP stars, since they all have about the same N(α)/N(Fe) ratio (see Fig. 2). However, in these VMP and EMP stars, the abundance ratios of the elements heavier than Zn (hereafter ’heavy elements’), formed by neutron capture on iron seeds, are very variable (see
in Fig. 2, the large scatter of [Ba/Fe] vs. [Fe/H] and also Gilroy
et al. (1988); François et al. (2007); Spite et al. (2018)). At the
same metallicity, the ratio Ba/Fe varies by a factor of almost 100.
Since only the abundance ratios [X/Fe] of the heavy elements
show significant differences from star to star, it can be
interest-ing to study the kinematics of these VMP and EMP stars as a function of the abundance of these heavy elements. Recently, Roederer et al. (2018) studied the kinematic properties of a
sam-ple of only VMP and EMP stars rich in heavy elements, so it will be possible to compare our results with theirs.
2.3. R-rich very metal-poor stars
Elements heavier than Zn are formed by addition of neutrons on iron seeds, via various nucleosynthetic mechanisms, and pre-dominantly via the r- and the s-processes. This addition may in-deed be slow (compared to the β decay) in the ‘s-process’, or very rapid, with an important flux of neutrons, in the ‘r-process’. The s-process mainly occurs in AGB stars, and it seems that the lifetime of their progenitors is too long to significantly contribute
to the chemical evolution of the early Galaxy for [Fe/H] .
−1.5 dex (Travaglio et al. 2004; Käppeler et al. 2011). In the VMP and EMP stars, the heavy elements are thus mainly formed
by the r-process. The different possible sites of the r-process
(massive stars, neutron-stars, and neutron-star/black hole
merg-ers) are reviewed by Cowan et al. (2019).
A star is referred to as r-rich when it is rich in europium relative to iron, because the s-process builds very little Eu, and, as a con-sequence, the abundance of Eu is a good index of the r-process enrichment. Following Roederer et al. (2018), a star is referred to as r-rich when [Eu/Fe] > 0.7 .
Unfortunately, in most of the turnoff metal-poor stars, the
Eu lines are too weak to be measured, and the abundance of Eu cannot be directly estimated. However, we showed (Spite et al. 2018) that, in all the ‘normal’ VMP and EMP stars (i.e. not C rich), there is an excellent correlation between the abundance of
Eu and the abundance of Ba, with [Eu/Ba] ≈+0.5 dex.
At higher metallicities ([Fe/H] & −1.5 dex), the pattern of the
heavy elements in the stars can be affected by the s-process,
and the ratio [Ba/Fe] increases (see for example Roederer et al.
2016).
In order to include the turnoff stars in this study, since all the
stars have a metallicity lower than –2.0 dex, we used the [Ba/Fe]
ratio as a proxy of [Eu/Fe]. The values of [Fe/H] and [Ba/Fe] are
given for each star of the LP First stars sample in the Table B.1.
3. Kinematic and orbital properties of the LP First stars
We start our analysis by deriving the orbits of stars in our sam-ple, the associated parameters, and their uncertainties, to estab-lish the kinematic properties of very metal-poor and extremely metal-poor stars.
3.1. Orbit integration
For calculating positions and velocities in the galactocentric rest frame, we assumed an in-plane distance of the Sun from the
Galactic centre, R = 8.34 kpc (Reid et al. 2014), a height of
the Sun above the Galactic plane, z = 27 pc (Chen et al. 2001),
a velocity for the local standard of rest (LSR), VLS R= 240 km/s
(Reid et al. 2014), and a peculiar velocity of the Sun with
re-spect to the LSR, U = 11.1 km/s, V =12.24 km/s, W =7.25
km/s (Schönrich et al. 2010). We note that in our choice of the
galactocentric coordinate system, the Sun lies on the x-axis with
a negative value of x= −8.34 kpc, and the V is positive, that is
parallel to the y axis. This implies that the disc rotates clockwise, and, as a consequence, the z-component of the disc angular
mo-mentum, Lz, and the disc azimuthal velocity, VΦare negative3.
3 We remind the reader that the azimuthal velocity V
Φis defined as the z-component of the angular momentum Lzdivided by the (in-plane)
Thus, negative VΦcorresponds to prograde motion, and positive
VΦto retrograde motion.
For each star, we took into account its errors on parallax, proper motions, and line-of-sight velocity, by assuming gaussian distributions of the errors, and by generating 100 random realisa-tions of these parameters. The corresponding errors on posirealisa-tions and velocities are given in Table B.5.
Finally, in this section and in the following, to integrate the orbits of stars, we made use of the axisymmetric Galactic po-tential ’PII’ described in (Pouliasis et al. 2017), which consists of a thin and of a thick stellar disc and a spherical dark matter halo, and which reproduces a number of characteristics of the Milky Way (see Pouliasis et al. 2017, for details). Starting from the current positions and velocities of stars in the galactocentric rest frame, derived as described above, we have integrated their orbits backward in time for 6 Gyr, by making use of a leap-frog
algorithm with fixed time step∆t = 105yr. For each star, we can
thus quantify its total energy E (that is the sum of its kinetic and potential energy), reconstruct its orbit in the Galactic potential adopted, and hence estimate its eccentricity, ecc, the maximum
height from the plane, zmax, it reaches, as well as its (in-plane)
apocentre Rmax. To estimate the uncertainties on the orbital
pa-rameters, for each star, we compute 100 realisations of its orbit, by making use of the 100 random realisations of its parallax, proper motions, and line-of-sight velocity, as described above. All these realisations are also integrated in the same Galactic potential and for the same total time interval. The orbits of all stars in the LP First stars are given in Appendix C. The corre-sponding orbital parameters, and their uncertainties are given in Appendix B, Table B.6 .
3.2. Kinematic and orbital properties of the LP First stars We start the analysis of the kinematics of stars in our sample
by showing the Toomre diagram – that is the VΦ− pVR2+ VZ2
plane, with VRand VZbeing, respectively, the radial and vertical
components of the velocity of stars – in Fig 3 (top-left panel). In this plane, most of the stars in the sample seem kinemati-cally associated to the halo, the absolute value of their velocity, q
(Vφ− VLS R)2+ VR2+ VZ2, relative to the LSR, being larger
than 180 km/s, a threshold often used to distinguish stars with
disc-like kinematics from stars with kinematics more akin to the halo (see, for example Nissen & Schuster 2010). However, eight out of the 42 LP First stars, that is nearly 20% of the sample, re-distribute in the grey area of the Toomre diagram in Fig 3, which represents the locus of stars with disc-like kinematics, where the absolute value of the star velocity, relative to the LSR, is lower
than 180 km/s.
Because stars in the LP sample have a wide spatial distribu-tion, extending to distances of several kpc from the Sun (see
Fig. 2), differences in velocities can simply reflect differences
in the positions of the stars, rather than intrinsic differences in
their kinematic properties. A more robust comparison can be
done by analysing integral-of-motion spaces, like the Lz− Lper p
or E −Lzspace. Those spaces, and in particular the clumpiness of
the stellar distribution in those spaces, were suggested by Helmi
et al. (1999); Helmi & de Zeeuw (2000) as efficient diagnostics
to infer the (accreted) origin of stars in the Galaxy. It was later shown that this approach has severe limitations (Jean-Baptiste
distance R of the star from the Galactic centre, that is VΦ = (XVY− YVZ)/R. The radial velocity, VR, is in turn defined as: VR = (XVX+ YVY)/R
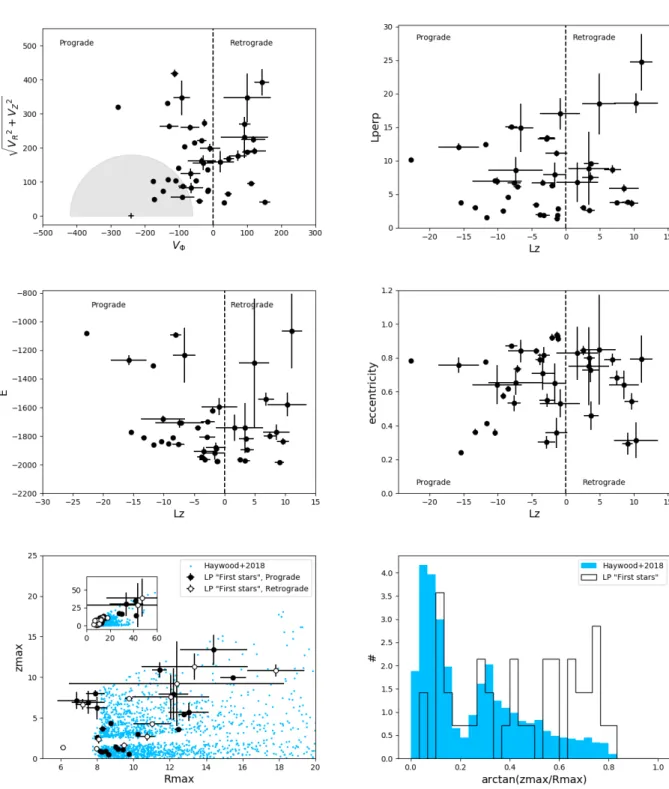
Fig. 3. Top-left panel: Toomre diagram for stars in LP sample. The vertical dashed line separates prograde from retrograde motions. Velocities are in units of km/s. The grey area separates stars with p
VR2+ (VΦ− VLS R)2+ VZ2 ≤ 180 km/s from stars with higher relative velocities with respect to the LSR. Top-right panel: Distribution of the LP First stars in the Lz− Lper pplane. Angular momenta are in units of 100 kpc km/s. Middle-left panel:Distribution of LP First stars in the E − Lzplane. The vertical dashed line separates prograde from retrograde motions. Angular momenta are in units of 100 kpc km/s, energies in units of 100 km2/s2. Middle-right panel: Distribution of LP First stars in the eccentricity-L
z plane. Bottom-left panel: Distribution of stars in the zmax− Rmax plane. The inset shows the whole distribution, over 60 kpc from the Galactic centre, while the main panel shows a zoom in the innermost 20 kpc. Filled symbols indicate stars with prograde orbits, empty symbols stars with retrograde orbits. Blue points show the comparison with the sample of stars analysed by Haywood et al. (2018). Units are in kpc. Bottom-right panel: Normalised distribution of the arctan(zmax/Rmax) for stars in the LP sample (black histogram), compared to stars studied by Haywood et al. (2018) (blue histogram). In all panels, uncertainties have been estimated as described in Sect. 3.1.
et al. 2017) – and indeed in the folllowing, we avoid using these diagnostics, alone, to infer the nature of stars in our sample. It is nevertheless more reliable to compare the kinematic
proper-ties of a spatially extended sample of stars in those planes, rather than in velocity-only planes, since velocities can change within the spatial volume covered by our data because of velocity
gra-dients.
The Lz− Lper pplane (see Fig. 3, top-right panel) shows Lz, which
is the z−component of the orbital angular momentum of a star,
versus Lper p =
q
Lx2+ Ly2, which is the perpendicular angular
momentum component. We note that, while in an
axisymmet-ric potential, Lz is conserved, Lper p is not. In all plots shown
in the rest of the paper, the adopted value of Lper p is thus the
time-averaged value, calculated over 6 Gyr of orbital evolution. Figure 3 shows that the LP sample has a broad distribution in
the Lz− Lper pplane: stars with the most retrograde motions also
have the highest values of Lper p , while, among stars with
pro-grade motions, some have values of Lz very similar to those of
stars of the LSR (Lz,LS R= −20, in units of 100 kpc km/s).
The distribution of our sample stars in the energy, E, versus the
vertical component of the angular momentum, Lz (middle-left
panel of Fig 3) shows that some of the stars, both on prograde and retrograde orbits, can have very high energies, of which the absolute value is about twice as high as those of stars with disc-like kinematics (the latter can be identified in this plane as the
stars with Lz. −5 and −1900 . E . −1800).
Interestingly, LP stars on prograde and on retrograde orbits show similar eccentricities (middle-right panel of Fig 3): few stars on retrograde orbits have eccentricities lower than 0.4. In this plot, as in the following, the eccentricity of a star in defined as: ecc= R3D,max− R3D,min
R3D,max+ R3D,min
, (1)
R3D,max and R3D,minbeing, respectively, the (3D) apocentre and
pericentre of the star’s orbit.
Finally, the maximal radial excursion of the orbits of stars
as projected onto the Galactic plane, Rmax, versus their
maxi-mal height from the plane, zmax, is reported in Fig 3 (bottom-left
panel). While the majority of stars in the sample are confined inside 20 kpc from the Galactic centre, some can reach much larger distances, as high as 50 kpc. The striking feature of this plot, however, is that VMP and EMP stars are not distributed ho-mogeneously in this plane, but they tend to group along (at least)
two different structures: one confined close to the Galactic plane
(i.e. low zmax), and one characterised by larger zmax, for all values
of Rmax. These structures, or wedges, were already noted in the
sample of about 2000 Gaia DR2 stars with high tangential veloc-ities relative to the LSR studied by Haywood et al. (2018). Also, stars in Haywood et al. (2018) are indeed redistributed along at least two wedges (see discussion in that paper), the one with low
zmaxpopulated by stars with disc-like orbits, which mean they are
always confined close to the Galactic plane. The stars studied by
Haywood et al. (2018), however, have a mean [Fe/H] ∼ −1 dex,
that is between 1 and 3 dex higher than the [Fe/H] of LP First stars. The same orbital structure found by Haywood et al. (2018) at high metallicities thus seems to persist over several orders in metallicities. We investigate this point further in the next sec-tion. We conclude by noting that the distribution of stars in the
Rmax− zmax plane is independent of them being on prograde or
retrograde orbits: stars with retrograde or prograde rotation are redistributed rather homogeneously in this plane, and some ret-rograde stars are clearly confined to disc-like kinematics (i.e. low
zmax). As in Haywood et al. (2018), it is possible to quantify the
amount of stars with disc-like orbits, and distinguish them from those with halo-like orbits, by estimating the arctangent of the
ratio zmax/Rmax(see Fig 3, bottom-right panel), which represents
the inclination of the wedges in this plane. The lack of stars with
arctan(zmax/Rmax)∼ 0.2, noticed by Haywood et al. (2018) for
stars at [Fe/H] ∼ −1 dex, and found also in this VMP and EMP
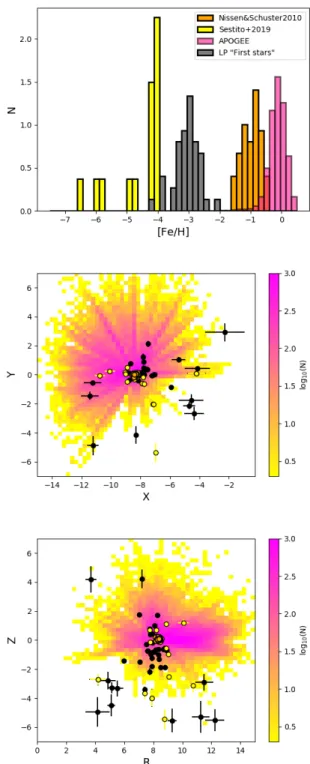
Fig. 4. Top panel: Normalised metallicity distribution of the LP First stars sample (grey histogram), compared to the ultra-metal-poor sample studied by Sestito et al 2019 (yellow histogram), the Nissen & Schuster 2010 sample (orange histogram) and the Gaia DR2-APOGEE sample (pink histogram). The four samples span about 7 dex in [Fe/H]. Mid-dle panel:Distribution in the XY plane of stars from the Gaia DR2-APOGEE (stellar number density map in logarithmic scale), the LP First stars (black dots), the Nissen & Schuster 2010 sample (orange dots), and the Sestito et al 2019 sample (yellow dots). Units are in kpc. Bottom panel:Distribution in the RZ plane of stars in the different sam-ples. Colours and units are the same as those adopted in the middle panel.
arctan(zmax/Rmax)= 0.2 as separating value, we find disc-like
or-bits for 10 out of the 42 stars in the LP First stars, that is for about 20% of the stars in the sample, a fraction comparable to that de-rived using the Toomre diagram and of a discriminating value for disc-like orbits of
q
(Vφ− VLS R)2+ VR2+ VZ2 = 180 km/s
(see discussion at the beginning of this section). We note that, compared to the Haywood et al. (2018) stars, the distribution of
the arctan(zmax/Rmax) for stars of the LP sample shows a lower
fraction of stars with disc-like kinematics. This is a natural con-sequence of the fact that the Haywood et al. (2018) sample is dominated by thick disc stars at [Fe/H] ≥ −1 with halo-like kinematics, which are the dominant contributor to the kinemati-cally defined halo population at few kpc from the Sun (see also Di Matteo et al. 2018).
4. Comparison with samples of stars at lower and higher metallicities
In this section, we aim to compare the kinematic and orbital properties of stars in the LP sample with those of samples that
cover different metallicity ranges, as detailed below. The
rea-son for this comparirea-son is twofold. Firstly, we want to under-stand whether the properties described in the previous section are found also among stars of lower and higher metallicities. Secondly, by comparing with other samples (in particular with those at higher metallicities, where a distinction between in-situ and accreted stars is possible on the basis of their chemical abun-dances), we can try to interpret the kinematic and orbital
charac-teristics of our stars in terms of their in-situ/accreted origin.
In the following part of this section, we compare the kine-matic and orbital properties of stars in the LP First starsf to three
different samples, which are listed below in order of increasing
[Fe/H].
– The sample of ultra iron-poor stars (UIP) studied by Ses-tito et al. (2019). This sample consists of 42 stars with [Fe/H] ≤ −4. Sestito et al. (2019) already derived orbital parameters for these stars using Gaia DR2 parameters, and a bayesian estimate of the distances. For coherence with the approach used for the analysis of the LP sample, and throughout the rest of this paper, we applied the same se-lection applied to the LP sample to the Sestito et al. (2019) sample. After correcting the parallaxes for the zero-point
offset, we only retain stars with positive parallaxes, and a
relative error on the latter smaller than 20%. We then es-timate the distances of stars by simply inverting the paral-laxes, and integrate their orbits in the same potential and with the same numerical method adopted for the LP sam-ple (see Sect. 3.1). Uncertainties on positions, velocities, and resulting orbital parameters are also estimated as was done for our sample (see Tables B.5 and B.6). The advantage of this approach is the choice of the same methods and correc-tions for all stars, the disadvantage, of course, is the reduced statistics. The selection of the quality of parallaxes indeed severely reduces the sample from 42 to 15 members. Two stars of the 15, with Gaia id 5000753194373767424 and 6692925538259931136, are common to the LP First stars sample.
– The sample of metal-poor stars studied by Nissen & Schus-ter (2010) (see also Nissen & SchusSchus-ter 2011; SchusSchus-ter et al. 2012; Nissen & Schuster 2012). This sample consists of 94 dwarf stars in the metallicity range −1.6 < [Fe/H] < −0.4. The kinematics and orbital properties of stars in this
sam-ple were discussed in Nissen & Schuster (2010) and Schus-ter et al. (2012). We recalculated these properties using
GaiaDR2 astrometry and by employing the same selection
of parallaxes and their relative errors, as adopted for the LP First stars and Sestito et al. (2019) samples, as well as by making use of the same Galactic potential for orbit integra-tion. The final sample contains 84 stars.
– The Gaia DR2-APOGEE sample studied by Di Matteo et al. (2018). This sample is the result of cross-matching the
GaiaDR2 (Gaia Collaboration et al. 2018a) with APOGEE
data from DR14 (Majewski et al. 2017), using the CDS X-match service. To construct this sample, we selected stars in the two catalogues with a position mismatch tolerance of of 0.5 arcsec, and retained only those with positive parallaxes, relative error on parallaxes less than 20%, and a
signal-to-noise ratio in the APOGEE spectra, SNR> 100. Also in this
case, parallaxes have been corrected for the zero-point
par-allax offset. All line-of-sight velocities used for this
sam-ple are from APOGEE. Following the study of Fernández-Alvar et al. (2019), we applied additional selection criteria
only retaining stars with effective temperatures, Teff >4000,
and gravities, 1<log(g)<3.5. Finally, we also removed all
APOGEE stars with ASCAPFLAG and STARFLAG warn-ing of any problems with the determinations of the atmo-spheric parameters (specifically those with a warning about
the reliability of the effective temperature, log(g), rotation
and having a very bright neighbour). After applying all these selection criteria, our final sample consists of 61789 stars. Also for this sample, we have derived positions and veloci-ties of stars as described in Sect. 3.1 and integrated the orbits for 6 Gyr in the PII Galactic potential described in Pouliasis et al. (2017).
Figure 4 shows the normalised [Fe/H] distributions of stars
in these samples, as compared to the LP distribution, and their spatial distribution in the galactic plane (XY), as well as in the meridional plane (RZ). The Nissen & Schuster (2010) sample is very local (distances from the Sun less than about 300 pc), the other samples span a larger range of distances from the Sun. In particular, we note that the APOGEE sample lacks stars in the fourth quadrant, and that this gap is partially filled by the LP First stars and samples from Sestito et al. (2019). While the dif-ferences in the spatial extension and coverage of all these sam-ples must be taken into account, the advantage of this approach is to compare the kinematics of stars in the Galaxy over a range of nearly 7 dex in [Fe/H], something that, to our knowledge, was done here for the first time.
4.1. Spanning 7 dex in [Fe/H]: the ubiquity of the Galactic disc
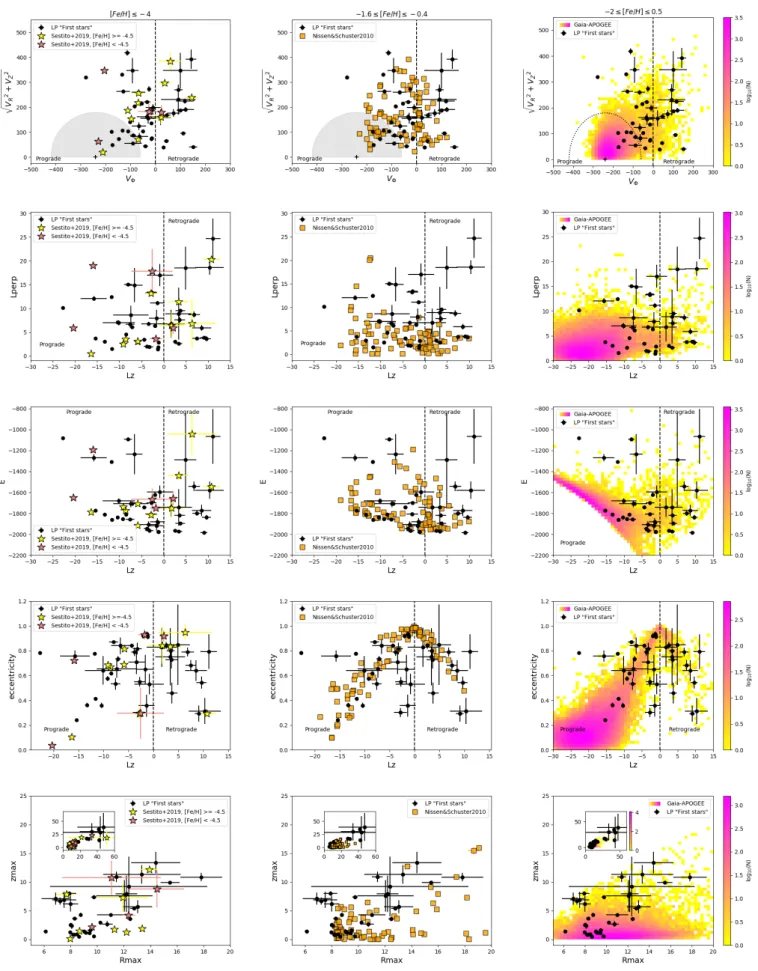
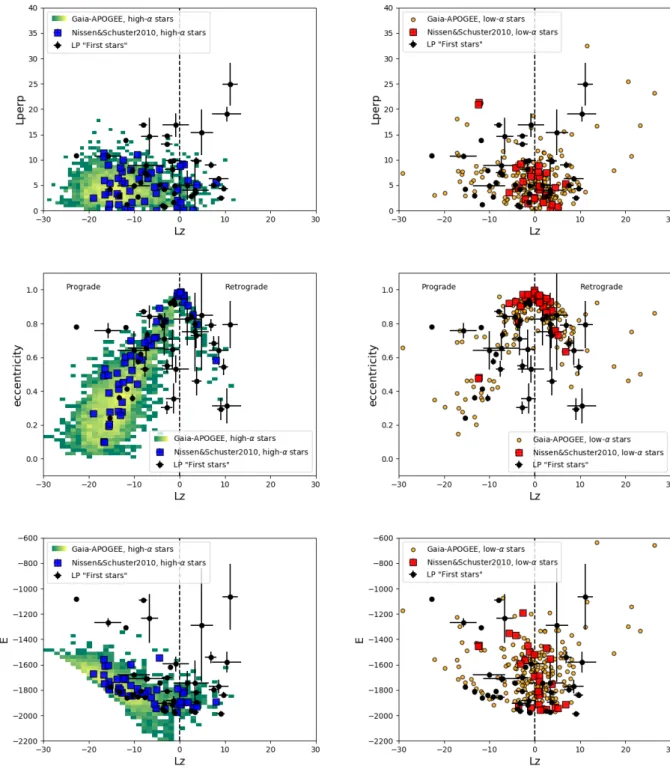
Figure 5 shows the Toomre diagram, the E −Lzplane, the ecc−Lz
plane and the Rmax− zmaxplane for all stars in the LP sample,
compared, respectively, to the Sestito et al 2019 sample, the Nissen & Schuster 2010 sample, and the Gaia DR2-APOGEE sample. The VMP and EMP stars of our sample show striking similarities in all these planes with the UIP stars from Sestito et al 2019. The two samples essentially show the same distribution in all these spaces. In both samples, about 20% of the stars have disc-like kinematics. This fraction is comparable to that derived by Sestito et al. (2019), using all 42 stars, and not our restricted sample of 15, thus suggesting that our cut on parallax errors did not introduce any bias in the relative fraction of stars
Fig. 5. From top to bottom: Toomre diagram, E − Lz, ecc − Lzand Rmax− zmaxplanes for stars of LP First stars (black dots), compared to the Sestito et al 2019 sample (yellow stars, first column), the Nissen & Schuster 2010 sample (orange squares, middle column), and the Gaia DR2-APOGEE sample (density map, right column). The vertical dashed lines separate prograde from retrograde motions. Velocities are in units of km/s, distances are in units of kpc, angular momenta are in units of 100 kpc km/s, and energies in units of 100 km2/s2.
(2019), some stars in the sample have very low eccentricities, like 2MASS J18082002-5104378 (Meléndez et al. 2016), which
is on a circular orbit (ecc = 0.1). Stars on disc-like orbits
are thus found all along the [Fe/H] sequence, from the most
metal-poor stars up to the most metal-rich samples (Nissen & Schuster 2010, Gaia DR2-APOGEE), suggesting that, despite
their different abundances and iron contents, a fraction of the
UIP, EMP, VMP, and metal-poor stars can all share the same common origin, tracing the early phases of the Milky Way disc formation (see also the recent work by Venn et al. 2019, for the finding of a EMP star with disc-like kinematics).
While a non-negligible fraction of stars have disc-like kine-matics, the majority of the UIP stars, as well as the VMP and EMP stars, have halo-like kinematics. This does not necessarily mean that they are all accreted, since a fraction of the halo can be made of stars formerly in the disc, but later kinematically heated to halo kinematics by one or several satellite accretions. This has indeed proven to be the dominant in-situ mode of formation of the Galactic halo for stars at higher metallicities, and at few kpc from the Sun (see Di Matteo et al. 2018), as we discuss more extensively in the next section. It is, however, interesting to note that, compared to stars at higher metallicities, such as stars in the Nissen & Schuster sample and stars in the
Gaia DR2-APOGEE sample (middle and right columns in
Fig. 5), in the Toomre diagram, the UIP and LP samples seem to lack stars with null angular momentum, meaning along the
Lz = 0 line. At values of
p
(VR2+ VZ2) & 200 km/s, stars
with [Fe/H] < −4 have rather prograde or retrograde motions, but none seem to lie along the sequence of accreted halo stars discovered by Nissen & Schuster 2010, and later confirmed in Gaia DR1 and DR2 data by Belokurov et al. (2018) (Gaia Sausage), Haywood et al. (2018), Helmi et al. (2018) (Gaia Enceladus). The Gaia Sausage, which is this group of halo stars
with very radial orbits, and null VΦ, seems to indeed disappear
at [Fe/H] < −2 in this plane. We emphasise that this apparent
difference between the kinematics of VMP and EMP stars,
on the one side, and stars with [Fe/H] > −2, on the other
side, is simply the consequence of these stars probing different
regions and distances from the Galactic centre. Indeed, when one compares the kinematics of these different samples of stars
in the quasi-integral-of-motion space Lz− Lper pplane (see Fig 5,
second row), rather than in the Toomre diagram, the kinematic
properties of these samples are the same, over the whole [Fe/H]
interval. Before moving further, we need, however, to emphasise two points of the comparison with samples at higher metallicity. Firstly, when compared to the Nissen & Schuster (2010) sample, which, we remind the reader, is a kinematically selected sample of thick disc and halo stars, the VMP and EMP stars in the LP First stars sample show an excess of stars at retrograde motions (positive Lz, i.e. Lz > 5 ) and high values of Lper p(Lper p > 15).
None of the Nissen & Schuster (2010) stars occupy this region
of the Lz− Lper pdiagram, and we suggest this is a consequence
of the ‘local’ character of stars in the Nissen & Schuster (2010) study, which are all limited to a few hundred parsecs from the Sun. Indeed, when VMP and EMP stars are compared to stars in the Gaia DR2-APOGEE sample, one can see that stars with
Lzand Lper pas extreme as Lz> 5 and Lper p> 15 are found also
in the latter. Secondly, because in the comparison shown in this figure we used all stars in the Gaia DR2-APOGEE sample, not restricting ourself to stars from the kinematically defined thick disc and halo, the reader will not be surprised to find that the majority of stars in Gaia DR2-APOGEE sample are stars with
cold (i.e. thin) disc-like kinematics, their distribution peaking at
Lz∼ 20 and Lper p ≤ 5. At this stage, what is important to retain
is that the region occupied by all these samples, independently
of their [Fe/H] ratio, is the same: the relative fraction of stars in
one or in another region of the space under analysis can change from one sample to another, but not their overall distribution.
Finally, the last two rows of Fig. 5 show the comparison be-tween the LP First stars sample with the other datasets in the
ecc − Lzand Rmax− zmax plane. The reader may notice that the
similarity in the kinematic properties of stars, along 7 dex in [Fe/H] is also remarkable in these planes. When compared to the Sestito et al. (2019) sample, the distribution is similar both
in the ecc − Lzand Rmax− zmaxplanes. It is remarkable that the
two stars with the lowest eccentricity among all the stars with [Fe/H] ≤ −2 are stars of the Sestito et al. (2019) sample, and have eccentricities below 0.2. The comparison with samples at higher metallicities shows, overall, a good agreement, even if
we note the absence (in the LP sample) of stars with low zmax
and Rmax > 10 kpc (see comparison with the Nissen &
Schus-ter (2010) sample and with the Gaia DR2-APOGEE sample. For
the time being, it is difficult to say whether this difference is real
or not. We note, however, that this difference seems peculiar to
the LP sample, and it is not evident when the high-metallicity samples are compared to stars from Sestito et al. (2019). In this
latter case, some stars have limited zmaxbut in-plane apocentres
Rmax> 10.
4.2. Comparing with in-situ and accreted stars at [Fe/H] > −2
While in the previous section we compared the kinematic and orbital properties of the LP sample to stars of lower and higher metallicities, in this section we push the comparison with the higher metallicity samples (Nissen & Schuster 2010, Gaia
DR2-APOGEE) further. The metallicity range −2 . [Fe/H] . −0.5
is particularly interesting for stellar population studies because stars in this [Fe/H] interval are grouped into two separate chemi-cal sequences: a high-α sequence, made of thick disc and in-situ halo stars, and a low-α sequence, interpreted as made of accreted stars (see Fig. 6, first column). These two distinct chemical se-quences, discovered by Nissen & Schuster (2010), on the basis
of their [α/Fe] content, have since been confirmed as two
dis-tinct sequences based on a number of other elemental abundance ratios (seee Nissen & Schuster 2011; Schuster et al. 2012; Nis-sen & Schuster 2012). As shown by Hayes et al. (2018), in a study based on the analysis of APOGEE data, and by Haywood et al. (2018) on the basis of Gaia DR2 data, these stars represent the sampling at the solar vicinity of a much extended structure, visible up to several kpc from the Sun, now referred to as the Gaia Sausage (Belokurov et al. 2018) or Gaia Enceladus (Helmi et al. 2018). While the Nissen & Schuster sample is limited in terms of statistics, it does have an exquisite spectroscopic qual-ity that makes it ideal for a first comparison with our samples of VMP and EMP stars. The Gaia DR2-APOGEE sample, in turn, provides a much larger statistics, and extends the comparison to regions beyond the solar vicinity, up to several kpc from the Sun. Figure 6 (middle and right columns) shows the Toomre dia-gram of stars in the in-situ and accreted sequences of the Nissen & Schuster (2010) and Gaia DR2-APOGEE samples. For the former sample, we used the classification given in the work by Nissen & Schuster (2010) to distinguish in-situ (high-α, thick disc and halo) from accreted (low-α) stars. For the latter sam-ple, to have a clean separation between these two populations
Fig. 6. First row, left panel: [Mg/Fe] versus [Fe/H] distribution for stars in Nissen & Schuster 2010 sample. Red colours indicate low-α stars, blue colours indicate high-α (thick disc and halo) stars, following the classification given in Nissen & Schuster 2010. First row, middle panel: Toomre diagram of LP First stars (black dots), and of the high-α (thick disc and halo) stars in the Nissen & Schuster 2010 sample (blue squares). First row, right panel:Toomre diagram of LP First stars (black dots), and of the low-α stars in the Nissen & Schuster 2010 sample (red squares). The grey area in this panel and in the previous one separates stars with pVR2+ (VΦ− VLS R)2+ VZ2 ≤ 180 km/s from stars with higher relative velocities with respect to the LSR. The vertical dashed lines separate prograde from retrograde motions. Second row, left panel: [Mg/Fe] versus [Fe/H] distribution for stars in the Gaia DR2-APOGEE sample. The distribution of the whole sample is shown by grey dots and contours, while the distribution of stars selected as in-situ, high-α stars and accreted, low-α stars are shown, respectively, with blue and red dots. Second row, middle panel: Toomre diagram of LP First stars (black dots), and of the high-α stars in the Gaia DR2-APOGEE sample (density map). Second row, right panel: Toomre diagram of LP First stars (black dots), and of the low-α stars in the Gaia DR2-APOGEE sample (density map). The grey dashed curve in this panel and in the previous one separates stars with pVR2+ (VΦ− VLS R)2+ VZ2≤ 180 km/s from stars with higher relative velocities with respect to the LSR. The vertical dashed lines separate prograde from retrograde motions.
in the [Mg/Fe]-[Fe/H] plane, we adopt a separation similar to
that already used by Di Matteo et al. (2018), defining in-situ and accreted stars, respectively, as stars above and below a
separating line [Mg/Fe] = −0.26 × [Fe/H]). In particular,
ac-creted stars are defined as those with a [Mg/Fe] content at least
0.1 dex below this line, for any given value of [Fe/H], in
or-der to minimise any contamination between the two samples. For the in-situ population, we restrict the search to metallicities −1.5 ≤ [Fe/H] ≤ −0.5, thus using a metallicity interval similar to that of the Nissen & Schuster stars, while to also remove the contamination from the metal-poor thin disc, accreted stars from
the low-α sequence are selected only if their [Fe/H] is lower than
-0.7 dex. These choices of course drastically reduce the statistics of the accreted sequence, but have the advantage of minimising any contamination from the thick disc and thin disc populations. The comparison between these two sets of in-situ and accreted stars and our LP sample shows that the accreted versus in-situ nature of each star in the sample is difficult to establish on the basis of the Toomre diagram alone. Stars with disc kinematics
(i.e. stars with pVR2+ (VΦ− VLS R)2+ VZ2 ≤ 180 km/s) in the
LP sample are mostly possibly in-situ, since all stars in the Nis-sen & Schuster (2010) sample with disc-like kinematics have an in-situ origin (see top-middle panel of Fig. 6).
A second avenue for understanding the accreted or in-situ nature of stars in our sample is to compare them to the Nissen &
Schus-ter (2010) and Gaia DR2-APOGEE samples in the Lz− Lper p
plane (see Fig. 7, top panels). Stars in the LP sample with
Lz . −10 (8 out of 42) lie on a region mostly (but not
excu-sively) occupied by in-situ stars, both of the Nissen & Schuster (2010) and of the Gaia DR2-APOGEE sample. The region with
with Lper p & 13 and Lz & −10 (8 out of 42) is mostly, if not
only, populated by accreted stars both in the Nissen & Schuster (2010) and in the Gaia DR2-APOGEE sample, but not by their in-situ counterpart. On the basis of this argument, we suggest
that stars in the LP sample in this region of the Lz− Lper pplane
are mostly accreted. However, the nature of the majority of the
sample, that is of LP First stars with Lz& −10 and Lper p. 13 is
more difficult to establish: this region is the locus where stars of
the Gaia-Sausage-Enceladus are redistributed, but also the locus of in-situ stars heated to halo-like kinematics by the accretion(s),
the so-called ‘plume’ identified in the vΦ− [Fe/H] plane (see Di
Matteo et al. 2018).
Some additional information comes from the comparison in the
ecc − Lzand E − Lzplanes (see Fig. 7, second and third rows):
while we note, once again, the significant overlap of in-situ and
accreted stars in kinematic spaces, and thus the difficulty of
dis-criminating, overall, the accreted or in-situ nature of stars in our sample, the comparison with stars of the Nissen & Schus-ter (2010) sequences and the high and low-α sequences in the
GaiaDR2-APOGEE samples allows us to understand the nature
Fig. 7. Left column, from top to bottom: Lz− Lper pplane, ecc − Lzplane and E − Lzplane for stars in LP sample (black dots), compared to high-α (thick disc and halo) stars of Nissen & Schuster sample (blue squares) and high-α from Gaia DR2-APOGEE sample (green density maps). Right column, from top to bottom: Lz− Lper pplane, ecc − Lzplane and E − Lzplane for stars in the LP sample (black dots), compared to low-α stars of the Nissen & Schuster sample (red squares) and low-α stars from the Gaia DR2-APOGEE sample (orange points).
with ecc < 0.4 and low, negative Lz that we already discussed
in Fig. 5, are most probably in-situ (they lie within 2σ from the
ecc − Lzdistribution of high-α stars in the Gaia DR2-APOGEE
sample). Stars with energies E > −1500 are most probably ac-creted, because they lie in a region populated only by accreted stars of the Gaia DR2-APOGEE and Nissen & Schuster (2010) samples.
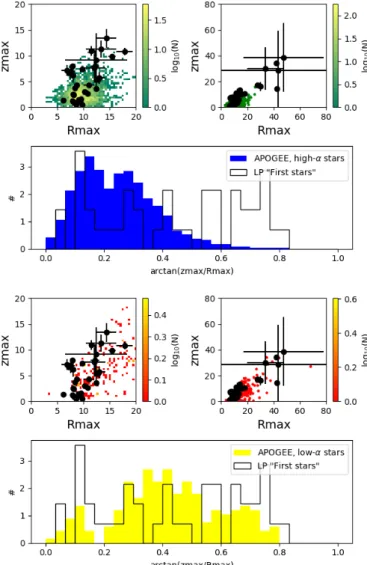
Finally, we conclude with a discussion of the Rmax− zmaxplane
(see Fig. 8 and Fig. 9). The existence of structures in the
zmax− Rmaxplane among stars with −1.5 . [Fe/H] . −0.5 was
already noted by Schuster et al. (2012) and has since been con-firmed by the analysis of Gaia DR2 data thanks to the amount of available statistics and excellent quality of its astrometry (see Haywood et al. 2018). The comparison with the Nissen & Schus-ter (2010) sample allows us to understand that the wedges found
Fig. 8. Rmax−zmaxplane for stars in LP sample (black dots), compared to high- and low-α stars of Nissen & Schuster sample (respectively, blue and red squares). The top panel shows the Rmax− zmaxdistribution inside 20 kpc, the bottom panel show the distribution for the whole samples.
univocally linked to a different nature of stars than those that
make it. One may be tempted to interpret stars in the lowest wedge, meaning those with disc-like kinematics, made exclu-sively by in-situ populations, and stars with halo-like kinematics made only of accreted material. The comparison with Nissen & Schuster stars, however, discourage this conclusion, since low-α sequence (accreted) stars are found in both samples, among stars with disc-like kinematics and among stars with halo-like kinematics as well (see Fig. 8). In particular, some of the stars of
the Nissen & Schuster (2010) sample, with low zmax, and
classi-fied as accreted by Nissen & Schuster (2010) on the basis of their
low-α content, have Rmaxinside 10 kpc, which is in the same
re-gion where all the LP First stars with low-zmaxare found.
To further discuss the in-situ/accreted nature of stars in our
sam-ple, we compare their distribution in the zmax − Rmax plane to
that of in-situ and accreted stars from Gaia DR2-APOGEE (see Fig. 9). As already suggested by the analysis of the Nissen & Schuster sample, in-situ stars at few kpc from the Sun tend to
populate a very narrow region of the zmax−Rmaxplane, with 5 kpc
. Rmax . 15 kpc and zmax . 10 kpc. Only a handful of in-situ
stars in this sample have indeed Rmax> 20 kpc. Accreted stars, in
turn, have a much broader distribution in this plane, significantly
extending to Rmaxand zmaxabove 20 kpc. Another way to
appre-ciate the difference in orbital parameters of these two samples
is by comparing the distribution of the arctan (zmax/Rmax) (see
Fig. 9. Rmax−zmaxplane for stars in LP sample (black dots), compared to high-α (first row) and low-α stars (third row) of Gaia DR2-APOGEE sample. In the first and third rows, the left panel shows a zoom for stars with Rmax ≤ 20 kpc, the right panel the whole distribution.Second and fourth row: Normalised histogram of the acrtangent of the ratio zmax/Rmax for high-α stars (blue histogram, second row), and low-α stars (yellow histogram, second row) in Gaia DR2-APOGEE. In both panels, the distribution is compared to that of the LP sample (black his-togram).
second and fourth panels of Fig. 9): the distribution of the
arc-tangent of the zmax/Rmaxratio of in-situ stars shows a first local
maximum at about 0.15, a dip at 0.2, a second local maximum at 0.3, and declines very rapidly at larger arctangent values. In-situ stars with disc-like orbits constitute 40% of the total in-In-situ sample at these metallicities. The distribution of the arctangent
of zmax/Rmax is, in turn, different for the accreted population: it
shows no rapid decline above 0.2, but rather a flat distribution, and only very few stars (less than 10%) are on disc-like orbits
(arctan(zmax/Rmax < 0.2). By comparing the distribution of
ex-tremely metal-poor stars to those derived for in-situ and accreted stars in the APOGEE sample, we can conclude that:
– LP stars with high values of the arctan(zmax/Rmax) (above
∼ 0.5) are most probably accreted;
– the significant fraction of stars with disc-like orbits (∼ 24%
Fig. 10. From top to bottom: [Fe/H] distribution of stars in LP First stars sample (grey histogram), compared to [Fe/H] distribution of stars in the Roederer et al 2018 sample (turquoise); distribution in the X−Y plane of stars in LP First stars sample (black points) and of stars in Roederer et al 2018 sample (turquoise diamonds); distribution in meridional, R − Z, plane of stars in LP First stars sample (black points), and of stars in Roederer et al 2018 sample (turquoise diamonds).
cannot be explained if they all have an accreted origin. If all stars in our samples were indeed accreted, we would expect the fraction of stars with disc-like orbits to be less than 10% – by analogy with the fraction of accreted stars on disc-like or-bits in the Gaia DR2-APOGEE sample – while this fraction is 2-2.5 times larger for stars in the LP. Based on the
compar-ison with stars at higher metallicities, we thus conclude that 50 − 60% of the VMP and EMP stars on disc-like orbits are indeed in-situ stars, formed in the very early phases of the Milky Way disc assembly;
– stars with intermediate values of arctan(zmax/Rmax) (0.2–
0.5) are probably a mixture of in-situ and accreted popula-tions. By analogy with the Nissen & Schuster (2010) and
Gaia DR2-APOGEE samples, we suggest that the in-situ
stars in this intermediate range of arctan(zmax/Rmax) values
are also stars of the early Milky Way disc (thus, they have the
same origin of in-situ stars with arctan(zmax/Rmax) < 0.2),
but they were heated to halo kinematics by the major ac-cretion(s) experienced by the Galaxy over its lifetime. The relative weights of in-situ versus accreted stars in this range
are currently difficult to establish: they indeed have
compara-ble kinematics, and they are indistinguishacompara-ble both in [Fe/H],
[Mg/Fe], [Ca/Fe], and [Ba/Fe] abundances, as discussed in
the next section.
5. Adding chemical properties to the analysis: linking
α
andr−
abundances to kinematicsChemical information always provides important clues, ei-ther because it shows homogeneity, significant grouping, or dispersion in chemical abundance spaces. The sample of the LP First stars has been shown to be chemically homogeneous (see Sect. 2.2 and Fig. 2). The new information brought by
Gaia is that these stars probably have different origins, and
it is worth reconsidering these properties in the light of the analysis presented in the previous section. In this section, we thus aim to understand whether any of the kinematic properties discussed in the previous sections show any dependence on the chemical abundances of VMP and EMP stars. For stars in the
LP First stars, abundance ratios of the α elements [Mg/Fe] and
[Ca/Fe] corrected for non-LTE effects are available (Andrievsky
et al. 2010; Spite et al. 2012, and Fig. 2), together with [Ba/Fe]
and the metallicity [Fe/H] (Table 1 and Fig. 2). Together with
α−abundances, which have been shown to be good discrimi-nants between in-situ and accreted stars at higher metallicities (see Nissen & Schuster 2010; Hayes et al. 2018; Haywood et al. 2018; Helmi et al. 2018; Di Matteo et al. 2018; Mackereth et al. 2019), we are also interested in analysing the dependency
of kinematics on the [Ba/Fe] abundances. This because it has
recently been suggested that VMP and EMP r-rich objects may have an accreted origin (see Roederer et al. 2018), and we would like to re-investigate this claim in the framework of our analysis. R-rich objects, however, are relatively rare. In a sample of about 260 metal-poor stars studied within the framework of the Hamburg/ESO R-process enhanced star survey, Christlieb et al. (2004) and Barklem et al. (2005) found only 24 stars meeting
the criterion chosen by Roederer et al. (2018): [Eu/Fe]>0.7 dex,
and there are only five such stars in our sample of extremely metal-poor stars. To enrich our sample of r-rich stars, we thus decided to add the stars from the r-rich sample of Roederer et al. (2018) as long as they meet our specifications: not C-rich, not
binaries, [Fe/H] < −2 and σπ/π < 0.2. Stars in the Roederer
et al. (2018) sample that meet this criteria are 26. As mentioned is Section 2, barium is a good proxy for europium. Because our
sample lacks europium measurement for turn-off star, we rely on
barium instead, and likewise for stars analysed by Roederer et al. (2018). Their main characteristics are presented in Table B.2; in Fig.10, the histogram of their metallicity is compared to the histogram of the stars of the LP First stars; a comparison of the positions in the XY and RZ plane among these two
Fig. 11. From top to bottom: Toomre diagram, E − Lz, ecc − Lzand Rmax− zmaxplanes colour-coded by [Fe/H] (first column), and [Ba/Fe] (second column).
samples is also given. For these ‘Roederer’ stars, we adopted the radial velocity deduced from high resolution spectra given by Roederer et al. (2018). The computed distances are slightly
different from the values given by Roederer et al. (2018), since
they adopted a Bayesian estimation of the distances of the stars, while we calculate the distances by inverting the parallaxes
(corrected for the zero-point offset), as done for the previous
samples.
In Figs. 11 and 12, we analyse the same kinematic and orbital parameter spaces discussed in the previous sections
(Toomre diagram, E − Lz, ecc − Lzspace and Rmax− zmaxspaces),
this time adding the abundance information (for positions, velocities, orbital parameters, and corresponding errors of the Roederer et al. (2018) stars, see Tables B.5 and B.6). When
analysing the dependence of the results on the [Fe/H] and
[Ba/Fe] content, we also add the data from Roederer et al
2018 to increase the statistics. Whatever the abundance ratio analysed in Fig. 11, no clear dependency of the kinematics on the chemistry of the stars appears evident.
It is however interesting to see that in the Toomre diagram,
as well as in the Rmax− zmax plane, some of the stars in the
Roederer et al. (2018) sample have disc-like kinematics, thus confirming the results found for the LP First stars: eight out of the 42 stars in our sample, and 10 of the 26 stars from Roederer et al. (2018) have low kinetic energies, compared to the LSR,
with pVR2+ (VΦ− VLS R)2+ VZ2 ≤ 180 km/s, within 1-σ error;
10 of the 42 stars in our sample, and seven of the 26 stars from
Roederer et al. (2018) have arctan(zmax/Rmax) < 0.2. This result
does not confirm the conclusion of Roederer et al. (2018), who claimed that their sample did not include stars with disc-like kinematics, and we go on to discuss the reasons behind these
Fig. 12. From top to bottom: Toomre diagram, E − Lz, ecc − Lzand Rmax− zmaxplanes colour-coded by [Mg/Fe] (first column), [Ca/Fe] (second column).
different conclusions.
Evidence that there is no clear correlation between the
[Fe/H], [Mg/Fe], [Ca/Fe] and [Ba/Fe] content and the stellar
kinematics is also provided in Fig. 13, where stars in our samples
are plotted in the [Mg/Fe]-[Fe/H], [Ca/Fe]-[Fe/H], and
[Ba/Fe]-[Fe/H] planes and colour-coded by their angular momenta Lz,
their orbital energy E and the arctangent of the zmax/Rmaxratio.
Stars from Roederer et al. (2018) are also plotted in the [Ba
/Fe]-[Fe/H] plane. In Roederer et al. (2018), the authors conclude that r-enhanced stars in particular are probably accreted because they do not find r-enhanced objects with disc kinematics. The key dif-ference with our analysis, however, is how Roederer et al. (2018)
define disc stars, as those with pVR2+ (VΦ− VLS R)2+ VZ2 ≤
100 km/s. That is, their definition of the disc kinematics is much
more restrictive than ours, and more restrictive than definitions
usually adopted in the literature. Clearly, among stars in the Roederer et al. (2018) sample, some have (thick) disc-like kine-matics. Moreover, because of such a restrictive definition of the disc kinematics, and because none of their stars fit this defini-tion, Roederer et al. (2018) conclude that their sample must ex-clusively contain halo-like objects (either being genuine in-situ halo stars, or having been kinematically heated from the disc, or accreted). However, they favour the accreted origin of stars in their sample because they are able to assign most of the stars to groups, or overdensities, in kinematic spaces. This approach is fraught with errors, because it has been shown that accretions
with the mass ratio of the Gaia Sausage (& 1 : 10) leave
substan-tial grouping in kinematic spaces even for stars already present in the Galaxy at the time of accretion (Jean-Baptiste et al. 2017), and that several distinct groups can all have the same in-situ or accreted origin. In other words, belonging to a kinematic group is not in itself an indication that a star has been accreted (again,
Fig. 13. From left to right: Stars in [Mg/Fe]-[Fe/H], [Ca/Fe]-[Fe/H] and [Ba/Fe]-[Fe/H] planes colour-coded by their angular momentum Lz(first row), their orbital energy E (second row), and arctangent of the ratio zmax/Rmax(third row). Stars from Roederer et al 2018 are also plotted in the Ba/Fe]-[Fe/H] plane.
see the results by Jean-Baptiste et al. 2017). Among the 14 stars (out of 26) in the sample of Roederer et al. (2018) that have
zmax < 5 kpc, all have Rmax < 12 kpc (and in fact most have
Rmax< 10 kpc), and while this is not a guarantee that they are all
(thick) disc objects, at least half must belong to this population (see previous section).
We therefore cannot conclude with Roederer that disc stars are not r-enhanced, and that r-enhancement is a signature of an ex-tragalactic origin of a star. This is discussed further in the next section.
6. Discussion
We now summarise the results obtained in the previous sections. – Firstly, we showed that the kinematic and orbital properties of stars at [Fe/H] <∼ −0.4 are surprisingly similar at all metallicities (see Fig. 6), as already emphasised in Sect. 4.1.
By this we mean that the different samples occupy similar
regions in kinematic spaces, independently of their [Fe/H].
This does not imply, of course, that their density distributions in any of those kinematic spaces are the same (because the latter property depends, at least, on the selection function of
each sample). At high metallicities (−1.5. [Fe/H] . −0.4),
these properties are dominated by two populations that can clearly be identified as accreted stars from the so-called Gaia Sausage-Enceladus event (Belokurov et al. 2018; Haywood et al. 2018; Helmi et al. 2018), and the α-enhanced thick disc, partially heated to halo kinematics (Bonaca et al. 2017; Haywood et al. 2018; Di Matteo et al. 2018; Gallart et al. 2019; Belokurov et al. 2019). There is no evidence, from our analysis, that the data studied here contain other populations in significant proportions.
– Secondly, the chemical abundances investigated here (bar-ium, calc(bar-ium, and magnesium) demonstrate no obvious
de-pendence on kinematics, and in particular no obvious di
ffer-ence among possibly in-situ and accreted stars. As long as it was assumed that an in-situ halo was formed in the Galac-tic halo, the match found with accreted stars would have not been surprising: they could have formed from the same kind of environment, or Galactic sub-haloes. However, with the increasing evidence that in-situ stars at [Fe/H] < −0.5 have more likely formed in a (massive) disc, then the similarity in the abundance ratios between in-situ and accreted stars raises new questions.
6.1. Evidence of the ubiquity of the Galactic thick disc, from [Fe/H] ∼ −6 to nearly solar [Fe/H]
Sestito et al. (2019) discuss the implication of their findings on the existence of ultra metal-poor stars on disc-like orbits for the first stages of the formation of the Milky Way. Among
the different scenarios they propose, they envisage that stars in
their sample with disc-like orbits could belong to the thick disc population, and the link we make in this paper with populations at higher metallicities put this hypothesis on a more robust basis.
Sestito et al. (2019) discuss three different scenarios for the
formation of their ultra metal-poor disc stars: (1) they originate in the early Galactic disc; (2) they could have been accreted, even if the authors themselves cast doubts on this hypothesis, since the only (up to now) evident massive merger experienced by the Galaxy is represented by Gaia Sausage-Enceladus, which
brought mainly stars on retrograde or low Lz orbits; (3) they
could be the remnants of massive building block(s), or clumps, of the proto-Milky Way that formed the backbone of the Milky Way disc.
While we note that scenarios (1) and (3) are not necessarily distinct and may have some overlap, we think that the continuity found here in the orbital and kinematic properties of stars on the whole metallicity range support the conclusions of Sestito et al. (2019) that stars with prograde motion exist with similar char-acteristics from the highest metallicities (−1. ≤ [Fe/H] ≤ −0.3), where they can formally be identified as α-enhanced thick disc stars, to metallicities in the range −2 ≤ [Fe/H] ≤ −1 (the so-called metal-weak thick disc, see Norris et al. 1985; Morrison et al. 1990; Chiba & Beers 2000; Beers et al. 2002; Reddy & Lambert 2008; Brown et al. 2008; Kordopatis et al. 2013; Hawkins et al. 2015; Li & Zhao 2017; Hayes et al. 2018; Di Matteo et al. 2018) all the way down to metallicities as low as [Fe/H] ∼ −6. So the simplest deduction that can be made is that very metal-poor, extremely metal-poor and ultra iron-poor stars with disc-like kinematics (or at least the majority, see Sect. 4.2) are stars born in the Galaxy itself in the very early phases of its formation. These stars all experienced the same heating events culminating with the end of the accretion of Gaia Sausage-Enceladus, visible at [Fe/H] ∼ −0.3, and [Mg/Fe] ∼ 0.2, that is about 10 Gyr ago (Di Matteo et al. 2018; Gallart et al. 2019; Belokurov et al. 2019). This ultra iron-poor thick disc is of fundamental importance to trace the disc formation back in time, up to the most metal-poor and first stars discovered up to date. We note that Beers & Sommer-Larsen (1995) suggested that the metal-weak thick disc extended below metallicity –2.0, and in fact, one of the metal-weak thick disc candidates, observed at spectral high resolution by Bonifacio et al. (1999), CS 29529-12
with [Fe/H]=–2.27, is indeed on a thick disc orbit, according to
its Gaia DR2 parallax and proper motions.
How do these results compare with state-of-the-art simula-tions? Simulations have indicated consistently over the last 15 years that the most ancient stars are concentrated in the inner part of Milky-Way-type galaxies, (see, for example Diemand et al. 2005; Gao et al. 2010; Tumlinson 2010; Ishiyama et al.
2016; Griffen et al. 2018), and are usually made of stars formed
in sub-haloes that merge to form a central concentration. Nei-ther of the two populations of VMP and EMP discussed seems to be consistent with this picture. The accreted population, like its counterpart at high metallicity, could be explained by a sin-gle event, the Gaia Sausage, whose stars redistribute over a large range of kinematic and orbital properties. The results presented here and in Sestito et al. (2019) indicate that at least a fraction of
the most metal-poor and possibly oldest in-situ stars formed in the Galaxy have similar kinematic properties to what is known nowadays, at higher metallicities, like the thick disc population. Several studies (e.g. Purcell et al. 2010; Qu et al. 2011; Mc-Carthy et al. 2012) have found that an in-situ halo may origi-nate from a disc of stars heated by interactions and accretions. As a matter fact, McCarthy et al. (2012) find that their in-situ halo stars have formed at relatively late times z < 2. The most recent simulations may point in the right direction. For instance, Pillepich et al. (2019) present simulations where galaxies are
ro-tationally supported very early on, with Vrot/σ > 2 − 3 already
at redshift z= 5 and below. However, at this redshift, stars are
predicted to have metallicities around [Fe/H] ∼ −2 (Tumlinson 2010; Starkenburg et al. 2017), and so are at the upper limit of the sample studied here. The data therefore indicate that the Milky Way disc probably settled at redshift z > 5, with stars at
metal-licities of about [Fe/H] = −4 or −5 formed at redshift z > 6.
This is yet to be found in simulations and in observations of disc morphologies at these redshifts.
6.2. Accreted stars at [Fe/H] ≤ −2 and the difficulty of using chemical abundances to discriminate the nature of very metal-poor and extremely metal-poor populations Regarding stars with halo kinematics, Sestito et al. (2019) divide those in their sample in inner (apocentres inside 30 kpc) and outer (apocentres greater than 30 kpc) halo, suggesting a
possible different origin. The comparison we made in Sect. 4.1
with higher metallicity samples, and in particular with the
GaiaDR2-APOGEE stars, suggests that stars with high
apoc-entres in the Sestito et al. (2019) and in our samples could all be related to the same accretion event known as Gaia Sausage-Enceladus. The homogeneity of the α-element abundance ratios in the metallicity range covered by the LP First stars sample
also supports this view4. Inner halo stars appear, in turn, as a
melangeof stars from the Gaia Sausage-Enceladus and of stars
of the early Milky Way disc heated to halo kinematics.
The situation for enhanced r-process elements is more complex. We do not confirm the conclusions of Roederer et al. (2018) about the nature of stars with enhanced r-process elements: as traced here by barium, there is no evidence that these stars have all an accreted origin. More precisely, the barium-rich stars studied by Roederer et al. (2018) show no sign, from their kinematics and orbital properties, that they originate from any other population than those associated with the Gaia Sausage-Enceladus or the early Galactic disc, partially heated to halo kinematics. We emphasise once more that the distribution of stars in several N -independent groups in kinematic spaces is not an indication either of their accreted origin or of their belonging to N -distinct satellites (Jean-Baptiste et al. 2017). Some of the stars studied by Roederer et al. (2018) clearly have (thick) disc-like orbits, or lie, in kinematic spaces, in regions occupied at higher metallicities, by the Gaia Sausage. Before making the hypothesis that these stars are associated with low-mass dwarfs,or ultra-faint galaxies, as suggested by Roederer et al. (2018), we first need to robustly demonstrate that they are neither stars of the disc or of the in-situ halo (that is the
4 Here we mean that the LP First stars are homogeneous given the uncertainties on the abundance estimates (of the order of 0.15 dex for [Ca/Fe] and 0.2 dex for [Mg/Fe], see Fig. 2). In these very metal-poor stars with a metallicity far from the Sun, the individual uncertainties do not come from the observed spectra, but mainly from the uncertainties on the model parameters.
![Fig. 2. From top to bottom: [Fe/H] distribution (hatched black) of stars in sample. The grey histogram shows the [Fe/H] distribution of giant stars, the red histogram that of turnoff stars; [Mg/Fe] − [Fe/H] and [Ca/Fe] − [Fe/H] distributions of stars in th](https://thumb-eu.123doks.com/thumbv2/123doknet/14771953.591688/4.892.91.390.110.856/distribution-hatched-sample-histogram-distribution-histogram-turnoff-distributions.webp)
![Fig. 6. First row, left panel: [Mg/Fe] versus [Fe/H] distribution for stars in Nissen & Schuster 2010 sample](https://thumb-eu.123doks.com/thumbv2/123doknet/14771953.591688/11.892.70.818.101.469/first-panel-versus-distribution-stars-nissen-schuster-sample.webp)
![Fig. 10. From top to bottom: [Fe/H] distribution of stars in LP First stars sample (grey histogram), compared to [Fe/H] distribution of stars in the Roederer et al 2018 sample (turquoise); distribution in the X −Y plane of stars in LP First stars sample (b](https://thumb-eu.123doks.com/thumbv2/123doknet/14771953.591688/14.892.83.392.107.867/distribution-sample-histogram-compared-distribution-roederer-turquoise-distribution.webp)
![Fig. 11. From top to bottom: Toomre diagram, E − L z , ecc − L z and R max − z max planes colour-coded by [Fe / H] (first column), and [Ba / Fe] (second column).](https://thumb-eu.123doks.com/thumbv2/123doknet/14771953.591688/15.892.212.686.88.774/toomre-diagram-planes-colour-coded-column-second-column.webp)
