HAL Id: hal-01932907
https://hal.archives-ouvertes.fr/hal-01932907
Submitted on 23 Nov 2018
HAL is a multi-disciplinary open access
archive for the deposit and dissemination of
sci-entific research documents, whether they are
pub-lished or not. The documents may come from
teaching and research institutions in France or
abroad, or from public or private research centers.
L’archive ouverte pluridisciplinaire HAL, est
destinée au dépôt et à la diffusion de documents
scientifiques de niveau recherche, publiés ou non,
émanant des établissements d’enseignement et de
recherche français ou étrangers, des laboratoires
publics ou privés.
CLOUD MICROPHYSICAL PROPERTIES OF
SUMMERTIME ARCTIC STRATOCUMULUS
DURING THE ACLOUD CAMPAIGN :
COMPARISON WITH PREVIOUS RESULTS IN THE
EUROPEAN ARCTIC
Régis Dupuy, O. Jourdan, G. Mioche, A Ehrlich, F Waitz, C. Gourbeyre, E
Järvinen, M. Schnaiter, Alfons Schwarzenboeck
To cite this version:
Régis Dupuy, O. Jourdan, G. Mioche, A Ehrlich, F Waitz, et al.. CLOUD MICROPHYSICAL
PROPERTIES OF SUMMERTIME ARCTIC STRATOCUMULUS DURING THE ACLOUD
CAM-PAIGN : COMPARISON WITH PREVIOUS RESULTS IN THE EUROPEAN ARCTIC. 15th
Con-ference on Cloud Physics, 2018, Vancouver, Canada. �hal-01932907�
CLOUD MICROPHYSICAL PROPERTIES OF SUMMERTIME ARCTIC STRATOCUMULUS
DURING THE ACLOUD CAMPAIGN : COMPARISON WITH PREVIOUS RESULTS IN THE
EUROPEAN ARCTIC
Regis Dupuy*1, O. Jourdan1 , G. Mioche1 , A. Ehrlich2, F. Waitz3, C. Gourbeyre1 , E. Järvinen3, M. Schnaiter3, and
A. Schwarzenboeck1
(1) Laboratoire de Météorologie Physique CNRS/UCA UMR 6016, Aubière, France; (2) University of Leipzig, Leipzig, Germany; (3) Karlsruhe Institute of Technology, Karlsruhe, Germany
1. INTRODUCTION
The Arctic region is more sensitive to climate change than any other region of the Earth (Solomon, 2007). Clouds and particularly low-level cloud related processes have a major impact on the Arctic surface energy budget (Curry, 1995; Curry, 1996; Morrison, 2011). Observations suggest that boundary layer mixed phase clouds (MPC, mixture of liquid droplets and ice) are ubiquitous in the Arctic and persist for several days under a variety of meteorological conditions (Mioche, 2015; Morrison, 2012; Shupe, 2011; Shupe and Intrieri, 2004). They occur as single or multiple stratiform layers of supercooled droplets near the cloud top from which ice crystals form and precipitate (Mioche, 2017). The microphysical properties of these clouds have a large impact on the surface radiative fluxes and Arctic climate feedbacks (Kay, 2012; Kay and Gettelman, 2009) but are often poorly predicted by models (Forbes and Ahlgrimm 2014). In particular, a correct representation of MPC ice nucleation process and liquid-ice partitioning in numerical models is needed for both weather forecasts and climate prediction (Barret, 2017a,b).
In May-June 2017, a suite of “in situ” microphysical probes was deployed on-board the AWI Polar 6 aircraft during the ACLOUD experiment in the Svalbard region (Arctic Cloud Observations Using airborne measurements during polar Day). ACLOUD is a joint project of different German universities and research institutes embedded in the Transregional collaborative research center (AC)3. The general goal of ACLOUD is to gather a comprehensive data set of what will contribute to a process level understanding of clouds in the Arctic and their role in the amplified climate change observed in this region.
This campaign gave us the opportunity to explore the microphysical properties of summer arctic stratocumulus clouds over different surface conditions (open sea, sea ice and marginal sea ice zone). Cloud vertical profiles of liquid and ice water content, number concentration and effective size are presented under different surface conditions air mass origin.
These results are compared to previous studies from Lloyd (2015) performed during the ACCACIA campaign (summer/spring cloud over open sea), Young (2016, spring cloud transition from sea ice to open sea) as well as with cloud vertical profiles
established by Mioche et al. (2017) over the Greenland and Barents seas. Hereafter, these studies will be referred as L15, Y16 and M17 respectively.
2. INSTRUMENTATION
The instrumentation used in the present study was installed on the Polar 6 aircraft of the Alfred Wegener Institute (AWI). It is a modified DC-3 aircraft of the type Basler BT-67 with an endurance of up to 2300 km and a ceiling of 7.6 km altitude. Its cruise speed is between 10 and 150 knots and can operate for 6 to 7 hours with a take-off weight of 14 tons.
The Small Ice Detector (SID-3) instrument (Kaye, 2008; Vochezer, 2016) measures the size distribution of cloud particles from 5 to 50 μm. From a sub-sample of particles the spatial intensity distribution of the light scattered in the angular range of 7º to 23º is recorded as a two-dimensional scattering pattern. These patterns can be analyzed for the particle shape and sub-micrometer scale complexity (Vochezer, 2016; Schnaiter, 2018).
The Cloud Droplet Probe (CDP) is a forward scattering optical spectrometer using a single mode diode laser at a wavelength of 0.658 μm (Lance, 2010; Wendisch, 1996). The instrument counts and sizes individual droplets by detecting pulses of light scattered from a laser beam in the near-forward direction (4º – 12º), (using a calibrated sample area of 0.32 mm2). Sizes are accumulated in 30 bins with
variable sizes (1 μm wide for size lower than 14 μm or 2 μm wide for larger droplets). The CDP was equipped with anti-shattering tips to reduce possible shattering artifacts (Korolev, 2011). Microphysical quantities were derived from the measurements , such as liquid water content (LWC) and effective droplet diameter (Deff) by integrating the cloud particle number size distribution (PNSD). The acquired PNSDs have been corrected to minimize the effect of Mie sizing ambiguities using a Monte Carlo inversion method.
The Cloud Imaging Probe (CIP) and the Precipitation Imaging Probe (PIP) measure the size and shape of cloud and precipitation particles (Baumgardner, 2011). The measurement principle of these Optical Array Probes (OAPs) is based on the linear array technique to acquire the two-dimensional black and white images of particles. As the particles pass through a laser beam, the shadow they cast on a photodiode array is used to record their dimensions. The PNSDs are computed from the OAP images, but the assessment of the median mass diameter (MMD) and the ice water content (IWC) relies on the definition of the crystal diameter and its
mass-71
* Corresponding author address : Regis Dupuy, LaMP, Bat. Physique 8, 4 Avenue Blaise Pascal, TSA 60026, CS 60026, 63178 AUBIERE CEDEX, FRANCE
diameter relationship (Brown and Francis 1995). Possible contamination of shattering/splashing of ice/liquid particles on the instruments tips have been identified and removed using inter arrival time statistics (Field, 2006) and image processing.
A similar instrument payload was used for L15, Y16 and M17 dataset and a comparison of every instrumentations can be seen in table 1.
Cloud Probes Size Range Parameters Polar Nephelometer (PN) Few µm to ~800 µm
Scattering phase function, asymmetry parameter (g), extinction coef. Forward Scatterring Probe (FSSP) 3 µm to 45 µm
Droplets size distribution, LWC
Cloud Particle Imager (CPI)
~15 µm to 2.3 mm
Ice particle size distribution, shape, IWC
2D-Stereo (2D-S)
~10 µm to 1.3 mm
Ice particle size distribution, shape, IWC Cloud Droplet
Probe (CDP)
3 µm to 45 µm
Droplets size distribution, LWC
Cloud Droplet Probe (CDP)
3 µm to 45 µm
Droplets size distribution, LWC Small Ice Detector (SID3) 3 µm to 45 µm
Droplets size distribution, LWC
Cloud Image Probe (CIP)
~25 µm to 1.6 mm
Ice particle size distribution, shape, IWC Table1 : List of the probes used for M17 study (in red), ACCACIA campaign (L15 and Y16 studies, in blue) and this study (in black) to characterize the liquid and ice properties of the Arctic Stratocumulus Clouds.
3. DATA PROCESSING AND CLUSTERING
3.1. Meteorological conditions
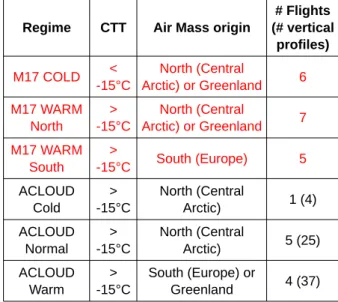
The meteorological conditions used in this study are precisely described in M17 and Knudsen (2018). Table 2 summarizes the synoptic regimes encountered during the airborne campaigns. Mean cloud top temperature (CTT) and air mass origin (based on HYSPLIT back trajectory computation) are also displayed as they are used in our cloud observation classification.
Since the temperature was always above -15°C during ACLOUD, the M17 COLD regime was not included in the comparison.
3.2. Liquid / Ice discrimination
The discrimination of liquid and ice particle samples is based on the circularity of particles(see Crosier et al., 2011). Cloud particle images with value larger than 1.25 are classified as ice crystals. This method is only valid for images of particles with surface larger than 16 pixels and induces that the
minimum diameter of particles identified as ice crystal is 125 microns for the CIP. In order to be consistent with previous studies, only particles with size lower than 50 µm are considered to be liquid water droplets.
Regime CTT Air Mass origin
# Flights (# vertical profiles) M17 COLD < -15°C North (Central Arctic) or Greenland 6 M17 WARM North > -15°C North (Central Arctic) or Greenland 7 M17 WARM South > -15°C South (Europe) 5 ACLOUD Cold > -15°C North (Central Arctic) 1 (4) ACLOUD Normal > -15°C North (Central Arctic) 5 (25) ACLOUD Warm > -15°C South (Europe) or Greenland 4 (37) Table2 : List of meteorological periods and their associated number of flights defined by M17 (in red) and Knudsen (2018). The number of vertical profiles has been added in brackets for ACLOUD.
3.3. Surfaces overflown
The classification of the underlying surface is based on the average sea ice concentration measurements produced by the University of Bremen from AMSR2 satellite data) :
• Above 90 % is defined as “Sea Ice” (SI)
• Between 10 and 90 % is the “Marginal Ice Zone” (MIZ)
• Lower than 10% is defined as “Open Water” (OW) • Land correspond to NaN values.
It is important to note that M17 cloud samples
were only taken over open water. 3.4. Altitude normalization
Since cloud top and cloud base heights exhibit large variability, the altitudes are normalized following the method presented in M17. The cloud top and cloud base refer to the liquid phase layer, i.e., the cloud layers containing liquid droplets (mixed-phase or liquid only). The liquid layer is identified based on the CDP and the CIP measurements. when the liquid water content is greater than 0.001 g/m3, the liquid
extinction is above 1 km-1 and the ice extinction is
lower than 0.5 km-1.
Within the liquid layers (Eq. 1) and below the cloud base (Eq. 2) the normalized altitudes Zn are
where Zn is the normalized altitude, Z the altitude
corresponding to the aircraft measurements, and Zt
and Zb the cloud top and base altitudes, respectively.
Thus, Zn = 1 corresponds to the top-of-the-cloud
liquid-containing layer and 0 to its base. Negative values characterize regions of ice precipitation below the cloud layer and the altitude of −1 defines the ground level according to Eq. (2).
To obtain representative statistical results, the cloud layers have been stratified in 10 levels with intervals of Zn = 0.2 . The vertical profiles of MPC
microphysical properties presented hereafter are obtained by averaging the in situ measurements over each normalized altitude layer.
4. RESULTS
4.1. Dataset statistical robustness
To characterize the robustness of our statistical analyses, Table 3 and 4 show the number of samples within each data cluster according to the underlying surface and the meteorological conditions. Each sample represent a 10 second average of the measurements performed by ACLOUD probes (lowest time resolution of the SID3).
These tables show that nearly no sampling was performed over Land. Thus the “over land” measurements sub-sample will not be included in the following. LIQUID samples Cold Period Normal Period Warm Period Sea Ice > 90% 0 1019 1146 90% > MIZ > 10% 307 48 556 10% > Open Water 56 419 548 Land 0 45 0
Table 3 : Number of 10 second averaged samples of the cloud liquid phase for each cluster defined by the meteorological conditions and surfaces overflown during ACLOUD campaign.
ICE samples Cold Period Normal Period Warm Period Sea Ice > 90% 0 297 1357 90% > MIZ > 10% 93 9 676 10% > Open Water 21 264 49 Land 0 26 0
Table 4 : Number of 10 second averaged samples of the cloud ice phase for each cluster defined by the meteorological conditions and surfaces overflown during ACLOUD campaign.
The cold period is hardly representative as well as the MIZ during the normal period. However since cold and normal periods exhibit similar air mass origins and mean cloud top temperature, these two periods are merged leading to the following clusters :
• ACLOUD North = Cold Period + Normal Period • ACLOUD South = Warm Period
The cloud vertical profiles are computed separately for each of these dataset clusters and presented in the following section for a better analysis and discussions of the results.
4.2. Vertical Profiles
a) Summer / Spring comparison
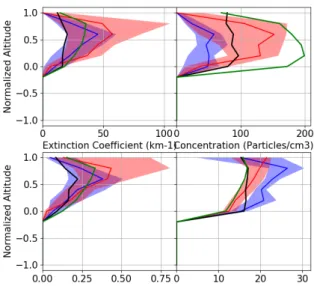
Figure 1 shows the cloud vertical profiles for the liquid phase over open water in Spring and in Summer. Higher liquid water content is found in Summer (ACLOUD) compared to M17 Warm North. However similar values and behavior are encountered when comparing the summer profiles to the Spring M17 Warm South LWC data. Significant discrepancies in the droplet number concentrations are observed. High droplet concentrations are associated with low effective sizes and air mass originating from the South. This could be indicative of a possible Twomey effect but aerosol concentration are still needed to confirm these first results.
Figure 1 : Vertical profiles (normalized altitudes) of liquid droplet extinction coefficient (a), number concentration (b), mass content (c) and effective diameter (d) median values for ACLOUD North (blue line), ACLOUD South (red line), M17 Warm North (black line) and M17 Warm South (green line). Shade of blue and red represent the interquartile values for ACLOUD North and ACLOUD South respectively.
While an earlier study by Lloyd (2015) has shown that five times more ice crystal concentrations were found in summer than in spring in this region over open water, few ice crystals are measured over open water (<1L-1) during ACLOUD (cf. Fig. 2). Ice crystals
are mainly found in the lowest cloud layer but no general trend can be depicted as the ice properties show a large variability. It is important to note though
that L15 was based on only one flight and may not be statistically comparable.
Nevertheless, the ice particles properties (concentration and size) measured over the MIZ with south air mass origin seem similar to the spring cases over open water with the same air mass origin.
Figure 2 : vertical profiles (normalized altitudes) of large (Dp>125 mm) ice crystals extinction coefficient (a), number concentration (b), mass content (c) and effective diameter (d) median values for open water (full line), marginal ice zone (dashed lines) and sea ice (dotted lines) surfaces overflown during ACLOUD North (blue lines), ACLOUD South (red lines), M17 Warm North (black line) and M17 Warm South (green line) meteorological conditions.
b) Impact of the underlying surface
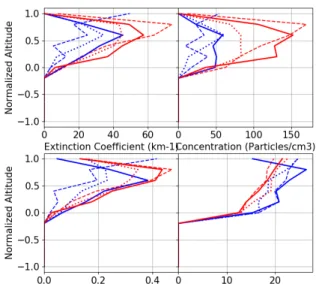
Figure 3 shows that the main differences observed in the liquid phase properties can be attributed to the large scale meteorological conditions and the air mass origin (fewer and larger droplets during Normal-Cold period) linked to the aerosol concentrations.
However, changes in droplet concentration values with the underlying surface are also observed. Over MIZ and under southerly flow, a higher droplet concentration is found at cloud top followed by a steep decrease at lower levels. This could be indicative of changes in the droplet activation conditions (supersaturation, heat flux...) linked to the surface type. Ice crystal concentrations show that MIZ > SI > OW with a maximum of 2L-1.
These trends have to be compared to previous results of Young (2016) who showed that:
• Ice crystal properties were constant with surfaces with concentrations between 0.5 and 1.5L-1
• Droplet concentration : MIZ > SI > OW
Yet, these measurements were conducted in March during one flight only and a mean top cloud temperature of -20°C.
Figure 3 : vertical profiles (normalized altitudes) of liquid droplet extinction coefficient (a), number concentration (b), mass content (c) and effective diameter (d) median values for open water (full line), marginal ice zone (dashed lines) and sea ice (dotted lines) surfaces overflown during ACLOUD North (blue lines) and ACLOUD South (red lines) meteorological conditions.
4.3. Outlooks
The study presented in this poster is a preliminary study. We plan to carry on by first analyzing the aerosol concentration of particles larger than 100 nm to study their impact on cloud droplets. Particles larger than 500nm will be considered to investigate their impact as Ice Nuclei. This study will also be combined with an other study on small ice crystals performed by F. Waitz (see poster 72). Future campaigns are planned in this region (AFLUX 2019 and MOSAIC 2020) in order to increase the number of cloud samples with different air mass origins and surfaces overflown.
5. ACKNOWLEDGMENT AND REFERENCES
This work was primarily funded by EECLAT project (Expecting EarthCare, Learning from A-Train) supported by the french Centre National des Etudes Spatiales (CNES). We gratefully acknowledge the support from the Transregional Collaborative Research Center (TR 172) “ArctiC Amplification: Climate Relevant Atmospheric and SurfaCe Processes, and Feedback Mechanisms (AC)3 ”, which is funded by the German Research Foundation (Deutsche Forschungsgemeinschaft; DFG) and from the Chantier Arctique - Pollution in the Arctic System (PARCS) project, funded by CNRS. The authors thank the Alfred Wengener Institute (AWI) team for managaging and operating aircrafts in the arctic. Brown, P. R. A. and Francis, P. N., 1995 : Improved Measurements of the Ice Water Content in Cirrus Using a Total-Water Probe, J. Atmos. Ocean. Tech., 12, 410–414.
Crosier, J. and al., 2011 : Observations of ice multiplication in a weakly convective cell embedded in
supercooled mid-level stratus, Atmos. Chem. Phys., 11, 257-273,
Mioche, G., and al., 2017 : Characterization of Arctic mixed-phase cloud properties at small scale and coupling with satellite remote sensing, Atm. Chem. Phys., 17, 12845–12869,
Knudsen, E. M. and al., 2018 : Synoptic development during the ACLOUD/PASCAL field campaign near Svalbard in spring 2017, Atmos. Chem. Phys. Discuss., in review.
Lloyd, G. and al., 2015 : Observations and comparisons of cloud microphysical properties in spring and summertime Arctic stratocumulus clouds during the ACCACIA campaign, Atmos. Chem. Phys., 15, 3719-3737.
Young, G. and al., 2016 : Observed microphysical changes in Arctic mixed-phase clouds when transitioning from sea ice to open ocean, Atmos. Chem. Phys., 16, 13945-13967.