HAL Id: hal-02609973
https://hal.inrae.fr/hal-02609973
Submitted on 16 May 2020HAL is a multi-disciplinary open access archive for the deposit and dissemination of sci-entific research documents, whether they are pub-lished or not. The documents may come from teaching and research institutions in France or abroad, or from public or private research centers.
L’archive ouverte pluridisciplinaire HAL, est destinée au dépôt et à la diffusion de documents scientifiques de niveau recherche, publiés ou non, émanant des établissements d’enseignement et de recherche français ou étrangers, des laboratoires publics ou privés.
To cite this version:
Pierre Nicolle, Vazken Andréassian. Towards climate-proof hydrological models. [Research Report] irstea. 2019, pp.14. �hal-02609973�
ERA4CS
An ERA-NET
initiated by JPI Climate
Project: 690462 AQUACLEW
Full project title:
Advancing QUAlity of CLimate services
for European Water
Deliverable: D2.2
Towards climate-proof hydrological models
PROVISIONAL VERSIONDue date of deliverable: 30/06/2019
Date accepted for publication/submission: XX/XX/XXXX Actual submission date: 25/11/2019
Title Towards climate-proof hydrological models
Authors Pierre Nicolle & Vazken Andréassian
Contributors
Paul Royer-Gaspard, Charles Perrin, Guillaume Thirel,
Laurent Coron
Brief Description This deliverable contains the presentation of a new robustness assessment test for hydrological models in climate change context
Publisher AQUACLEW Consortium
Type (Deliverable/Milestone) Milestone D2.2
Format Report
Creation date 19/07/2019
Version number V1.0
Version date 19/07/2019
Last modified by Pierre Nicolle
Rights Copyright “AQUACLEW Consortium”.
During the drafting process, access is generally limited to the AQUACLEW Partners.
Audience internal
public
restricted, access granted to: ERA4CS
Action requested for approval of the WP Manager
for approval of the Internal Reviewer (if required) for approval of the Project Office
Deadline for approval
Version Date Modified by Comments
v1 19/07/2019 Pierre Nicolle Elaboration of a new robustness assessment test for hydrological
models in climate change context
v2 25/11/2019 Pierre Nicolle Link to the M2.4 milestone of workpackage 2
Table of Contents
Executive Summary ... 2
1. Introduction ... 2
1.1 Can we go beyond the Split Sample Test? ... 2
1.2 Scope of this report ... 3
2. The Robustness Assessment Test (RAT) concept ... 3
3. Material and methods ... 4
3.1 Catchment set ... 4
3.2 Model... 5
3.3 Evaluation procedure for the RAT framework ... 5
4. Verification of the hypotheses underlying the RAT procedure ... 6
4.1 Comparison between RAT and leave-one-out SST ... 6
4.2 Sensitivity of the RAT procedure to the period length ... 7
5. Application of the RAT procedure to the detection of climate dependencies ... 8
6. Conclusion ...12
6.1 Synthesis ...12
6.2 Limits of the proposed test ...12
Executive Summary
In this report, we propose the concept of a new robustness assessment test for hydrological models, tentatively called RAT (for Robustness Assessment Test). RAT differs from all existing alternatives by its ease of applicability, as it only requires one calibration (or one parameterization) covering a sufficiently long period (at least 30 years) with as much climatic variability as possible. Thus it applies at the same time to simple conceptual models which can be calibrated automatically, to more complex models requiring expert calibration and to uncalibrated models which parameters are derived from the observation of some physical properties.
The report details the RAT procedure. It will be followed by a more extensive application within the teams of the AQUACLEW project.
This work can be linked to the M2.4 milestone of the workpackage 2 on hydrological model calibration, and more precisely with the DSST-Hydro to evaluate simulation skills of hydrological models for a changing climate (Thirel et al., 2015) .
This report may be submitted as a scientific article after review within the AQUACLEW project
1. Introduction
1.1
Can we go beyond the Split Sample Test?
Hydrologists (and their models) are increasingly requested to provide predictions of the impact of climate changes. When hydrologists use a model in this goal, an underlying hypothesis is that the model is indeed able to extrapolate catchment behavior, and that its functioning is independent of the climate it has seen during its testing period or during its calibration period. Unfortunately, the majority of hydrological models are not climate-proof (Refsgaard et al., 2013; Thirel et al., 2015) and when exposed to changing climate conditions, they may reveal an unwanted sensitivity to their calibration period (Coron et al., 2011).
The traditional diagnostic tool used to assess the robustness of models is the Split Sample Test (SST) (Klemeš, 1986). SST is one of the “good modelling practices” taught in hydrology classes, that states that when a model requires calibration (i.e. when its parameters cannot be deduced directly from physical measurements), it should be evaluated twice: once on the data used for calibration and once on an independent dataset. This practice has been publicized in hydrology by Klemeš (1986): he did not invent the concept (see e.g. Arlot and Celisse (2010); Larson (1931); Mosteller and Tukey (1968)), but did a great job in formalizing it for hydrological modelling, proposing a four-level testing scheme: (i) split-sample test, (ii) proxy-basin test, (iii) differential split sample test (DSST), and (iv) proxy-basin differential split sample test.
For model applications in a changing climate context, Klemeš’s DSST procedure is of particular interest: it consists in calibrating and evaluating a model over contrasted climatic conditions, and a satisfying behavior during DSST can be considered a mark of model robustness. Unfortunately, one must recognize that DSST has had a very limited success: beyond a few studies (Donelly-Makowecki and Moore, 1999; Refsgaard and Knudsen, 1996; Seibert, 2003; Vaze et al., 2010; Xu, 1999), it has remained unemployed. A few years ago, Coron et al. (2012) proposed a Generalized SST (GSST) allowing an exhaustive DSST to evaluate model transposability over time under various climate conditions. Thirel et al. (2015a) also proposed a further protocol to investigate how hydrological models deal with changing conditions. More recently one notices a slowly but steadily-growing interest (Bisselink et al., 2016; Broderick et al., 2016; Dakhlaoui et al., 2017; Gaborit et al., 2015;
Gelfan and Millionshchikova, 2018; Rau et al., 2019; Vormoor et al., 2018). This report is a further step in the same direction.
1.2
Scope of this report
This report presents a new generic diagnostic framework to assess whether a hydrological model can be considered “climate-proof”, inspired by Klemeš’s DSST procedure and by our own previous attempts (Coron et al., 2012; Thirel et al., 2014). We started from the observation that the multiple-calibrations requirement of the previously mentioned methods may have prevented their use in certain cases: multiple calibrations are relatively easy to implement with parsimonious conceptual models but not with complex models which require long interventions by expert modelers and, obviously, not for those models with a once-for-all set parameterization. Here, we propose a framework that is applicable with only one long period where model simulations are available. Thus, the proposed test is even applicable to those models which do not require calibration (or to those for which only a single calibration exists). Section 2 presents the concept; section 3 presents the catchment set and the evaluation method, section 4 verifies the underlying hypotheses through a comparison with the SST; and section 5 applies it to a set of French catchments.
The proposed methodology complements the DSST-Hydro from the Aquaclew workpackage 2, as it allows reducing the number of calibration and validation tests that can be time-consuming. It also covers one of the objectives of workpackage 2, as it proposes a new framework to calibrate and evaluate hydrological models robustness for a changing climate.
2. The Robustness Assessment Test (RAT) concept
The Robustness Assessment Test (RAT) proposed in this report only requires one calibration (or one parameterization) covering a sufficiently long period (at least 30 years) with as much climatic variability as possible. Thus it applies at the same time to simple conceptual models which can be calibrated automatically, to more complex models requiring expert calibration and to uncalibrated models which parameters are derived from the observation of some physical properties. RAT consists in replacing the split-sample calibration procedure by a split-sample evaluation procedure: by computing a relevant numeric criterion repeatedly each year, and then exploring its correlation with a climatic factor deemed meaningful, we aim to identify undesirable dependencies and to assess the extrapolation capacity of any hydrological simulation model.
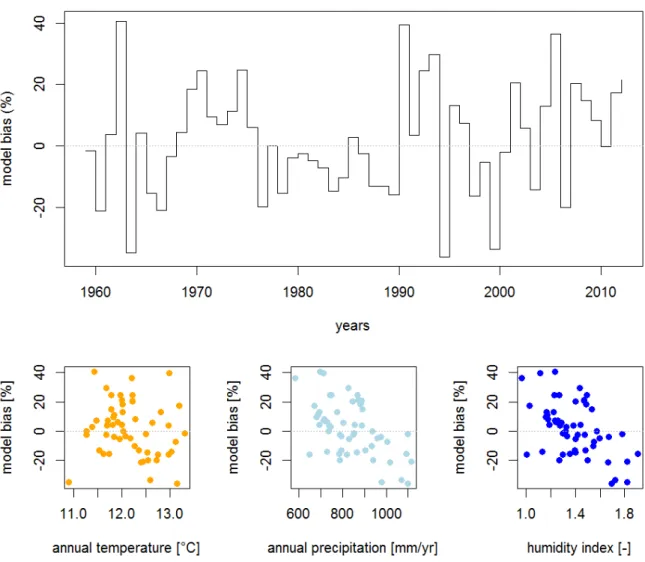
An example is shown in Figure 1: a hydrological model is calibrated on a 50-year record. The model’s streamflow bias is computed on an annual basis (50 values in total) and we plot these values against annual precipitation, annual temperature, and humidity index (i.e ratio of precipitation and evapotranspiration). On this example, there seems to be no dependency of model bias to temperature, but a dependency of model bias to precipitation, as shows the decreasing trend between the bias and the annual precipitation. Clearly, this would be a problem if we were to use this model in an extrapolation mode.
The difference with the work of Coron et al. (2012) and Thirel et al. (2015b) lies in that the RAT procedure is based on a single calibration encompassing the entire available record. The above-cited methods used as many independent calibration and evaluation periods as possible, whereas RAT uses all possible one-year evaluation periods and a single calibration period. An important difference between RAT and GSST is that of the independence of calibration and evaluation periods: with RAT, because we use a very long period for calibration, we make the hypothesis that the weight of each individual year in the overall calibration process is small, almost negligible (we will check this assumption in section 4).
Figure 1. Robustness Assessment Test (RAT) applied to a hydrological model: the upper histogram presents the chronological (year by year) evolution of model bias; the lower scatterplots present the relationship between model bias and climatic variables
3. Material and methods
3.1
Catchment set
We use the dataset previously used by Nicolle et al. (2014), made of 21 French catchments (Figure 2). Catchments were chosen to represent a large range of physical and climatic condition in France, with sufficiently long observation time series (daily streamflow from 1974-2017) in order to provide a diverse representation of past hydroclimatic conditions. Streamflow data quality is considered as good by operational hydrometric services. Catchment sizes range from around 380 to 4300 km², and median elevation from 70 to 1020 m.
Daily precipitation, temperature and evapotranspiration data originates from the gridded SAFRAN climate reanalysis (Vidal et al., 2010), over the 1959-2017 period. For more information about the catchment set, we refer our readers to the above-mentioned paper.
Figure 2. Location of the 21 catchments in France. Red dots represents the catchment outlets.
3.2
Model
In this study, daily streamflow have been simulated using the daily lumped GR4J rainfall-runoff model (Perrin et al., 2003), calibrated using the KGE criterion (Gupta et al., 2009) computed on square-root-transformed flows, with the airGR package (Coron et al., 2017a, 2017b). However, we want to stress once again that the RAT diagnostic framework is generic, not limited to this type of model.
3.3
Evaluation procedure for the RAT framework
We verify the hypotheses underlying the RAT framework with actual examples, where we will show that the very partial overlap between the calibration and validation periods does not impact results on the annual bias (Eq. 1)
𝐵𝐵𝐵𝐵𝐵𝐵𝐵𝐵𝑛𝑛 =∑ 𝑄𝑄𝐵𝐵𝐵𝐵𝑄𝑄𝑑𝑑,𝑛𝑛 365
𝑑𝑑=1 − ∑365𝑗𝑗=1𝑄𝑄𝑄𝑄𝑄𝑄𝐵𝐵𝑑𝑑,𝑛𝑛
∑365𝑑𝑑=1𝑄𝑄𝑄𝑄𝑄𝑄𝐵𝐵𝑑𝑑,𝑛𝑛 × 100
Eq. 1
Comparison between RAT and SST can be quantified using the RMSE of annual biases:
𝑅𝑅𝑅𝑅𝑅𝑅𝑅𝑅𝐵𝐵𝐵𝐵𝐵𝐵𝐵𝐵=
(
BiasRAT −BiasSST)
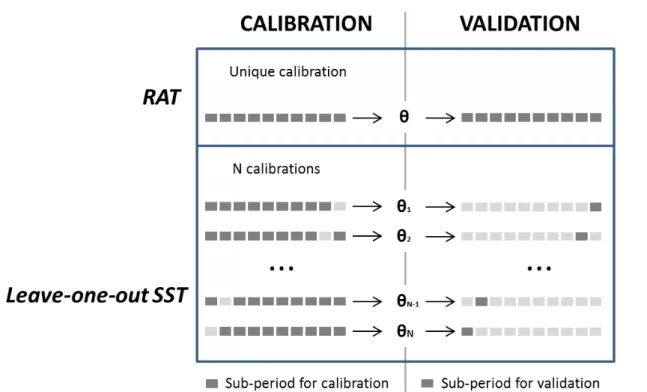
2 Eq. 2It is in fact possible to rigorously verify the hypotheses underlying RAT by comparing it with an equivalent Split Sample Test procedure using a leave-one-out approach, as proposed in Figure 3: the leave-one-out procedure consists in performing N calibrations over N-1 year long periods followed by an independent evaluation on the remaining one-year long period. As shown in Figure 3, the two procedures result in the same number of validation points (N). Once the N bias values have been computed, they can be plotted as a function of annual temperature or annual precipitation. We refer to this procedure as “Leave-one-out SST”.
Figure 3. Comparison of the RAT procedure with a leave-one-out Split Sample Test (SST). Both methods have N validations (one per year). RAT needs only one calibration, where the SST requires N calibrations. Dark grey square represents the years used for calibration or validation.
4. Verification of the hypotheses underlying the RAT
procedure
To verify the RAT procedure and its hypotheses, we will compare it with the leave-one-out SST procedure, which preserves the independence between the calibration and the validation period. This comparison will allow us to verify that the main hypothesis underlying RAT, i.e. that the weight of each individual year in the overall calibration process is almost negligible, is reasonable. We will also explore the limits of this hypothesis when we reduce the length of the overall calibration period.
4.1
Comparison between RAT and leave-one-out SST
Figure 4 plots the annual biases obtained with RAT vs the annual bias obtained with the leave-one-out SST for the 21 test catchments. The almost perfect alignment confirms that our underlying ‘negligeability’ hypothesis is valid.
Figure 4. Comparison of the annual bias obtained with RAT with the annual bias obtained with the leave-one-out SST. Each of the 21 catchments is represented with annual bias values (41 to 44 points by catchment depending on the length of the available time series).
4.2
Sensitivity of the RAT procedure to the period length
It is also interesting to investigate the limit of our hypothesis by reducing progressively the period length: indeed, the less available data to calibrate the model, the more important the relative weight of each individual year. Figure 5 compares the annual bias obtained with the RAT procedure with the annual bias obtained with the leave-one-out SST, for 10, 20, 30 and 40-year calibration period lengths (selection of the shorter periods was realized by sampling 10, 20, 30 and 40 year regularly amongst the complete time series). The shorter the calibration period, the larger the differences between both approaches (wider points scatter).
Figure 5. Annual bias obtained with the RAT procedure vs. annual bias obtained with leave-one-out SST. Shorter time periods are obtained by sampling 10, 20, 30 and 40 year regularly amongst the complete time series.
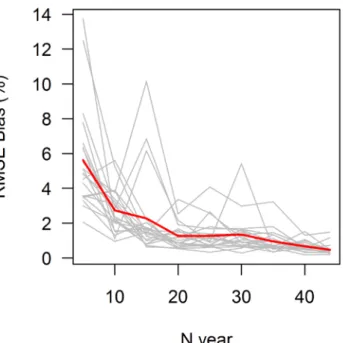
These differences can be quantitatively measured by computing the RMSE (see Eq. 2) between annual bias obtained with the RAT procedure and with SST for different calibration period lengths (see Figure 6). RMSE tends to increase when the number of years available to calibrate the model decreases, but seems stable for periods longer than 20 years.
Figure 6. RMSE of annual bias obtained with the RAT procedure and with leave-one-out SST for different calibration period lengths for each catchment. The red line represents the mean RMSE for all catchments, grey lines represent the RMSE for each of the 21 catchments.
5. Application of the RAT procedure to the detection of
climate dependencies
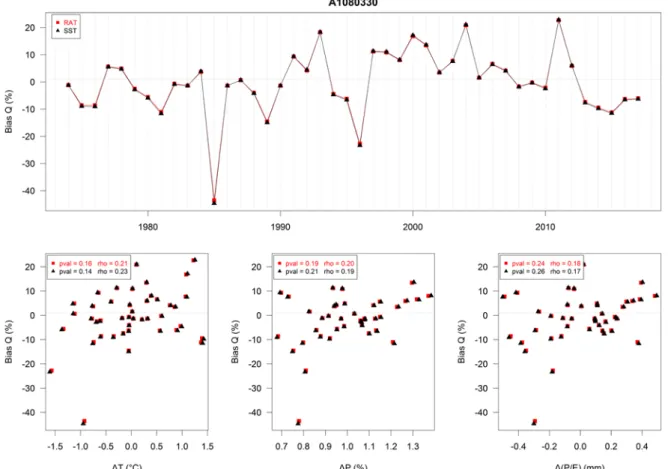
We now discuss different cases found among the 21 catchments where we applied the RAT procedure. The first one (Figure 7) is the most common case: one where no climate dependency is detected (the “desirable” situation of a “robust” model). Note the extreme similarity of biases obtained for RAT (red square) and leave-one-out SST (black triangle) which are almost undistinguishable.
In Figure 7, the different plots seem to show a lack of dependence, both for temperature (bottom left), precipitation (bottom centre) and humidity index (mean precipitation P over mean potential evapotranspiration E) (bottom right). This visual judgement can be made quantitative by calculating a rank-based correlation measure, the Spearman correlation (other rank-based measures such as Kendall tau could also be used). Correlation is quite weak (between 0.17 et 0.23) and not significant in this case, but similar between RAT and SST.
Figure 7. Annual bias obtained with RAT (red) and with SST (black), function of time (top), absolute changes in temperature (bottom left) and humidity index P/E (bottom right), and relative changes in precipitation P (bottom centre), between validation period and calibration period, for the Ill River at Didenheim (670 km²). Spearman correlation and its significativity (p-value) are provided.
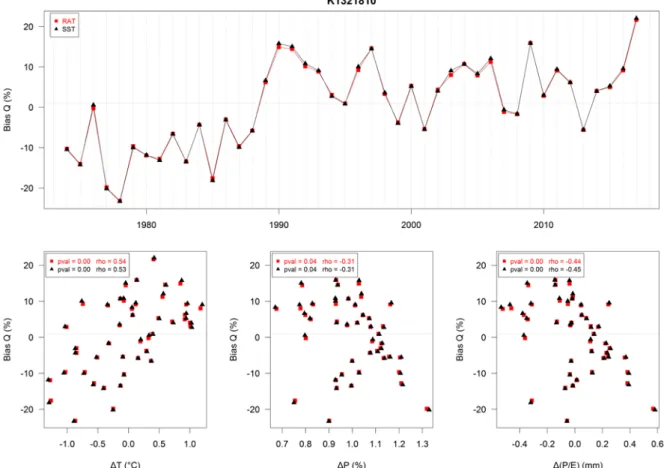
The second case (Figure 8) is that of the Arroux River at Etang-sur-Arroux: one where a significant climate dependency is detected on both annual temperature and precipitation, and humidity index (a clearly undesirable situation illustrating a lack of robustness of the hydrological model). The Spearman correlation between model bias and changes in precipitation, temperature and humidity index is below the classical significativity threshold of 5% (p-value 0.04): annual bias seems to increase with annual temperature and decrease with annual precipitation.
Figure 8. Annual biais obtained with RAT (red) and with SST (black), function of time (top), absolute changes in temperature (bottom left) and humidity index P/E (bottom right), and relative changes in precipitation P (bottom centre), between validation period and calibration period, for the Arroux River at Etang-sur-Arroux (1790 km²).
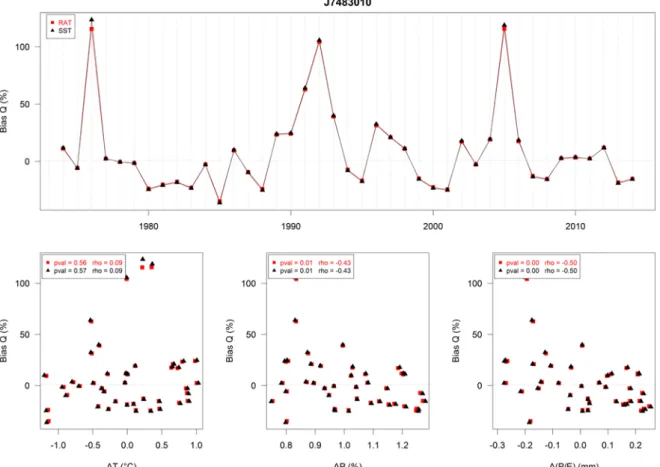
The third case (Figure 9) is that of the Seiche River at Bruze: one where a significant climate dependency is detected on precipitation and humidity index but not on temperature.
Figure 9. Annual biais obtained with RAT (red) and with SST (black), function of time (top), absolute changes in temperature (bottom left) and humidity index P/E (bottom right), and relative changes in precipitation P (bottom centre), between validation period and calibration period, for the Seiche River at Bruz (810 km²).
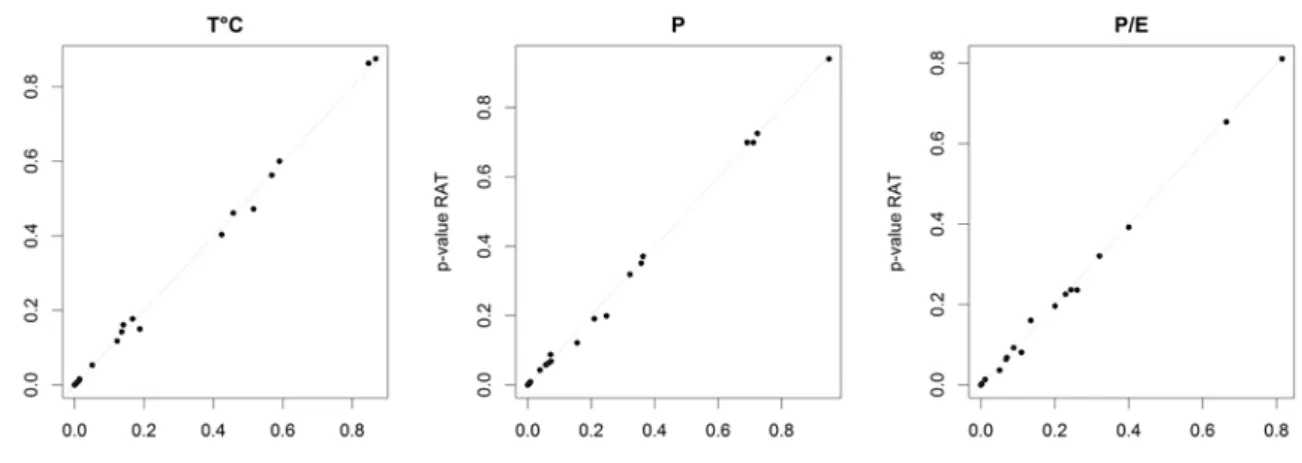
Figure 10 presents the Spearman correlation p-values from the correlation between annual bias and changes in annual temperature, precipitation and humidity index (P/E), for RAT and for SST. Results between RAT and SST show the same dependencies to climate variables (similar p-values). With the 0.05 significativity thresholds, nine among 21 catchments presents dependencies to annual temperature, and 8 catchments present dependencies to annual precipitation or humidity index. For these two variables, when a dependency is identified on annual precipitation, a similar dependency is identified on humidity index. There is a clear redundancy between precipitation and humidity index, because the interannual variability of precipitation is much larger than that of potential evapotranspiration. In this set, only one catchment exhibits a dependency on both annual temperature and annual precipitation.
Figure 10. Spearman correlation p-value from the correlation between annual bias and annual temperature, precipitation and humidity index (P/E), for RAT and SST
6. Conclusion
6.1
Synthesis
The proposed Robustness Assessment Test (RAT) is an easy-to-implement evaluation framework that allows comparing results from all kind of hydrological models, by using only one long period where model simulations are available. This test can be particularly useful for climate change studies where hydrological models robustness is often not evaluated at all.
6.2
Limits of the proposed test
The RAT procedure obviously has some limits, among which we see the following:
1. We illustrated its use with a rank-based test (Spearman correlation), and a significativity threshold of 0.05. As all thresholds, this one is arbitrary. Moreover, other non-parametric tests could be used and would probably yield slightly different results (we also tested the Kendall tau test with very similar results, but did not show the results here);
2. Detecting a relationship between model bias and a climate variable using RAT does not allow to directly attribute this relationship to a lack of model robustness. Indeed, changes in the precipitation monitoring network or in the hydrometric rating curves can also give the false impression that the hydrological model lacks robustness. Such an erroneous conclusion could also be caused by changes in land-use or construction of a storage reservoir. We suspect that some of the lack of robustness diagnosed among our 21 catchments comes in fact from metrological causes.
It could be interesting to see if this analysis could reach the same conclusion for statistical indicators like QMNA or maximum annual discharge
7. References
Arlot, S. and Celisse, A.: A survey of cross-validation procedures for model selection, Stat. Surv., 4(0), 40–79, doi:10.1214/09-SS054, 2010.
Bisselink, B., Zambrano-Bigiarini, M., Burek, P. and de Roo, A.: Assessing the role of uncertain precipitation estimates on the robustness of hydrological model parameters under highly variable climate conditions, J. Hydrol. Reg. Stud., 8, 112–129,
Broderick, C., Matthews, T., Wilby, R. L., Bastola, S. and Murphy, C.: Transferability of hydrological models and ensemble averaging methods between contrasting climatic periods, Water Resour. Res., 52(10), 8343–8373, doi:10.1002/2016WR018850, 2016.
Coron, L., Andréassian, V., Bourqui, M., Perrin, C. and Hendrickx, F.: Pathologies of hydrological models used in changing climatic conditions: a review, in Hydro-climatology: Variability and Change. IAHS Red Books Series 344, edited by S. Franks, E. Boegh, E. Blyth, D. Hannah, and K. K. Yilmaz, pp. 39–44, IAHS, Wallingford., 2011.
Coron, L., Andréassian, V., Perrin, C., Lerat, J., Vaze, J., Bourqui, M. and Hendrickx, F.: Crash testing hydrological models in contrasted climate conditions: An experiment on 216 Australian catchments, Water Resour. Res., 48, W05552, doi:10.1029/2011WR011721, 2012.
Coron, L., Perrin, C. and Michel, C.: airGR: Suite of GR Hydrological Models for
Precipitation-Runoff Modelling. [online] Available from: https://webgr.irstea.fr/en/airGR/, 2017a.
Coron, L., Thirel, G., Delaigue, O., Perrin, C. and Andréassian, V.: The Suite of Lumped GR Hydrological Models in an R package, Environ. Model. Softw., 94, 337,
doi:10.1016/j.envsoft.2017.05.002, 2017b.
Dakhlaoui, H., Ruelland, D., Tramblay, Y. and Bargaoui, Z.: Evaluating the robustness of conceptual rainfall-runoff models under climate variability in northern Tunisia, J. Hydrol., 550, 201–217, doi:10.1016/j.jhydrol.2017.04.032, 2017.
Donelly-Makowecki, L. M. and Moore, R. D.: Hierarchical testing of three rainfall-runoff models in small forested catchments, J. Hydrol., 219(3-4), 136–152, 1999.
Gaborit, É., Ricard, S., Lachance-Cloutier, S., Anctil, F. and Turcotte, R.: Comparing global and local calibration schemes from a differential split-sample test perspective, Can. J. Earth Sci., 52(11), 990–999, doi:10.1139/cjes-2015-0015, 2015.
Gelfan, A. N. and Millionshchikova, T. D.: Validation of a Hydrological Model Intended for Impact Study: Problem Statement and Solution Example for Selenga River Basin, Water Resour., 45(1), 90–101, doi:10.1134/S0097807818050354, 2018.
Gupta, H. V., Kling, H., Yilmaz, K. K. and Martinez, G. F.: Decomposition of the mean squared error and NSE performance criteria: Implications for improving hydrological modelling, J. Hydrol., 377(1–2), 80–91, doi:10.1016/j.jhydrol.2009.08.003, 2009.
Klemeš, V.: Operational testing of hydrologic simulation models, Hydrol. Sci. J., 31(1), 13– 24, 1986.
Larson, S. C.: The shrinkage of the coefficient of multiple correlation, J. Educ. Psychol., 22(1), 45–55, doi:10.1037/h0072400, 1931.
Mosteller, F. and Tukey, J. W.: Data analysis, including statistics, Handbook of social psychology, 2, 80–203, 1968.
Nicolle, P., Pushpalatha, R., Perrin, C., François, D., Thiéry, D., Mathevet, T., Le Lay, M., Besson, F., Soubeyroux, J.-M., Viel, C., Regimbeau, F., Andréassian, V., Maugis, P., Augeard, B. and Morice, E.: Benchmarking hydrological models for low-flow simulation and forecasting on French catchments, Hydrol Earth Syst Sci, 18(8), 2829–2857,
Perrin, C., Michel, C. and Andréassian, V.: Improvement of a parsimonious model for
streamflow simulation, J. Hydrol., 279(1–4), 275–289, doi:10.1016/S0022-1694(03)00225-7, 2003.
Rau, P., Bourrel, L., Labat, D., Ruelland, D., Frappart, F., Lavado, W., Dewitte, B. and Felipe, O.: Assessing multidecadal runoff (1970–2010) using regional hydrological modelling under data and water scarcity conditions in Peruvian Pacific catchments, Hydrol. Process., 33(1), 20–35, doi:10.1002/hyp.13318, 2019.
Refsgaard, J. C. and Knudsen, J.: Operational validation and intercomparison of different types of hydrological models, Water Resour. Res., 32(7), 2189–2202, 1996.
Refsgaard, J. C., Madsen, H., Andréassian, V., Arnbjerg-Nielsen, K., Davidson, T. A., Drews, M., Hamilton, D. P., Jeppesen, E., Kjellström, E., Olesen, J. E., Sonnenborg, T. O., Trolle, D., Willems, P. and Christensen, J. H.: A framework for testing the ability of models to project climate change and its impacts, Clim. Change, 122(1-2), 271–282, 2013.
Seibert, J.: Reliability of model predictions outside calibration conditions, Nord. Hydrol., 34(5), 477–492, 2003.
Thirel, G., Andréassian, V., Perrin, C., Audouy, J.-N., Berthet, L., Edwards, P., Folton, N., Furusho, C., Kuentz, A., Lerat, J., Lindström, G., Martin, E., Mathevet, T., Merz, R., Parajka, J., Ruelland, D. and Vaze, J.: Hydrology under change: an evaluation protocol to investigate how hydrological models deal with changing catchments, Hydrol. Sci. J., 0(ja), null,
doi:10.1080/02626667.2014.967248, 2014.
Thirel, G., Andréassian, V. and Perrin, C.: On the need to test hydrological models under changing conditions, Hydrol. Sci. J., 60(7-8), 1165–1173,
doi:10.1080/02626667.2015.1050027, 2015.
Vaze, J., Post, D. A., Chiew, F. H. S., Perraud, J. M., Viney, N. R. and Teng, J.: Climate non-stationarity - Validity of calibrated rainfall-runoff models for use in climate change studies, J. Hydrol., 394(3-4), 447–457, 2010.
Vidal, J.-P., Martin, E., Franchistéguy, L., Baillon, M. and Soubeyroux, J.-M.: A 50-year high-resolution atmospheric reanalysis over France with the Safran system, Int. J. Climatol., 30(11), P. 1627–1644. DOI: 10.1002/joc.2003, doi:10.1002/joc.2003, 2010.
Vormoor, K., Heistermann, M., Bronstert, A. and Lawrence, D.: Hydrological model
parameter (in)stability – “crash testing” the HBV model under contrasting flood seasonality conditions, Hydrol. Sci. J., 63(7), 991–1007, doi:10.1080/02626667.2018.1466056, 2018.
Xu, C.: Climate Change and Hydrologic Models: A Review of Existing Gaps and Recent Research Developments, Water Resour. Manag., 13(5), 369–382,