HAL Id: hal-00297109
https://hal.archives-ouvertes.fr/hal-00297109
Submitted on 10 Apr 2008
HAL is a multi-disciplinary open access
archive for the deposit and dissemination of
sci-entific research documents, whether they are
pub-lished or not. The documents may come from
teaching and research institutions in France or
abroad, or from public or private research centers.
L’archive ouverte pluridisciplinaire HAL, est
destinée au dépôt et à la diffusion de documents
scientifiques de niveau recherche, publiés ou non,
émanant des établissements d’enseignement et de
recherche français ou étrangers, des laboratoires
publics ou privés.
Frost risks in the Mantaro river basin
G. Trasmonte, R. Chavez, B. Segura, J. L. Rosales
To cite this version:
G. Trasmonte, R. Chavez, B. Segura, J. L. Rosales. Frost risks in the Mantaro river basin. Advances
in Geosciences, European Geosciences Union, 2008, 14, pp.265-270. �hal-00297109�
Adv. Geosci., 14, 265–270, 2008 www.adv-geosci.net/14/265/2008/ © Author(s) 2008. This work is licensed under a Creative Commons License.
Advances in
Geosciences
Frost risks in the Mantaro river basin
G. Trasmonte1, R. Chavez1, B. Segura1, and J. L. Rosales2
1Instituto Geof´ısico del Per´u, Calle Badajoz 169, Mayorazgo IV Etapa, Ate, Lima 03, Peru 2Universidad Nacional Federico Villarreal, Facultad de Ingenier´ıa Geogr´afica y Ambiental, Peru
Received: 15 June 2007 – Revised: 21 August 2007 – Accepted: 22 August 2007 – Published: 10 April 2008
Abstract. As part of the study on the Mantaro river basin’s (central Andes of Per´u) current vulnerability to climate change, the temporal and spatial characteristics of frosts were analysed. These characteristics included intensity, frequency, duration, frost-free periods, area distribution and historical trends. Maps of frost risk were determined for the entire river basin, by means of mathematical algorithms and GIS (Geo-graphic Information Systems) tools, using minimum temper-ature – 1960 to 2002 period, geomorphology, slope, land-use, types of soils, vegetation and life zones, emphasizing the rainy season (September to April), when the impacts of frost on agriculture are most severe. We recognized four categories of frost risks: low, moderate, high and critical. The critical risks (with a very high probability of occur-rence) were related to high altitudes on the basin (altitudes higher than 3800 m a.s.l.), while the low (or null) probability of occurring risks were found in the lower zones (less than 2500 m a.s.l.). Because of the very intense agricultural activ-ity and the high sensitivactiv-ity of the main crops (Maize, potato, artichoke) in the Mantaro valley (altitudes between 3100 and 3300 m a.s.l.), moderate to high frost risks can be expected, with a low to moderate probability of occurrence. Another significant result was a positive trend of 8 days per decade in the number of frost days during the rainy season.
1 Introduction
The Mantaro river basin is located in the eastern slope of the Peruvian central Andes. It is a very rich area in agri-culture and because of its geographical characteristics and complex topography, it is constantly affected by frosts. Ex-cluding droughts, frosts are considered the most pressing at-mospheric phenomenon to the local population because of
Correspondence to: G. Trasmonte
their effects on agriculture, the region’s main economic ac-tivity (IGP, 2005a). The Mantaro river basin and two other basins were selected to develop an integrated local assess-ment with a climate change perspective, as part of the first effort made in our country to map this phenomenon. In this paper, we present the main results of the analysis of frost events in the Mantaro river basin, including maps showing frost occurrences and frost risks for different intensities.
2 Mantaro river basin, meteorological network and data used
The Mantaro river basin is located in the central Andes of Per´u, between the latitudes: 10◦34′S–13◦35′S and
longi-tudes: 73◦55′W–76◦40′W. It covers an area of
approxi-mately 34 550 km2 in size. It is a complex Andean region with altitudes ranging from 500 m a.s.l. to 5350 m a.s.l., and a mean altitude of 3800 m a.s.l.
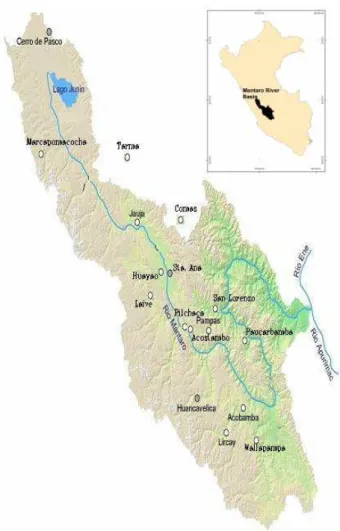
Daily minimum air temperatures1 (Tmin) for the 1960–
2002 period were recovered from fifteen meteorological sta-tions in the basin, as well as two additional stasta-tions located in adjacent areas (Fig. 1), for at minimum a ten year period. Six time series of at least 30 years long (Marcapomacocha, Cerro de Pasco, Jauja, Huayao, Pilchaca and Lircay) were considered for trend analysis.
Geographic information system (GIS) data for the Man-taro river basin was digitalized and/or compiled, then pro-cessed for the project. The basic GIS information included were orography, hydrography and main cities and towns among others; the considered thematic maps were geomor-phology, slope, land-use, types of soils, vegetation and life zones, at scales of 1:100 000 and 1:250 000 for basic and the-matic maps respectively. Resolution of the terrain model was 100 m by pixel, interpolated using the spline method.
266 G. Trasmonte et al.: Frost risks in the Mantaro river basin
Fig. 1. The Mantaro river basin. Meteorological network used.
3 Methodology
First, the quality of the data was controlled, excluding all the obvious suspicious data. Other problems with the data, such as changes in instrumentation or location of the station could not be addressed with the information available. Therefore, the strength of our trend analysis lies in the robustness of the results among the different stations.
In workshops involving specialists in agriculture, “frost” was defined to occur in days in which Tmin was lower or
equal than a threshold value of 5◦C. The determination of
this threshold was based on the sensitivity to temperature of the main crops (maize, potato, artichoke) in the basin, partic-ularly in the valley, and does not necessarily imply freezing of the plants; other thresholds values (−4◦C, −2◦C, 0◦C and
2.5◦C) have been considered in additional analyses. Since
our interest was to analyse the frost risk in the period of ma-jor agriculture activities in the region, we focused our analy-sis on the rainy season (from September to April). Thus, the number of frost days in the rainy season (hereafter “frost fre-quency”) was determined for each year and the lowest value
Fig. 2. Historical trends in frost frequency. Mantaro river basin.
of Tminfor each rainy season was taken as indicator of the
“frost intensity” of that year.
We determined the existence of linear trends in the annual frost frequency and intensity, using regression analysis with the least squares method. Finally, maps of empirical frost probability occurrences were produced for different thresh-olds (5◦C, 2,5◦C, 0◦C, −2◦C and −4◦C) for the entire
wa-tershed, based on a combination of linear until seventh-order polynomial curves fit versus altitude, then maps of frost risk were constructed, adding and analysing layers of slope, soil types, land-use distribution, morphology, vegetation and life zones in the form of model coefficients using a GIS platform (ArcView, Spatial Analysis and Model Builder extentions).
4 Spatial-temporal variability of frosts in the Mantaro river basin
A strong seasonal variability exists in Tmin in the Mantaro
River Basin, with a permanent presence of frost during aus-tral winter, approximately between the 30th pentad (early June) and the 45th pentad (middle August). A high depen-dence between altitude and Tminfor the September to April
period were found (IGP, 2005b), with high non-linear corre-lation coefficients (between 0.91 and 0.94 ). At altitudes near or higher than 4000 m a.s.l. (e.g. Cerro de Pasco, Marcapo-macocha, Laive), frosts were found 365 days/year; in the val-ley (e.g. Jauja, Huayao, Santa Ana), where altitudes are rang-ing from 3100 to 3300 m a.s.l., frosts appear between middle to late April and middle September, with extreme (coldest) values in July. In lower zones (e.g. Paucarbamba and San Lorenzo, 3000 and 2600 m a.s.l. respectively), the period and
G. Trasmonte et al.: Frost risks in the Mantaro river basin 267
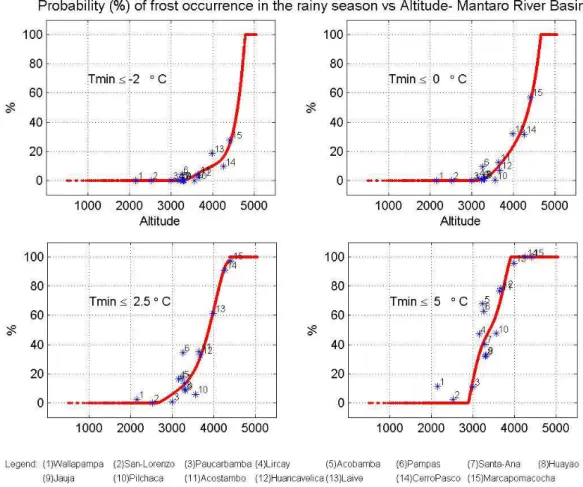
Fig. 3. Probability of frost occurrence in the rainy season (September to April) vs. altitude, threshold values of: −2.0◦C (upper left), 0◦C
(upper right), 2.5◦C (down left) and 5.0◦C (down right). Mantaro river basin.
number of days with frost is reduced to the coldest months of the year (June to August) with frost-free periods of 300 to 360 days/year.
There is a large inter annual variability in Tmin, with
peri-ods of low Tmin(less than normal) in the middle eighties and
early nineties. On the other hand, during the strong El Ni˜no event 1997–1998, conditions were far warmer than normal registered in almost all the basin, especially between Decem-ber 1997 and April 1998, with an extreme anomaly of +4.7◦C
registered in the valley (Huayao) on February 1998, in gen-eral, the period and frequency of frosts by year was reduced considerably.
5 Mean and trends in frequency and intensity of frosts
The highest frequency of frosts occurs between June and Au-gust during the dry season of the region, maximizing in June or July; they are mainly associated with radiative cooling at night or dawn hours, originated by cloudless, very dry, cold and highly stable atmosphere (Villegas, 1991; IGP, 2005a). Conversely, the lowest frequency of frosts occurs between
January and March (the peak of the rainy season), and it is associated with moist and cloudy skies; in these cases frosts are normally originated by the anomalous intrusion of cold and dry air masses advected from the southern part of the continent (Garreaud and Wallace, 1998). Frosts that cause the largest impact on agriculture in the region are those that happen between the sowing and harvesting time, occurring from September to April.
At higher elevations (Marcapomacocha and Cerro de Pasco), we found a positive tendency (+3 and +6 days/decade) in the frost frequency for the rainy period. In the locality of Jauja (north of the Mantaro Valley), it was ev-idenced as a trend towards a high increase of the number of frost days to the same period (Fig. 2, upper side), with a rate of +14,8 days/decade, the highest value found in the basin. Huayao, south of the valley, displayed a tendency of increase of +2,8 days per decade (Fig. 2, down side). From all the data analyzed, Pilchaca exhibited a clear opposite tendency with a rate of −12,7 days/decade. To the south, Lircay had a high variability in the number of frost days between September to April, with an average trend of +12,4 days/decade. Statis-tical analysis shown that trends were significant at Huayao
268 G. Trasmonte et al.: Frost risks in the Mantaro river basin
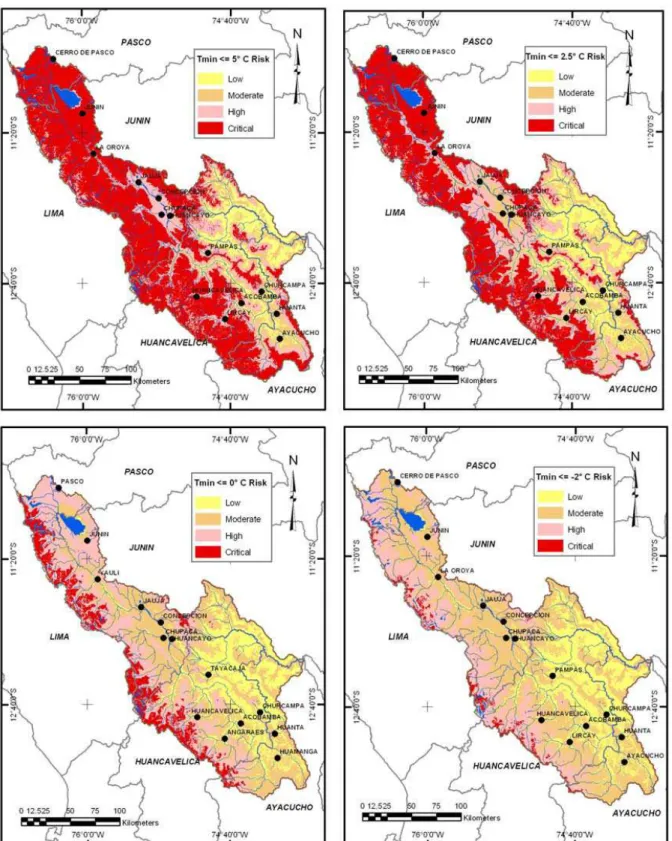
Fig. 4. Frost risk maps for the Mantaro river basin in the rainy season (September to April), threshold values of: 5◦C (upper left, 4a), 2.5◦C
(upper right, 4b), 0◦C (down left, 4c) and −2.0◦C (down right, 4d). Red indicates critical risk areas, pink indicates high risk areas, orange
shows moderate risk areas and yellow indicates low to null risk areas.
G. Trasmonte et al.: Frost risks in the Mantaro river basin 269
and Jauja with a 95% of confidence. Summarizing, a general positive historical linear trend was found in the number of days with frosts in the rainy season, with an average rate of 8 days/decade.
Frost intensity is also variable according to altitude. Dur-ing September to April, Tminhas dropped to −9.8◦C in
high-est zones like Marcapomacocha (4413 m a.s.l.); in the Man-taro Valley (Jauja, Huayao, Santa Ana), extreme frosts could reach until −3.8◦C; in altitudes near 3000 m a.s.l.
(Paucar-bamba) frosts have not been less than 0.1◦C; and in lower
zones (e.g. San Lorenzo), Tminwere not less than 6◦C.
Changes in frost intensities in the September–April period are not robust in the Mantaro river basin. For Marcapoma-cocha and Cerro de Pasco, they have been less intense with time, with a rate of 0.3◦C to 0.5◦C per decade. On the other
hand, frosts appear to be intensifying in Jauja and Lircay at a rate of −1.0 and −0.4◦C/decade, respectively. Huayao and
Pilchaca exhibit a weak or almost null trend (+0.05◦C/decade
and +0.08◦C/decade respectively).
6 Probability of frost occurrences and frost risks
The relationship between probability of frost occurrences (defined as frost frequency divided by the total number of days) and altitude was empirically obtained by fitting each of the various threshold temperatures for frost conditions (5◦C,
2.5◦C, 0◦C, −2◦C and −4◦C) to polynomial functions that
varied between fifth and seventh order. See Fig. 3.
With these functions, we were able to produce maps of the probability of frost occurrences for the entire basin for each threshold temperature (not shown). Five categories were de-fined: very low probability (0% to 20%), low probability (20% to 40%), moderate probability (40% to 60%), high probability (60% to 80%) and very high probability (80% to 100%). For the rainy season, the probability of frost occur-rences (Tmin≤5◦C) was very high for altitudes higher than
3800 masl (4500 m a.s.l. in case of Tmin≤0◦C), which are
typically found in the northern and western side of the basin; for the Mantaro valley the probability was between low and moderate (20%–60%); and in the lower zones (less than 2500 m a.s.l.) located in the central-eastern and south-eastern area, an interval of 0% to 20% is expected. In general, as the threshold temperature is decreased, the probability of occur-rence of frosts decreases and is restricted to higher zones of the river basin in such a way that severe frosts (Tmin≤−2◦C)
were limited to altitudes higher than 4500 m a.s.l., while the threshold of −4◦C yielded a practically null probability of
occurrence throughout the river basin.
Lastly, four types of frost risks (low, moderate, high and critical) were recognized. For the 5◦C threshold (Fig. 4a),
critical risks are related to high altitudes on the basin (4000 m a.s.l.), while low (or null) frost risks are in lower zones (less than 2500 m a.s.l.). In the Mantaro valley, moder-ate to high frost risks are expected, considering the large
agri-cultural activity in the region and the high sensitivity of the crops to frosts. For the threshold of 2.5◦C (Fig. 4b), a
mod-erate risk would prevail in the valley and between high and critical risk in altitudes greater than 3500 m a.s.l.; in cases of 0◦and −2◦C threshold values (Figs. 4c and d), there will be
low (or null) risk in altitudes lower than 3000 m a.s.l., and will decrease frost risk in the Mantaro valley between low and moderate condition.
7 Conclusions
There is a high relationship between frost characteristics and altitude in the Mantaro river basin. This allowed us to map some of these characteristics all over the basin based on oro-graphic data.
Trend analysis shows that the frequency of frost days (with
Tmin≤5◦C) has been increasing in the rainy season
(Septem-ber to April), with an average rate of 8 days/decade. How-ever, there is no a clear regional tendency in frost intensities for the same period.
Four types of frost risks were recognized in the Mantaro river basin: low, moderate, high and critical. The criti-cal risks (and very high probability of occurrence) are re-lated to high altitudes on the basin (altitudes higher than 3800 m a.s.l.), while the low (or null) frost risks are in the lower zones (less than 2500 m a.s.l.) with a very low prob-ability of occurrence. The Mantaro valley (altitude between 3100 and 3300 m a.s.l.), can expect between moderate and high frost risks, due to the important agricultural activity and the high sensitivity of the crops to frosts (with a low to mod-erate probability of occurrence).
Acknowledgements. This study was made as a part of the Inte-grated Assessment of the Mantaro River Basin Project, developed by the Geophysical Institute of Peru, inside the PROCLIM Program and in coordination with the National Council for the Environment (CONAM) of Peru, with financial support of The Royal Netherlands Embassy. The authors also express their thanks to Dr. Ken Takahashi for his important comments and suggestions to this paper and to Eng. Ricardo Zubieta for his support in GIS post-processing.
Edited by: P. Fabian
Reviewed by: M. Zak and P. Fabian
References
Garreaud, R. D. and Wallace, J. M.: Summertime incursions of mid-latitude air into subtropical and tropical South America, Mon. Wea. Rev., 126, 2713–2733, 1998.
IGP: Diagn´ostico de la Cuenca del Mantaro Bajo la Visi´on del Cam-bio Clim´atico. Fondo editorial del Concejo Nacional del Ambi-ente, Lima-Per´u, 90 pp., 2005a.
IGP: Atlas Clim´atico de Precipitaci´on y Temperatura del Aire en la Cuenca del R´ıo Mantaro. Fondo editorial del Concejo Nacional del Ambiente, Lima-Per´u, 107 pp., 2005b.
270 G. Trasmonte et al.: Frost risks in the Mantaro river basin
Villegas, E.: Zonificaci´on del Valle del Mantaro seg´un la Intensi-dad y Riesgo de Ocurrencia de Heladas Radiacionales, Tesis para optar el t´ıtulo de Ingeniero Meteor´ologo, Universidad Nacional Agraria La Molina, 134 pp., 1991.