HAL Id: hal-00318313
https://hal.archives-ouvertes.fr/hal-00318313
Submitted on 8 May 2007
HAL is a multi-disciplinary open access
archive for the deposit and dissemination of
sci-entific research documents, whether they are
pub-lished or not. The documents may come from
teaching and research institutions in France or
abroad, or from public or private research centers.
L’archive ouverte pluridisciplinaire HAL, est
destinée au dépôt et à la diffusion de documents
scientifiques de niveau recherche, publiés ou non,
émanant des établissements d’enseignement et de
recherche français ou étrangers, des laboratoires
publics ou privés.
locations: evidence for deviation from conjugacy
H. Wang, H. Lühr, S. Y. Ma, H. U. Frey
To cite this version:
H. Wang, H. Lühr, S. Y. Ma, H. U. Frey. Interhemispheric comparison of average substorm onset
locations: evidence for deviation from conjugacy. Annales Geophysicae, European Geosciences Union,
2007, 25 (4), pp.989-999. �hal-00318313�
www.ann-geophys.net/25/989/2007/ © European Geosciences Union 2007
Annales
Geophysicae
Interhemispheric comparison of average substorm onset locations:
evidence for deviation from conjugacy
H. Wang1,*, H. L ¨uhr2, S. Y. Ma1, and H. U. Frey3
1College of Electronic Informatics, Wuhan University, Wuhan 430079, P. R. China 2GeoForshungsZentrum Potsdam, 14473 Potsdam, Germany
3Space Sciences Laboratory, University of California, Berkeley, USA
*now at: Department of Atmospheric, Oceanic and Space science, University of Michigan, Ann Arbor, MI 48105, USA
Received: 19 January 2007 – Revised: 5 April 2007 – Accepted: 13 April 2007 – Published: 8 May 2007
Abstract. Based on 2760 well-defined substorm onsets in
the Northern Hemisphere and 1432 in the Southern Hemi-sphere observed by the FUV Imager on board the IMAGE spacecraft, a detailed statistical study is performed including both auroral regions. This study focuses on the hemispheric comparisons. Southward pointing interplanetary magnetic field (IMF) is favorable for substorm to occur, but still 30% of the events are preceded by northward IMF. The mag-netic latitude (MLat) of substorm onset depends mainly on the merging electric field (Em) with a relationship of |dMLat|=−5.2 E0.5m , where dMLat is the deviation from on-set MLat. In addition, seasonal effects on onon-set MLat are also detected, with about 2 degrees higher latitudes during solstices than equinoxes. Both IMF By and solar
illumina-tion have a significant influence on the magnetic local time (MLT) of onsets. An average relation, dMLT=0.25 By
be-tween IMF Byand the deviation from onset MLT, was found.
The By dependence varies slightly with the onset latitude.
At lower latitudes (higher activity) it is reduced. After re-moval of the relationship with IMF Bya linear relationships
remains between the solar zenith angle and onset MLT with dMLT=1 min/deg. Therefore, both solar illumination and IMF Bycan contribute to hemispheric longitudinal
displace-ments of substorm onset locations from conjugacy. No indi-cations for systematic latitudinal displacements between the hemispheres have been found.
Keywords. Ionosphere (Auroral ionosphere) –
Magneto-spheric physics (MagneoMagneto-spheric configuration and dynam-ics; Magnetotail)
Correspondence to: H. Wang ([email protected])
1 Introduction
Substorm onset, also called auroral breakup, is a sudden brightening of arcs taking place in the late evening sector. It indicates the impulsive unloading of energy previously stored in the magnetospheric tail, which leads to the precip-itation of auroral particles (e.g. Rostoker et al., 1987; Baker et al., 1996; Lui, 1996).
It is well-known that auroral and geomagnetic activity un-dergoes important seasonal and diurnal variations. Equinox months are favorable for magnetic activity. Because of the tilt of the magnetic dipole relative to the rotational axis, the activity also undergoes diurnal (universal time) variation. The causes are still discussed controversially. Historically, there were mainly three methods proposed to explain the ori-gin of the variations. These are the Russell-McPherron ef-fect (Russell and McPherron, 1973), the axial model (Cortie, 1912), and the McIntosh equinoctial effect (McIntosh, 1959). Besides these explanations dominated by the solar wind in-teraction efficiency there are also some other attempts to ex-plain the annual variation of magnetic activity, for example, the changing illumination of the polar ionosphere (e.g. Ly-atsky et al., 2001; Nagatsuma, 2006). Recently, it was shown that the solar illumination could control the saturation of the polar cap potential (Nagatsuma, 2004) and the latitudinal position of the dayside field-aligned currents (Wang et al., 2005a).
The onset characteristics have been studied in the past in comparison with various solar wind parameters and so-lar illumination, which disclose to certain degree the ori-gin of the seasonal and diurnal variations of the onset lo-cations. Liou et al. (2001) found that the magnetic latitude (MLat) of the substorm is IMF Bzdependent, while the
mag-netic local time (MLT) of the onsets is IMF By dependent,
based on 10 months of POLAR UVI observations. G´erard et al. (2004) found that the magnetic latitudes of the onsets were correlated best with the solar wind dynamic pressure.
This statement was based on a small subset (78) of substorm events observed in winter.
The average substorm onset location shows significant seasonal variations. Liou et al. (2001) found that the sub-storm onsets tended to start at earlier local times in northern hemispheric summer than in winter, and at intermediate local times in spring. Our previous study of northern hemispheric events disclosed that substorm onsets in sunlight tend to oc-cur 1 h earlier in local time and 1.5◦MLat more poleward than in darkness, suggesting that the ionospheric conductiv-ity has an influence on the location of substorm onset (Wang et al., 2005b). Newell et al. (1996) found that an increased ionospheric conductivity decreases the likelihood of estab-lishing energetic electron precipitation (which is needed to excite discrete auroras). Therefore, it is quite possible that ionospheric conductivity may play a role in the substorm pro-cess since it can control the auroral activity.
These general features of solar wind and solar illumina-tion control of substorm onset locaillumina-tion are derived primarily from Northern Hemisphere studies. One question we want to address here is whether these properties can be found also in the Southern Hemisphere. Recent studies have disclosed sig-nificant hemispheric asymmetry of substorm onset locations (e.g. Østgaard et al., 2006). They proposed that longitudinal asymmetry was primarily controlled by IMF clock angle de-fined in GSM coordinates, which is regarded as a follow on to the Northern Hemisphere study by Wang et al. (2005b). In this work we will investigate the statistical properties of sub-storm onset locations in both hemispheres, including their dependence on solar wind input and solar illumination. Fur-thermore, interhemispheric comparisons of substorm onset locations will be conducted in order to find out the cause for hemispheric discrepancies. Finally, seasonal and diur-nal variations of substorm onset locations and their relation to the geomagnetic activity will be studied.
The systematic detection of substorm onsets by global im-agers provides a more objective picture of the initial phase leading to the development of a substorm (Liou et al., 1999). By analyzing IMAGE satellite FUV-WIC measurements we have studied statistically the substorm onset characteristics in the auroral regions of both hemispheres. In the follow-ing section we describe the data set used in this work. In Sect. 3 we study the solar wind effects on the onset locations in terms of magnetic local time and latitude. Hemispheric comparison of the substorm onset locations is presented. A detailed discussion of the latitude and longitude variations of breakup locations in the two hemispheres is given in Sect. 4. Section 5 summarizes the main conclusions.
2 Data set
The IMAGE satellite is in a highly eccentric polar orbit of 1000 km by 45, 600 km altitude. The far ultraviolet (FUV) instrument on board the IMAGE spacecraft provides
obser-vations of the aurora in ultraviolet light on a global scale with a spatial resolution of 50 km and a temporal resolu-tion of ∼2 min. The prime data source used by Frey et al. (2004) to retrieve the information on substorm onset was the Wideband Imaging Camera (WIC), and if not available, the oxygen imaging Spectrographic Imager channel (SI-13). The WIC has a passband at wavelengths of 140–180 nm, which is sensitive to emissions from the N2-LBH band and atomic NI lines (149.3 nm). The SI-13 has a passband of 5 nm centered around the 135.6 nm OI doublet.
A detailed description of the instrument on board the IM-AGE spacecraft and the approach how to determine auroral substorm onsets from the FUV instrument can be found in Frey et al. (2004). The following schemes are used for sub-storm onset identification. First, a clear local brightening of the aurora has to occur. Secondly, the aurora has to expand to the poleward boundary of the auroral oval and spread az-imuthally in local time for at least 20 min. Finally, a sub-storm onset is only accepted if at least 30 min had passed after the previous onset (Frey et al., 2004). Figure 1 in Wang et al. (2005b) shows two auroral images from IMAGE FUV-WIC in the frame of magnetic latitude (MLat) and lo-cal time (MLT) coordinates. The coordinate frame used to order FUV observations is the Apex coordinate system de-scribed by Richmond (1995). A prominent auroral activity at local midnight occurs at 11:20 UT on 2 September 2001. In the next tens of minutes the aurora expands poleward and azimuthally, which are typical substorm features.
The list of substorm onset times and locations, observed by the IMAGE-FUV in the Northern Hemisphere covers the period May 2000 (start of the regular IMAGE-FUV opera-tions) through December 2003 (Frey et al., 2004). In the southern auroral oval observations were made during January 2004 through December 2005 (Frey and Mende, 2007). The compiled list of substorm onset times and locations covers all seasons several times.
We use also 1 min interplanetary magnetic field (IMF) and solar wind data collected by the Advanced Composition Ex-plorer (ACE) satellite. The satellite is located at the Lagrange Points (L1) approx. 220 RE (∼1.48 million km) in front of
the Earth. The solar wind data have been propagated from the ACE satellite to the magnetopause. The solar wind parame-ters at the magnetopause are averaged over a one hour period before the onset (for justification see Wang et al., 2005b).
3 Observations
The large number of substorm events detected during the years considered (2760 events during 2000∼2003 in the north and 1432 events during 2004∼2005 in the south) is a good basis for studying the statistical properties of substorm onsets in the northern and southern polar region. Figure 1 shows the distribution of events versus the months of a year. All seasons are covered fairly evenly. Daylight does not seem
1 2 3 4 5 6 7 8 9 10 11 12 0 50 100 150 200 250 300 Mon Number of events NH SH
Fig. 1. Occurrence distribution of detected substorm onsets for the
different months of the year, separately for the two hemispheres.
to cause a problem. The occurrence number varies around 250 for each month in the Northern Hemisphere and around 150 in the south. Markedly fewer events are detected during the months April and October in the Southern Hemisphere and during April in the Northern Hemisphere. During these months the camera was deactivated for most of the time in order to protect it against direct sunlight exposure.
3.1 Correspondence to solar wind parameters
At first let us see which interplanetary configurations are fa-vorable for triggering a substorm onset. In a previous study Wang et al. (2005b) have performed a superposed epoch analysis of the substorm onset time with respect to various solar wind parameters (which had been time-shifted to the dayside magnetopause). That study was based on two years (2002–2003) of substorm onset events in the Northern Hemi-sphere. In this study, we will test the result with a much larger data set. Furthermore, we will perform the same anal-ysis based on Southern Hemisphere events in order to find out whether the same features can be derived as earlier from Northern Hemisphere studies.
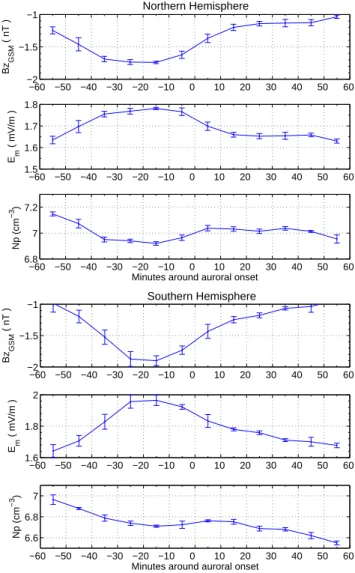
Figure 2 shows the average development of solar wind pa-rameters, IMF Bz, Em, merging electric field and Np,
pro-ton density for the two hours around the auroral breakup time, as derived from WIC. The curves in the left frames are based on Northern Hemisphere events and in the right on southern events. No obvious differences could be found for the triggering conditions in the two hemispheres. The averaged IMF Bz attains a minimum about 20 min before
the onset. At the time of onset an IMF northward turn-ing is observed. The merging electric field, defined as
Em=vsw(By2+Bz2)0.5sin2(θ/2) (e.g. Kan and Lee, 1979),
where vsw is the solar wind velocity and θ is the clock
an-−60 −50 −40 −30 −20 −10 0 10 20 30 40 50 60 −2 −1.5 −1 Bz GSM ( nT ) −60 −50 −40 −30 −20 −10 0 10 20 30 40 50 60 1.5 1.6 1.7 1.8 Em ( mV/m ) −60 −50 −40 −30 −20 −10 0 10 20 30 40 50 60 6.8 7 7.2 Np (cm −3 )
Minutes around auroral onset
Northern Hemisphere −60 −50 −40 −30 −20 −10 0 10 20 30 40 50 60 −2 −1.5 −1 Bz GSM ( nT ) −60 −50 −40 −30 −20 −10 0 10 20 30 40 50 60 1.6 1.8 2 Em ( mV/m ) −60 −50 −40 −30 −20 −10 0 10 20 30 40 50 60 6.6 6.8 7 Np (cm −3 )
Minutes around auroral onset
Southern Hemisphere
Fig. 2. Superposed epoch analysis of solar wind parameters around
auroral breakup. The key time, “0”, corresponds to the onset time. Parameters from top to bottom are IMFBz, merging electric field,
Em, and solar wind density, Np, which have been propagated to the dayside magnetopause. The bars indicate the uncertainties of the 10 min averages.
gle of the IMF, performs a similar variation in anti-phase. The relative change of Emis, however, significantly smaller
than that of IMF Bz. The average number density, Np, also
attains a shallow minimum about 20 min before the onset. The density recovers at the time of breakup. Although this effect is small, it is significant and it shows up consistently in the independent datasets from both hemispheres. The same analysis was also performed with the other components of the IMF, the solar wind velocity, vsw, the dynamic pressure, Pdyn, Akasofu coupling parameter, ε, and a more
sophis-ticated coupling function, ε∗=Pdyn1/6vswBT sin4ϑ/2 (G´erard
et al., 2004), where BT is the transverse component of the
18192021222324 1 2 3 4 5 6 0 50 100 150 200 µ = 23.21 σ = 2.636 A = 166.6 nrms = 0.1 µ = 22.74 σ = 2.313 A = 194.1 nrms = 0.1
MLT (hh)
Number of events
Northern Hemisphere
18192021222324 1 2 3 4 5 6 0 50 100 150 µ = 22.42 σ = 2.716 A = 94.3 nrms = 0.1 µ = 23.03 σ = 3.085 A = 80.8 nrms = 0.1MLT (hh)
Number of events
Southern Hemisphere
50 55 60 65 70 75 80 85 90 0 20 40 60 80 100 µ = 65.97o σ = 5.085 A = 81.2 nrms = 0.2 µ = 66.39o σ = 5.135 A = 87.2 nrms = 0.1MLat (
o)
Number of events
Northern Hemisphere
−90 −85 −80 −75 −70 −65 −60 −55 −500 20 40 60 µ = −66.66o σ = 5.642 A = 45.8 nrms = 0.2 µ = −66.46o σ = 5.814 A = 44.7 nrms = 0.2MLat (
o)
Number of events
Southern Hemisphere
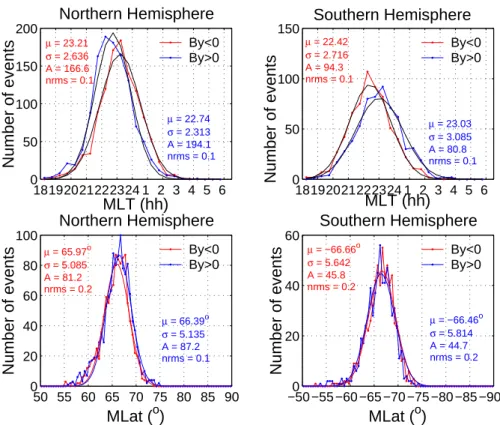
By<0 By>0 By<0 By>0 By<0 By>0 By<0 By>0Fig. 3. Number of events of substorm onsets as a function of MLT and MLat for IMF By>0 and IMF By<0 in the Northern (left) and Southern (right) Hemisphere.
these parameters shows a persistent signature related to the substorm onset time.
In a next step we wanted to see, how IMF conditions in-fluence the location of the breakup. First, let us have a look at the IMF Byeffect on the substorm onset location. For the
purpose of this study, all substorm onset events are sorted by the sign of IMF Byseparately for the Northern and Southern
Hemisphere. Then the distribution of events as a function of MLT and MLat are plotted and shown in Fig. 3. For a more quantitative description of the main characteristics of the distribution we have fitted and over-plotted a Gauss func-tion to the points in this and also later figures. To estimate the goodness of Gauss fit, we have produced the normalized root-mean-square (nrms) as shown in this and also later fig-ures. The nrms is defined as
rPn
i=1(yi−y∗i)2
Pn i=1(yi2)
, where yi is the
measured and yi∗ the fitted. A nrms closer to 0 indicates a better fit. With regard to Fig. 3, we obtain all nrms no more than 0.2.
In both hemispheres there emerges a clear difference in local time of substorm onset for IMF By>0 and By<0. In
the Northern Hemisphere substorm onsets shift toward ear-lier MLT by about half an hour for positive By and toward
later local time during negative By. An opposite
relation-ship with By, as mentioned above, is observed in the
South-ern Hemisphere. This effect of IMF By on onset location is
not new and has repeatedly been reported (e.g. Rodger et al., 1984; Liou et al., 2001). We have also investigated a possible
Byeffect on the onset latitude. The average magnetic latitude
is found at about 66◦MLat. This value is independent of the Bysign being valid for both hemispheres. The slight average
poleward shift in the south we do not regard as significant. The same analysis is performed with the other components of the IMF. The sign of IMF Bxalso affects the MLT of onset
location, but in opposite direction to that of the By
compo-nent (not shown). This relation is not surprising since the IMF components Bxand By are correlated through the
pre-ferred Parker spiral geometry of the interplanetary magnetic field. It can be stated that neither Bx nor By signs have an
influence on the onset latitude or on the occurrence rate of substorms. The situation is different for the IMF Bz
compo-nent. As expected, the occurrence rate is strongly dependent on the Bzsign. About two-third of the events are preceded
by a negative Bz. But it is still remarkable that 30% of the
substorms are preceded by positive Bz. On the other hand,
the mean local time of the onset is not affected by Bz, as can
be seen in Fig. 4. We find furthermore that the average lati-tude of break-ups is about 1◦more equatorward for negative
Bzthan for positive Bz.
We have also calculated the correlation of MLT and MLat with solar wind parameters like vsw, Pdyn, Emand ε.
18192021222324 1 2 3 4 5 6 0 50 100 150 200 250 µ = 22.99 σ = 2.635 A = 235.6 nrms = 0.1 µ = 22.88 σ = 2.206 A = 117.5 nrms = 0.1
MLT (hh)
Number of events
Northern Hemisphere
Bz<0 Bz>0 18192021222324 1 2 3 4 5 6 0 50 100 150 µ = 22.56 σ = 2.892 A = 128.4 nrms = 0.1 µ = 22.97 σ = 2.803 A = 47.1 nrms = 0.2MLT (hh)
Number of events
Southern Hemisphere
Bz<0 Bz>0 50 55 60 65 70 75 80 85 90 0 50 100 150 µ = 65.76o σ = 5.972 A = 105.2 nrms = 0.2 µ = 66.65o σ = 4.683 A = 55.6 nrms = 0.2MLat (
o)
Number of events
Northern Hemisphere
Bz<0 Bz>0 −90 −85 −80 −75 −70 −65 −60 −55 −500 20 40 60 80 µ = −66.12o σ = 5.796 A = 63.7 nrms = 0.1 µ = −66.96o σ = 5.767 A = 24.8 nrms = 0.3MLat (
o)
Number of events
Southern Hemisphere
Bz<0 Bz>0Fig. 4. Same as Fig. 3, but for IMF Bz>0 and Bz<0.
various solar wind parameters. However, Em gives the
best correlation with MLat yielding a correlation coefficient, R=0.5. This finding is consistent with the earlier study on substorm onsets (Wang et al., 2005b). In that case a linear relation between the polar cap area and the square root of
Em could be established. Emhas been identified as a
suit-able geoeffective solar wind coupling parameter for loading of the magnetosphere confirming the results of previous stud-ies (e.g. Newell et al., 2006; Wang et al., 2005a).
3.2 Solar illumination effect
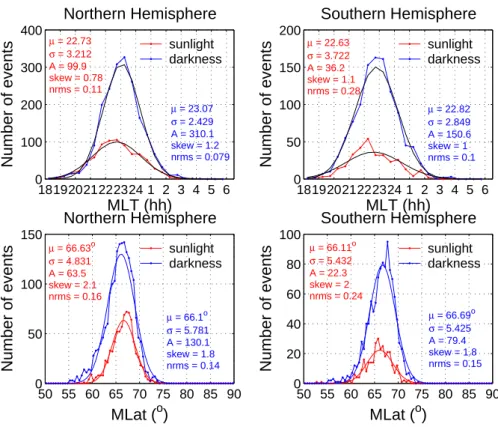
For the purpose of this study, all substorm onset events are sorted by solar illumination condition separately for the Northern and Southern Hemisphere. The substorm onsets are separated into two groups, depending on the solar zenith an-gle (SZA). Daylight is defined as SZA<100◦and darkness as SZA>100◦(e.g. Schlegel, 1988; Wang et al., 2005a). For each bin in magnetic latitude and local time the number of events was determined, as shown in Fig. 5. It is expected that a higher occurrence frequency of substorm onsets is ob-served in darkness because these events occur close to local midnight. This region is in sunlight only during local sum-mer. In the Northern Hemisphere one-fourth of the events occur in sunlight and only one-fifth in the south.
In the Northern Hemisphere there is a clear difference in local time of the substorm onset between daylight and
darkness. In darkness substorm onsets occur on average at 23.1 MLT, while in sunlight they tend to occur earlier, at 22.7 MLT. The most likely onset locations are found at 66.6◦MLat in sunlight and at 66.1◦MLat in darkness, which suggests a slight dependence of the onset latitude on illu-mination conditions. This is consistent with previous stud-ies based on relatively smaller numbers of events (e.g. Liou et al., 2001; Wang et al., 2005b).
In the Southern Hemisphere there is also a difference in local time of the substorm onset between daylight and dark-ness. Substorm breakups shift similar to the Northern Hemi-sphere to earlier time in daylight and to later time in dark-ness. However, there is an indication for an equatorward shift in daylight, which is opposite to the Northern Hemi-sphere. This indicates that solar illumination enhances the inter-hemispheric asymmetry of the substorm breakup loca-tions in azimuthal direction, but has no effect in the merid-ional direction.
3.3 Annual variation of onset location
After having presented averaged characteristics of substorm onsets we will make use of the large number of events to look at the annual variation of some of the parameters. In Sect. 3.2 we have shown that the location of substorm onsets depends to a certain degree on the solar illumination conditions. The question arises, is this a seasonal or an illumination effect? In
18192021222324 1 2 3 4 5 6 0 100 200 300 400 µ = 22.73 σ = 3.212 A = 99.9 skew = 0.78 nrms = 0.11 µ = 23.07 σ = 2.429 A = 310.1 skew = 1.2 nrms = 0.079
MLT (hh)
Number of events
Northern Hemisphere
sunlight darkness 18192021222324 1 2 3 4 5 6 0 50 100 150 200 µ = 22.63 σ = 3.722 A = 36.2 skew = 1.1 nrms = 0.28 µ = 22.82 σ = 2.849 A = 150.6 skew = 1 nrms = 0.1MLT (hh)
Number of events
Southern Hemisphere
sunlight darkness 50 55 60 65 70 75 80 85 90 0 50 100 150 µ = 66.63o σ = 4.831 A = 63.5 skew = 2.1 nrms = 0.16 µ = 66.1o σ = 5.781 A = 130.1 skew = 1.8 nrms = 0.14MLat (
o)
Number of events
Northern Hemisphere
sunlight darkness 50 55 60 65 70 75 80 85 90 0 20 40 60 80 100 µ = 66.11o σ = 5.432 A = 22.3 skew = 2 nrms = 0.24 µ = 66.69o σ = 5.425 A = 79.4 skew = 1.8 nrms = 0.15MLat (
o)
Number of events
Southern Hemisphere
sunlight darknessFig. 5. Same as Fig. 3, but for solar zenith angle, SZA>100◦(darkness) and SZA<100◦(sunlight).
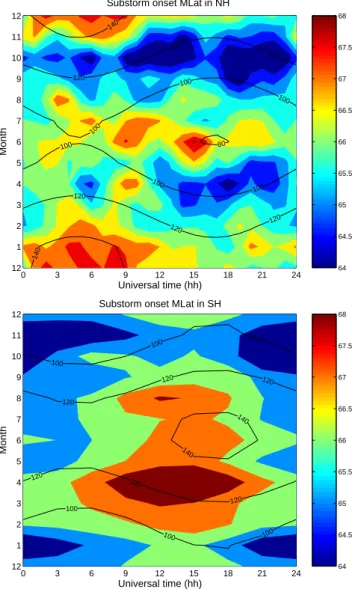
an attempt to clarify this open issue we plotted in Fig. 6 the distribution of magnetic latitudes of the onset locations in a month versus universal time coordinate frame. To visualize a possible relation of the distribution to the illumination condi-tions contour lines of the solar zenith angle are over-plotted. In the Northern Hemisphere a clear horizontal four-band structures emerges reflecting alternating high and low lat-itudes. These bands are centered at the months January, April, July and October. Superimposed on that there is a UT modulation with higher onset latitudes around 05:00 UT and lower around 18:00 UT. In the Southern Hemisphere the distribution is not as clear, but still, a certain trend of anti-correlation with the north can be seen. Highest onset lati-tudes are detected during April and lowest around Decem-ber solstice. Again, there is an UT dependence. In this hemisphere latitudes are higher around 14:00 UT and lower around 24:00 UT.
Similar to the latitude we also investigated the distribution of the onset local time. Figure 7 shows the variation of local times in a month versus universal time plot. The situation is not as clear as in the case of latitude. A reason for that is probably the additional influence of the IMF By
compo-nent on the onset local time (cf. Sect. 3.1). In spite of that a certain trend can be deduced from the plots. There is a pref-erence in the Northern Hemisphere for late local times in the first half of the year and for earlier onset times during the second half. Additionally, we find also here an UT
depen-dence shifting break-ups to earlier MLTs around 06:00 UT and to later MLTs around 18:00 UT. In the Southern Hemi-sphere the local time variation is even less evident, but some indications for opposite responses can be deduced, including both the seasonal and UT dependence. Some of these obser-vations can be regarded as indications for a deviation of the break-up locations in the two hemispheres from their conju-gate points. A discussion of possible causes will be given in the next section.
4 Discussion
In the previous section we have shown that the locations of substorm onsets depend both on IMF and illumination condi-tions. The large number of detected events allows us to look at both aspects simultaneously. To our knowledge this has never been done in a previous study on comparable scale. 4.1 Substorm latitude
It is known that for higher magnetic activity the polar cap area increases and with that substorm onsets occur at lower latitudes. A confirmation for that can be found in Fig. 4. For negative Bz the latitude is shifted on average by 1◦in
lati-tude equatorward. We have to correct for that effect before we can start a comparison between the hemispheres since the two data sets have been taken at different times therefore
0 3 6 9 12 15 18 21 24 12 1 2 3 4 5 6 7 8 9 10 11 12 Universal time (hh) Month 80 100 100 100 100 100 100 120 120 120 120 120 120 140 140 14 0 80 100 100 100 100 100 100 120 120 120 120 120 120 140 140
Substorm onset MLat in NH
64 64.5 65 65.5 66 66.5 67 67.5 68 0 3 6 9 12 15 18 21 24 12 1 2 3 4 5 6 7 8 9 10 11 12 Universal time (hh) Month
Substorm onset MLat in SH
100 100 100 100 100 100 120 120 120 120 120 120 140 140 64 64.5 65 65.5 66 66.5 67 67.5 68
Fig. 6. Distribution of substorm onset magnetic latitude versus month and universal time for both hemispheres. Overplotted are SZA contours for the location 66.5◦MLat and 23:00 MLT.
experienced different interplanetary conditions. Dedicated investigations of Wang et al. (2005b) revealed that there is a good correlation in the Northern Hemisphere between the substorm latitude and the square root of the merging elec-tric field, Em. For events in darkness, which accounts for
about 80% of the cases, they deduced an onset latitude,
β=73◦−5.2 E0.5
m . For events in sunlight the dependence was
only half as strong.
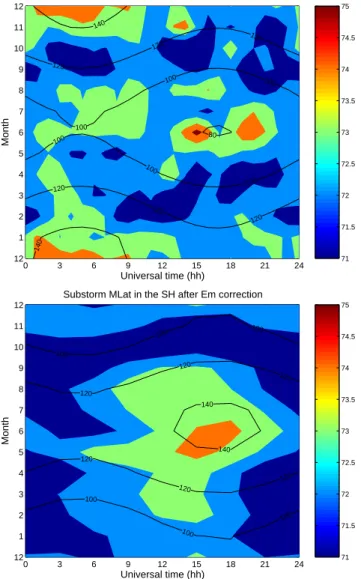
In this study we make use of that derived latitude de-pendence and apply a latitude correction of the form, dMLat=5.2 Em0.5 to the samples of both hemispheres. The new latitude distribution is shown in Fig. 8. Compared to Fig. 6 the average latitude has shifted by about 7◦poleward, and the range of variation is reduced (some small-scale scat-ter has been introduced by the Em correction). The
result-0 3 6 9 12 15 18 21 24 12 1 2 3 4 5 6 7 8 9 10 11 12 Universal time (hh) Month Substorm onset MLT in NH 80 100 100 100 100 100 100 120 120 120 120 120 120 140 140 14 0 21 21.5 22 22.5 23 23.5 24 0 3 6 9 12 15 18 21 24 12 1 2 3 4 5 6 7 8 9 10 11 12 Universal time (hh) Month Substorm onset MLT in SH 100 100 100 100 100 100 120 120 120 120 120 120 140 140 21 21.5 22 22.5 23 23.5 24
Fig. 7. Same as Fig. 6, but for onset local time.
ing average latitude (valid for Em=0) is about 73◦MLat for
the Northern Hemisphere and about 72◦for the south. This small difference cannot be considered as significant. We have compared the monthly mean latitudes, after applying the cor-rection, with the monthly mean values of SZA and found no correlation in any of the hemispheres.
When looking at Fig. 8 some systematic latitude struc-ture seem to remain, however, after the removal of the de-pendence on magnetic activity. Obviously, substorms oc-cur about 2◦more equatorward during equinoxes than
dur-ing solstice. This implies a systematically larger polar cap area during equinoxes, which may be consistent with the Russell-McPheron and McIntosh effects. Liou et al. (2001) also found that the average onset latitude is lowest in spring, then followed by summer and winter. Wang et al. (2005b) have reported average onset latitudes 1.5◦more poleward for events in sunlight compared to those in darkness. From the
0 3 6 9 12 15 18 21 24 12 1 2 3 4 5 6 7 8 9 10 11 12 Universal time (hh) Month
Substorm MLat in the NH after Em correction
80 100 100 100 100 100 100 120 120 120 120 120 120 140 140 71 71.5 72 72.5 73 73.5 74 74.5 75 0 3 6 9 12 15 18 21 24 12 1 2 3 4 5 6 7 8 9 10 11 12 Universal time (hh) Month
Substorm MLat in the SH after Em correction
100 100 100 100 100 100 120 120 120 120 120 120 140 140 71 71.5 72 72.5 73 73.5 74 74.5 75
Fig. 8. Same as Fig. 6, but after removal of the Emeffect (see text).
results obtained here we can say that this is a seasonal ef-fect and not a response to solar illumination. Overall we may conclude that neither the IMF configuration nor the solar ir-radiation seem to cause deviations of onset locations from the conjugate latitudes in both hemispheres.
4.2 Onset local time
The situation is quite different for the local times at which the substorm onsets occur. Figures 3 and 5 seem to imply that both IMF Byand SZA have an influence on the break-up
time. To disentangle the two dependences we sorted the MLT value of each event into UT bins, as shown in Fig. 7. MLT averages for each UT hour were calculated, separately for both hemispheres. In the same way the corresponding IMF
Bycomponents and SZA values were binned and averaged.
As expected, the SZA is practically independent of UT. In this way the By influence on the MLT of the onsets can be
0 3 6 9 12 15 18 21 24 12 1 2 3 4 5 6 7 8 9 10 11 12 Universal time (hh) Month
Substorm MLT in the NH after By correction
80 100 100 100 100 100 100 120 120 120 120 120 120 140 140 140 21 21.5 22 22.5 23 23.5 24 0 3 6 9 12 15 18 21 24 12 1 2 3 4 5 6 7 8 9 10 11 12 Universal time (hh) Month
Substorm MLT in the SH after By correction
100 100 100 100 100 100 120 120 120 120 120 120 140 140 21 21.5 22 22.5 23 23.5 24
Fig. 9. Same as Fig. 7, but after removal of the IMF Byeffect (see text).
determined. The correlation analysis reveals the dependence, dMLT=±0.25By. In the Northern Hemisphere a positive By
shifts the onset time to earlier hours and in the south to later times.
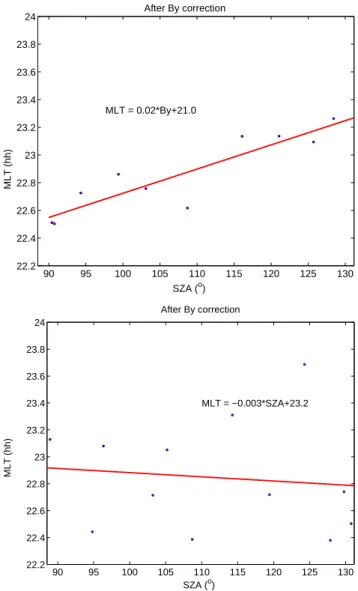
The obtained local time distribution after applying the IMF
Bycorrection is shown in Fig. 9. In the Northern Hemisphere
MLT features are now rather well aligned with the SZA con-tour lines. Later onset times show up at large SZA and early times at small solar zenith angles. In the Southern Hemi-sphere no such clear picture emerges. For a more quantita-tive assessment we have calculated monthly averages of both the onset MLTs and SZAs. Figure 10 shows scatter plots for both hemispheres with regression lines. It is immediately evident that we have a linear dependence of these two quanti-ties in the Northern Hemisphere while there is no correlation found in the south. The revealed dependence in the Northern
Hemisphere amounts to dMLT=0.018 h/degSZA, which is equivalent to an increase of about 1 min in local time for each degree in solar zenith angle. Over the whole range we find a local time shift of 45 min. This value is close to the one hour difference in MLT reported by Wang et al. (2005b) between onsets in sunlight and darkness. The question why solar irra-diation has such a clear effect on the onset local time in the Northern Hemisphere and no effect in the south should be addressed in a dedicated study.
The influence of IMF By on various auroral phenomena
is known already for quite a while. There are, however, only few quantitative statements in the literature giving num-bers for the local time displacement of a substorm onset per nano Tesla of By. For example, Rodger et al. (1984) quote
0.2 h/nT and Liou et al. (2001) report 0.15 h/nT for |Bz|and |Bx|<1nT . From this study, based on a much larger data set,
we determined a larger By effect (0.25 h/nT).
For an assessment of the apparent inconsistency between the different studies we follow the first order approach of Cowley (1981) on the magnetospheric asymmetry associated with the IMF By component. By assuming a dipolar field
geometry he can give an analytical expression for the az-imuthally displacement, 1φ, of the ionospheric footprints in the substorm meridian:
1φ= by
4B0cos6β0
[cos2β0tan β0(cos2β0+1.5)+1.5β0] (1)
where by is the dawn-to-dusk magnetic field in the
magne-tosphere, B0 the geomagnetic field strength at the equator
(∼30 000 nT), β0is the magnetic latitude of the substorm
on-set. It is evident from Eq. (1) that the amount of azimuthally displacement strongly depends on the latitude of the onset. Another question is, how much of the IMF By is
penetrat-ing into the magnetosphere? For the near-Earth space Maus and Luehr (2005) found the ratio, by=0.23 By. If we insert
that number into Eq. (1) and search for the onset latitude that would give the obtained displacement (0.25 h/nT), we obtain
β0=77.5◦MLat. From this resulting unrealistically high
lat-itude we conclude that the dipole geometry is not a sufficient assumption for the fluxtube connecting to the substorm re-gion. The dipole field is valid only in current free space and the influence of By on the displacement is strongest at the
apex of the field line. Just in that region significant cross-tail currents are expected.
From Eq. (1) it can be deduced that the IMF By effect
gets stronger on higher L-shells. In order to test whether there is a latitude-dependent sensitivity of the onset location on IMF By, we have divided the data set of Northern
Hemi-sphere events into two equal groups, one for onsets at lati-tudes above 66.2◦ MLat and the other for those with lower latitudes. The same procedure was applied, as described above, for the determination of the mean MLT dependence on IMF By. We found a dependence dMLT=0.3 By for the
higher latitude events and dMLT=0.2 By for those at lower
latitudes. This shows that onset latitudes have an effect on
90 95 100 105 110 115 120 125 130 22.2 22.4 22.6 22.8 23 23.2 23.4 23.6 23.8 24 SZA (o) MLT (hh) MLT = 0.02*By+21.0 After By correction 90 95 100 105 110 115 120 125 130 22.2 22.4 22.6 22.8 23 23.2 23.4 23.6 23.8 24 SZA (o) MLT (hh) MLT = −0.003*SZA+23.2 After By correction
Fig. 10. Dependence of onset local time on solar zenith angle, SZA, after removal of IMF Byeffect.
the shift of onset MLT by IMF By. Since the onset latitude
is closely related to the solar wind input, as was discussed in Sect. 4.1, the scaling factor in front of By becomes activity
dependent.
In a recent study Østgaard et al. (2006) suggested that the azimuthal displacement of the onset location is closely re-lated to the IMF clock angle. We have tested the efficiency of the IMF clock angle function presented by Østgaard et al. (2006) (Fig. 2) for correcting the MLT displacement shown in Fig. 9. The result is not convincing, since the obtained dis-tribution is much less ordered than that of Fig. 10. For that reason we do not see any advantage in using the clock angle as a proxi for the MLT difference in the two hemispheres.
5 Summary
A detailed study of substorm onset locations has been per-formed. Based on a large set of substorm onset times and locations, obtained from both hemispheres, important depen-dence could be derived in a statistical approach. For several aspects it is the first time that statistically significant numer-ical factors can be given for the variation of break-up loca-tions including the deviation from conjugate localoca-tions in both hemispheres. Important findings are:
1. A large majority of substorms is preceded by a south-ward oriented IMF, but about 30% of the events are pre-ceded by northward IMF.
2. The latitude of the onset depends linearly on the square root of the merging electric field. A relation
|dMLat|=−5.2 Em0.5 is equally valid for both hemi-spheres. In addition there seems to be a dependence of the onset latitude on season. Break-ups occur on average 2◦more poleward during solstices than during equinoxes.
3. No dependence of onset latitude on solar illumination conditions was found. This answers one of the pending questions in Wang et al. (2005b).
4. The local time of a break-up depends on the IMF By
component. Positive dawn-to-dusk fields shift the on-sets in the Northern Hemisphere to earlier times and in the south to later local times. The scaling factor be-tween IMF By and onset MLT depends on the latitude
of the onset. As a consequence, the displacement of the onset locations from the conjugate points in the two hemispheres is larger during quiet periods than during active. For the data set investigated we obtained the av-erage relation, dMLT=0.25 h/nT, between IMF By and
onset MLT.
5. There seems to be an additional contribution to the hemispheric displacement coming from the illumination conditions. We have clear evidence from the Northern Hemisphere that substorms occur at earlier local times in sunlight than during darkness. The obtained rela-tion is dMLT=1 min/deg, between the solar zenith angle and event MLT. The smaller sample number from the Southern Hemisphere does not support this tendency, but a sorting of all events in sunlit and dark indicates an equivalent dependency (earlier MLT for sunlit, cf. Fig. 5).
The reliability of the inter-hemispheric relation presented here should be verified on a case-by-case basis. For such a study the substorm onset catalogue could be used to select suitable events. There are several magnetometer networks in the Northern Hemisphere which can be used to provide in-situ substorm observations of South Pole events from the catalogue.
Acknowledgements. We are obliged to F. Christiansen for providing the ACE IMF data propagated to the magnetopause. We thank the ACE MAG and SWEPAM instrument teams and the ACE Science Center for providing the ACE data. This study was supported by the National Nature Science Foundation of China (No. 40390150 and No. 40604017).
Topical Editor I. A. Daglis thanks two referees for their help in evaluating this paper.
References
Baker, D. N., Pulkkinen, T. I., Angelopoulos, V., Baumjohann, W., and McPherron, R. L.: Neutral line model of substorms: Past results and present view, J. Geophys. Res., 101, 12 975–13 010, 1996.
Cortie, A. L.: Sunspot and terrestrial magnetic phenomena 1898– 1911, Mon. Not. R. Astron. Soc., 73, 52–60, 1912.
Cowley, S. W. H.: Magnetospheric asymmetries associated with the y-component of the IMF, Planet. Space. Sci., 29, 79–96, 1981. Frey, H. U. and Mende, S. B.: Substorm onset observations by
IMAGE-FUV: 2003–2005, in: Proceedings of the Eighth Inter-national Conference on Substorms, edited by: Syrjaesuo, M. and Donovan, E., Univ. of Calgary, Alberta, Can., in press, 2007. Frey, H. U., Mende, S. B., Angelopoulos, V., and Donovan, E. F.:
Substorm onset observations by IMAGE-FUV, J. Geophys. Res., 109, A10304, doi:10.1029/2004JA010607, 2004.
G´erard, J. C., Hubert, B., Grard, A., and Meurant, M.: So-lar wind control of auroral substorm onset location observed with the IMAGE-FUV imagers, J. Geophys. Res., 109, A03208, doi:10.1029/2003JA010129, 2004.
Kan, J. R. and Lee, L. C.: Energy coupling function and solar wind-magnetosphere dynamo, Geophys. Res. Lett., 6, 577–580, 1979. Liou, K., Meng, C. I., Lui, T. Y., Newell, P. T., Brittnacher, M., Parks, G., Reeves, G. D., Anderson, R. R., and Kumoto, K.: On relative timing in substorm onset signatures, J. Geophys. Res., 104, doi:10.1029/1999JA900206, 1999.
Liou, K., Newell, P. T., Sibeck, D. G., and Meng, C. I.: Observation of IMF and seasonal effects in the locaiton of auroral substorm onset, J. Geophys. Res., 106, 5799–5810, 2001.
Lui, A. T. Y.: Current disruption in the Earth’s magnetosphere: Ob-servations and models, J. Geophys. Res., 101, 13 067–13 088, 1996.
Lyatsky, W., Newell, P. T., and Hamza, A.: Solar illumination as cause of the equinoctial preference for geomagnetic activity, Geophys. Res. Lett., 28, 2353–2356, 2001.
Maus, S. and Luehr, H.: Signature of the quiet-time magnetospheric magnetic field and its electromagnetic induction in the rotating Earth, Geophys. J. Int., 162(3), 755–763, doi:10.1111/j.1365-246X.2005.02691.x, 2005.
McIntosh, D. H.: On the annual variation of magnetic disturbances, Philos Trans. R. Soc. London, A251, 525–552, 1959.
Nagatsuma, T.: Conductivity dependence of cross-polar
potential saturation, J. Geophys. Res., 109, A04210,
doi:10.1029/2003JA010286, 2004.
Nagatsuma, T.: Diurnal, semiannual, and solar cycle variations of solar wind – magnetosphere – ionosphere coupling, J. Geophys. Res., 111, A09202, doi:10.1029/2005JA011122, 2006.
Newell, P. T., Meng, C. I., and Lyons, K. M.: Suppression of dis-crete aurora by sunlight, Nature, 38, 766–767, 1996.
Newell, P. T., Sotirelis, T., Liou, K., Meng, C.-I., and Rich, F. J.: Cusp latitude and the optimal solar wind coupling function, J. Geophys. Res., 111, A09207, doi:10.1029/2006JA011731, 2006. Østgaard, N., Mende, S. B., Frey, H. U., Sigwarth, J. B., Aasnes, A., and Weygand, J. M.: Conjugate imaging of substorms, in: Proc. Int. Conf. Substorm-8, pp. 215–218, 2006.
Richmond, A. D.: Ionospheric Electrodynamics Using Magnetic Apex Coordinates, J. Geomagn. Geoelectr., 47, 191–212, 1995. Rodger, A. S., Cowley, S. W. H., Brown, M. J., Pinnock, M., and
Simmons, D. A.: Dawn-dusk (y) component of the interplanetary magnetic field and the local time of the Harang discontinuity, Planet. Space. Sci., 32, 1021–1027, 1984.
Rostoker, G., Akasofu, S.-I., Baumjohann, W., Kamide, Y., and McPherron, R. L.: The roles of direct input of energy from the solar wind and unloading of stored magnetotail energy in driving magnetospheric substorms, Space Sci. Rev., 46, 93–111, 1987.
Russell, C. T. and McPherron, R. L.: Semiannual variation of geo-magnetic activity, J. Geophys. Res., 78, 92–108, 1973.
Schlegel, K.: Auroral zone E-region conductivities during solar minimum derived from EISCAT data, Ann. Geophys., 6, 129– 138, 1988,
http://www.ann-geophys.net/6/129/1988/.
Wang, H., L¨uhr, H., and Ma, S. Y.: Solar zenith angle and merging electric field control of field-aligned currents: A statistical study of the southern hemisphere, J. Geophys. Res., 110, A03306, doi:10.1029/2004JA010530, 2005a.
Wang, H., L¨uhr, H., Ma, S. Y., and Ritter, P.: Statistical study of the substorm onset: its dependence on solar wind parameters and solar illumination, Ann. Geophys., 23, 2069–2079, 2005b.