Dynamic-Stability Characteristics of
Premixed Methane Oxy-Combustion
The MIT Faculty has made this article openly available.
Please share
how this access benefits you. Your story matters.
Citation
Shroll, Andrew P., et al. “Dynamic-Stability Characteristics of
Premixed Methane Oxy-Combustion.” Proceedings of ASME Turbo
Expo 2011, 6-10 June, 2011, Vancouver, British Columbia, Canada,
ASME, 2011, pp. 681–93. © 2011 by ASME
As Published
http://dx.doi.org/10.1115/GT2011-45753
Publisher
ASME International
Version
Final published version
Citable link
http://hdl.handle.net/1721.1/119264
Terms of Use
Article is made available in accordance with the publisher's
policy and may be subject to US copyright law. Please refer to the
publisher's site for terms of use.
DYNAMIC-STABILITY CHARACTERISTICS OF PREMIXED METHANE OXY-COMBUSTION
Andrew P. Shroll, Santosh J. Shanbhogue and Ahmed F. Ghoniem
Center for Energy and Propulsion Research - RGD Labs Massachusetts Institute of Technology
Cambridge, Massachusetts 02139
ABSTRACT
This work explores the dynamic stability characteristics of premixed CH4/O2/CO2 mixtures in a 50kW swirl stabilized combustor. In all cases, the methane-oxygen mixture is stoichiometric, with different fractions of carbon dioxide used to control the flame temperature (Tad). For the highest Tad’s, the combustor is unstable at the five-quarter wave mode. As the temperature is reduced, the combustor jumps to the three quarter mode and then to the quarter wave before eventually reaching blowoff. Similar to the case of CH4/air mixtures, the transition from one mode to another is predominantly a function of the Tad of the reactive mixture, despite significant differences in laminar burning velocity and/or strained flame consumption speed between air and oxy-fuel mixtures for a given Tad. High speed images support this finding by revealing similar vortex breakdown modes and thus similar turbulent flame geometries that change as a function of flame temperature.
1. INTRODUCTION
Oxy-fuel combustion is a promising technology for the implementation of carbon capture in gas-turbine based power generation, offering low penalties on efficiency and cost [1]. Successful implementation of this technology requires addressing two challenges concerning the aerothermodynamic design of the combustor. First, the substitution of nitrogen with carbon dioxide as a diluent alters the thermodynamics, transport properties and relative importance of chemical pathways of the reacting mixture, impacting the flame temperature and stability of the combustion process. Second, as in air combustion, the flue gas stream must contain minimal emissions and trace gases, particularly carbon monoxide, nitric
oxide1 and, in the case of oxy-combustion, oxygen. These issues pose an even greater concern in the case of retrofit.
The broader objective of our effort is to explore the dynamic stability characteristics of oxy-combustion and to compare the characteristics of oxy-combustion and air combustion in order to develop predictive tools for combustor design and retrofit. For air combustion, the design involves a tradeoff between NOx emissions and combustor dynamics [2].
Although nitrogen oxide emissions are expected to be reduced significantly in oxy-fuel combustion, studying premixed flames in O2-CO2 mixtures remains of interest in obtaining
compact flames with easier temperature control and lowest CO, soot emissions and O2 in the products.
The premixed mode of combustion is susceptible to instabilities, which is a feedback process between combustion heat release and the acoustic field. There have been a number of reviews on this topic [3,4] that detail various mechanisms leading to instability and control strategies. However, there is a need for further studies to understand several remaining questions regarding, e.g., mode transitions – how the flow/combustion characteristics couple with a particular mode or its harmonics during any change in operating conditions such as loading, reactants, temperature and fuel characteristics. This paper presents experimental data on such transitions for oxy-fuel combustors.
a. A Brief Overview of Mode Transitions
In general, the transition in the stability characteristics of the combustor, from stable to unstable or from one mode to its
1Even when burning low nitrogen fuels such as natural gas in “pure”
oxygen, it is likely that the oxygen stream may still contain some nitrogen since producing “pure” oxygen requires significantly more energy than oxygen containing traces of nitrogen.
Proceedings of ASME Turbo Expo 2011 GT2011 June 6-10, 2011, Vancouver, British Columbia, Canada
harmonics, can be lumped into two categories. The first kind of transition occurs when the flame-stabilization mechanism changes for a small change in conditions – such as from a wake mode to a shear layer mode and vice-versa [5,6]. The second kind of transition involves the same mechanism, but the transition is due to the non-linearity associated with the physics of the problem. Some explanations for this behavior include non-normality [7], hysteresis [8] or the nature of the flame-acoustic describing-function [9].
Most of the above studies deal with a single fuel and the conditions used to initiate the transition involve changing either the equivalence ratio or flow speed. Our work has also looked at the effect of fuel structure and inlet reactant temperature. For oxy-combustion, fuel and air are expected to be in stoichiometric or near stoichiometric proportions, so it remains to be seen whether there is a fundamental property that can predict mode transitions. For natural gas-air mixtures, Fritsche and co-workers [10] proposed a Damköhler number that non-dimensionalizes the effect of flow velocity on mode transitions. Our research-group‟s prior work with synthesis-gas fuel blends showed that the transitions occur for critical values of a non-dimensional strained flame consumption speed [11,12]. We showed that, for a given equivalence ratio and flow velocity, changing the CO:H2 ratio of the fuel impacts the
stability characteristics and mode transition, although the variation in adiabatic flame temperature (Tad) is small. For a given equivalence ratio, changing the fuel composition from 80:20 H2:CO to 20:80 changes Tad by roughly 100K and drastically alters the stability of the combustor. However, such a change in stability cannot be reproduced if Tad is increased
for a fixed fuel composition by raising the equivalence ratio. It appears then that the key parameter that predicts the mode switch is another combustion property such as the consumption speed.
The prediction of mode-switching based on a strained flame consumption speed works well for hydrogen enriched mixtures. For such mixtures, the flame speed incorporates its fundamental characteristics such as high diffusivity and unique kinetics.
In this paper we explore whether such fundamental parameters exist for oxy-fuel mixtures. As such, the substitution of N2 with CO2 results in mixtures with different
diffusivities. Secondly, the overall reaction rate of CH4/O2/CO2 mixtures is much slower compared to CH4/O2/N2
mixtures primarily because of the competition for the H radical [13]. Law et al. [14] showed experimentally that methane flames, burning in oxygen-CO2 mixtures have
laminar burning velocities approximately one eighth of those burning in air when the oxygen mole fraction is kept at 21%.
The rest of the paper is organized as follows: Section 2 describes our experimental setup, instrumentation and diagnostics. In presenting the results, Section 3a first illustrates the differences between CH4/air and CH4/O2/CO2
flames based on computations using a 1-D counter-flow strained flame model. Section 3b presents base-line dynamic-stability characteristics for CH4/O2/CO2mixtures for a range of
flame temperatures. Section 3c compares these results to CH4/air mixtures for a range of Reynolds numbers. We
conclude with a brief overview of the non-linear behavior of the stability characteristics.
Figure 1. Model of axisymmetric swirl combustor.
2. EXPERIMENTAL SETUP
The combustor, shown in Figure 1, is designed to stabilize combustion using a combination of swirl and sudden expansion. Premixed CH4/O2/CO2 or premixed CH4/air enters
the combustor through a 38 mm diameter inlet pipe. The swirler is located 5 cm upstream of the expansion plane and has 8 blades with an estimated swirl number of 0.7 [15]. From the expansion plane downstream, the inner diameter is 76 mm. The first 40 cm downstream where the flame is anchored consists of a quartz tube for optical access. The overall acoustic length of the combustor (from the choke plate to the end of exhaust tube) is 4.5 m. The flow is choked upstream to prevent equivalence ratio oscillations and provide a known acoustic boundary condition.
Air, CO2, O2, and CH4 are each supplied using Sierra
Instruments mass flow controllers capable of supporting a
thermal power of 50 kW. The accuracy of each is +/- 2% of full scale, and an additional zero offset correction of 3.9 standard liters per minute of CH4 is used for the fuel mass
flow controller.
Two Kulite MIC-093 pressure transducers are used to record pressure oscillations 11 cm and 52 cm downstream of the choke plate at 10 kHz.
High speed images were recorded at 500 fps using a MEMRECAM GX-1 high speed camera fitted with a 50mm f/1.8 lens. A 2mm thick CG-BG-39 Schott-glass was placed in front of the camera to block out infrared radiation. The field of view in all the images starts at the dump plane of the combustor and extends about 22.8 cm downstream. Images were post-processed by normalizing the intensities in each image with the maximum intensity of the brightest image in an instability cycle. CO2 inlet Oxygen inlet Fuel bar Choke plate
Pressure sensors Expansion plane
Mass flow controllers
Exhaust Quartz tube
A custom Matlab code is used for control, data acquisition, and processing.
3. RESULTS
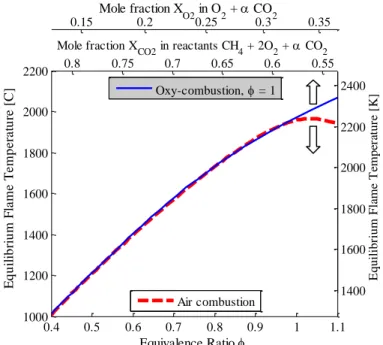
A useful reference for comparing oxy-combustion and air combustion is the adiabatic flame temperature. Although there is an extra degree of freedom in mixture composition by controlling the amount of diluent in oxy-combustion, near-stoichiometric conditions are desired to avoid any excess oxygen in the combustion products. Therefore in Figure 2 air combustion temperature is plotted versus equivalence ratio, and stoichiometric oxy-combustion temperature is plotted versus a reversed and shifted axis of diluent CO2 mole fraction
in the CH4/O2/CO2 mixture or O2 mole fraction in the O2/CO2
mixture to make comparisons convenient. To be clear, the reactant mixtures are CH4 + 2(O2 + 3.76 N2) for air and CH4
+ 2O2 + αCO2 for oxy-combustion, where and α are varied.
The adiabatic flame temperature given is the calculated equilibrium temperature for the reactant inlet temperature at 300 K. In this paper, the mole fraction of CO2 is defined as
the mole fraction in the reactant mixture, not the mole fraction in O2 plus CO2. The latter is the custom among the
coal-combustion community. For reference, however, the mole fraction of O2 in O2 plus CO2 is also shown.
Figure 2. Adiabatic flame temperature as a function of equivalence ratio for air combustion and of CO2 reactant mole fraction or O2 mole
fraction in O2 plus CO2 for oxy-combustion. a. Numerical Results
As was discussed in §1, the laminar burning velocity of CH4/O2/CO2 mixtures are one eighth of CH4/air mixtures for
an oxygen mole fraction of 21%. For these mixtures the oxy-combustion flame temperature is much lower due largely to the roughly 65% larger heat capacity of CO2 on a molar basis.
We are interested, however, in comparing flames at the same flame temperature, and the difference in burning velocity is still significant. Given that flames in turbulent flows are subjected to strains, our interest was in computing the strained consumption speed. This would tell us the mixture fractions of
CO2 for which the strain rates anticipated in experiments
exceed the extinction strain rates for oxy-fuel mixtures. A one-dimensional strained flame code is used to compute the consumption speed for varying strain rates. The laminar flame is stabilized in a planar stagnation flow and shown in Figure 3, where the opposed twin flame configuration allows extinction to occur at higher strain rates when the flames are pushed closer together. The resultant potential flow velocity field is characterized by the strain rate parameter a. The stretch rate of the planar flame under steady conditions is simply = a.
Governing equations for the flame structure are found by using a boundary layer approximation across the flame thickness. CHEMKIN and TRANSPORT libraries are used to evaluate chemical source terms and the various physical properties. A modified version of the GRI-Mech 3.0 kinetic model is used where the nitrogen-containing species have been removed except for N2 in the air cases. Radiation effects
are not considered in the model. Further details of the model can be found in Speth et al. [16].
The consumption speed Sc of the flame is defined as
(1) where q’’’ is the volumetric heat release rate, cp is the specific heat of the mixture, x is the coordinate normal to the flame, ρu is the unburned mixture density, and Tu and Tb are the unburned and burned temperature, respectively. Extrapolating the consumption speed to a strain rate of zero gives the laminar burning velocity.
Figure 3. Configuration of one-dimensional strained flame simulations. The consumption speed at a given strain rate for a mixture is the output of interest, and the differences between air and oxy-combustion are significant. Figure 4 shows consumption speeds for air and oxy-combustion at equal adiabatic flame temperatures of 1800 K, 2000 K and 2200 K. Here again we vary in air combustion and α in oxy-combustion to change
Tad. At 2200 K the consumption speed of the oxy-combustion flame is roughly half that of air. At lower temperatures the difference is more extreme, where oxy-combustion consumption speed is less than 5 cm/s, or one fourth that of air. Clearly the substitution of N2 with CO2 in the
oxy-combustion flames adversely affects the chemical and/or
0.4 0.5 0.6 0.7 0.8 0.9 1 1.1 1000 1200 1400 1600 1800 2000 2200 Equivalence Ratio E q u il ib ri u m F la m e T e m p e ra tu re [C] Air combustion 0.55 0.6 0.65 0.7 0.75 0.8 1400 1600 1800 2000 2200 2400 Mole fraction XCO2 in reactants CH4 + 2O2 + CO2
E qui li br ium F la m e T em pe ra tur e [K ] Oxy-combustion, = 1 0.15 0.2 0.25 0.3 0.35 Mole fraction X O2 in O2 + CO2 Products Stagnation Point Burning Velocity Reactants Reactants Flames
transport time scales. Because of these low flame speeds in oxy-combustion, proportionally larger flame areas should be required for wrinkled laminar flames, and long, weak flames are expected. However, images in the upcoming section on high speed video show a remarkable similarity with air combustion in not only flame structure but also flame size.
Also important in characterizing flame behavior is the condition at which extinction occurs. Two instances of extinction are shown in Figure 4 for oxy-combustion at 1800 K and 2000 K where the consumption speed drops to zero at strain rates of 200 s-1 and 700 s-1, respectively. Since strain rates on the order of 200 s-1 are expected in the experiments for similar conditions [11], sustainable oxy-combustion flames are not expected to exist at or below 1800 K. As will be shown though, experimental flame temperatures exist well below this value.
Figure 4. Comparison of consumption speed for air and oxy-combustion at 1800 K (█), 2000 K (█), and 2200 K (█). Instances where Sc drops to zero indicate extinction.
b. Dynamic Characteristics of Oxy-fuel Mixtures
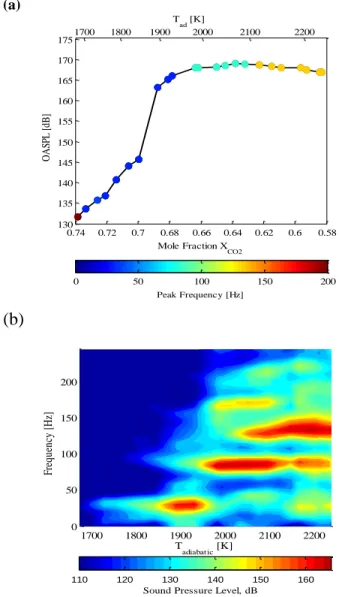
To understand the baseline stability characteristics of the combustor, consider Figure 5. This figure plots the Overall Sound Pressure Level (OASPL) as a function of equivalence ratio for a stoichiometric CH4/O2 mixtures at Re = 20,000 for
different amounts of CO2 dilution. The OASPL measurements
are taken using the transducer placed just upstream of the expansion plane. In this figure as well other OASPL plots throughout the paper, the symbols have been colored based on the frequency of the instability.
For low dilution levels (Tad = 2230 K), the flame is very compact and the sound pressure levels exceed 160 dB. The dominant instability frequency2 is 132 Hz, which corresponds to the five-quarter wave mode of the combustor. High speed flame images for this mode show that the flow oscillates between a double-helix type vortex breakdown (Figure 6b) and a configuration in which it flashes back (between Figure 6c and d).
As the dilution levels are increased, the combustor remains unstable at roughly the same amplitude, though the
2
These acoustic model used for computing these frequencies in this combustor has been documented in earlier works, see Speth et. al. [12]
contribution of the five-quarter wave mode to the OASPL decreases and the three-quarter wave mode (83 Hz) increases.
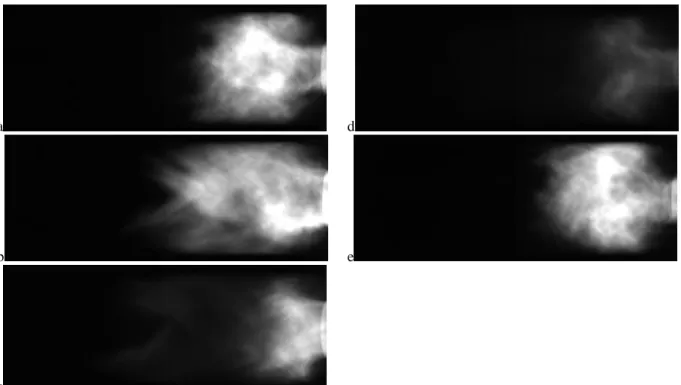
At χCO2 = 0.63 (Tad = 2100 K) the combustor abruptly transitions to the three-quarter wave mode while maintaining the same limit-cyle amplitude. High speed images for this condition indicate that the flow-structures are now different, with the flow structures switching between a double-helix type (Figure 7a,b,f) and a spiral type breakdown (Figure 7d,e) during the instability cycle.
As the dilution levels were increased from χCO2 = 0.63
(Tad = 2100 K) to χCO2 = 0.67 (Tad = 1970 K), the flame lengths increase commensurate with what is expected for decreasing flame temperatures. The flame dynamics are controlled by the fluid-mechanics of the inner recirculation zone as was reported in our previous work on propane-air mixtures [15].
(a)
(b)
Figure 5: (a) OASPL and (b) spectrum of oscillations as a function of adiabatic flame temperature for CH4/O2/CO2 mixtures at Re = 20,000.
The next abrupt transition is seen at χCO2 = 0.67 (Tad = 1970 K) where the instability jumps from the three-quarter wave mode to the quarter wave mode with a slightly lower limit-cycle amplitude. For this case though, there is a step jump in flame length (Figure 8). This mode persists until χCO2
0 200 400 600 800 1000 0 0.05 0.1 0.15 0.2 0.25 0.3 0.35 Strain Rate, a [1/s] C ons um pt ion S pe e d, S c [ m /s ] Air Combustion Oxy-Combustion 0.58 0.6 0.62 0.64 0.66 0.68 0.7 0.72 0.74 130 135 140 145 150 155 160 165 170 175 O A SP L [d B] Mole Fraction X CO2 Peak Frequency [Hz] 0 50 100 150 200 1700 1800 1900 2000 2100 2200 T ad [K] 1700 1800 1900 2000 2100 2200 0 50 100 150 200 Fre qu en cy [H z] T adiabat ic [K]
Sound Pressure Level, dB
= 0.7 (Tad = 1850 K) when the flame switches to a columnar type, similar to the ones reported by Zhang et al. [17] and Muruganandam et al. [18], indicating incomplete combustion. No instability is observed in the frequency-spectra for these cases.
a d
b e
c
Figure 6: Sequence of images in a cycle during the five-quarter wave mode for CH4/O2/CO2 flames with XCO2 = 0.594 (Tad = 2200 K) at Re = 20,000. Images are 2ms apart.
a d
b e
c f
Figure 7: Sequence of images in a cycle during the three-quarter wave mode for CH4/O2/CO2 flames with XCO2 = 0.659 (Tad = 2000 K) at Re = 20,000. Images are 2ms apart.
a d
b e
c f
Figure 8: Sequence of images in a cycle during the quarter wave mode for CH4/O2/CO2 flames with XCO2 = 0.686 (Tad = 1900 K) at Re = 20,000. Images are 8ms apart.
So far the results were plotted as a function of adiabatic flame temperature in the 1700-2200 K range. This is the temperature range that can be expected when burning methane air mixtures between the lower flammability limit and the stoichiometric limit. Now, consider the flame speeds for these two mixtures: If the dilution is adjusted to get Tad = 2050K in a CH4/O2/CO2 mixture (conditions matching Figure 7), the
computed laminar burning velocity is 10 cm/s. For CH4/air
mixtures, this flame speed value is well below the flame speed at the flammability limit, namely 15 cm/s. It is surprising then that a reasonably compact flame is observed for these conditions.
c. Comparisons with CH4/Air Flames
OASPL curves similar to the one plotted in Figure 5 are plotted in Figure 9 for CH4/air mixtures at the same Reynolds
number, i.e. 20,000. The results indicate that the dynamic response of the combustor is essentially similar to that presented in §3b for oxy-fueled mixtures in two ways. First, as the adiabatic flame temperature is decreased (in this case by turning down the equivalence ratio), the instability modes transition from the five-quarter wave mode to three-quarter to the quarter wave mode before eventually blowing off.
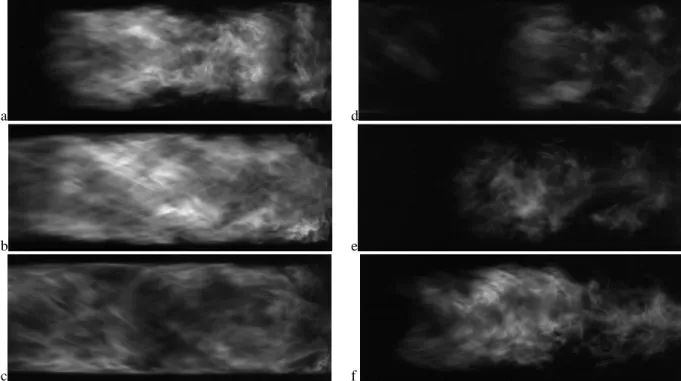
The second similarity is in the overall turbulent flame structure. For this consider Figure 10 and Figure 11. The
adiabatic flame temperature and Reynolds number for these cases have been adjusted to match the conditions in Figure 7 and Figure 8 respectively. Looking at these figures side by side, the visible turbulent flame shapes are very similar as is the underlying vortex breakdown mode. These results suggest that the underlying flow-field is a strong function of the temperature jump across the flame. Some subtle differences exist – for instance, in Figure 11a,b&g (CH4/air), a “waist” is
seen between the bubble upstream and the double-helix downstream. This structure is a bit weak in Figure 8a (CH4/O2/CO2). Since the mass flow rates are nearly the same,
differences in flame speed would lead the oxy-flame to bulge laterally to a larger volume to burn the same mass.
We note that for a given Reynolds number and adiabatic flame temperature, the power output of oxy-combustion is lower. For example, at Re = 20,000 and Tad = 1800 K, the fuel flow rate for oxy-combustion is 0.37 g/s, while the fuel flow rate is 0.44 g/s for air. Likewise, the total mass flow rate and mean inlet velocity are lower for oxy-combustion at 9.4 g/s and 5.2 m/s versus 10.8 g/s and 8.0 m/s for air. Still, the mode transitions and flame geometries are clearly controlled by the flame temperature at a given Reynolds number, at least to the first order.
(a)
(b)
Figure 9: (a) OASPL and (b) spectrum of oscillations as a function of adiabatic flame temperature for CH4/air mixtures at Re = 20,000.
a d
b e
c f
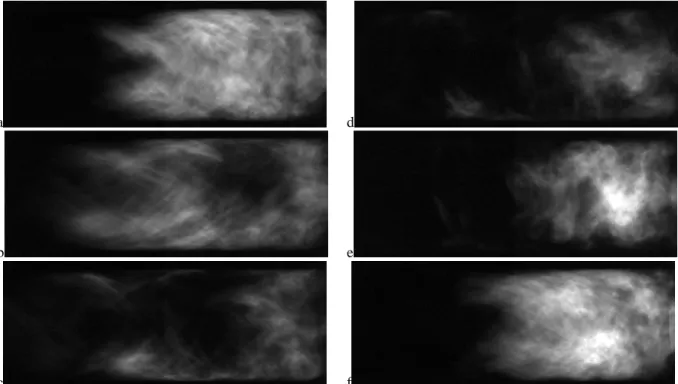
Figure 10: Sequence of images (images are 2ms apart) in a cycle during the three quarter wave mode for CH4/air flames for = 0.798
(Tad = 2000K) and Re = 20,000. The conditions were chosen to match those in Figure 7.
0.6 0.65 0.7 0.75 0.8 0.85 0.9 0.95 1 135 140 145 150 155 160 165 170 175 O A SP L [d B] Equivalence Ratio 1700 1800 1900 2000 2100 2200 T ad [K] Peak Frequency [Hz] 0 50 100 150 200 1700 1800 1900 2000 2100 0 50 100 150 200 Fre qu en cy [H z] T adiabat ic [K]
Sound Pressure Level, dB
110 120 130 140 150 160
a
e
b
f
c
g
d
Figure 11: Sequence of images (images are 4ms apart) in a cycle during the quarter wave mode for CH4/air flames for = 0.734 (Tad = 1900K) and Re = 20,000. The conditions were chosen to match those in Figure 8.
OASPL comparisons between air combustion, in which we vary the equivalence ratio, and stoichiometric oxy-combustion, in which we vary the CO2 mole fraction, for
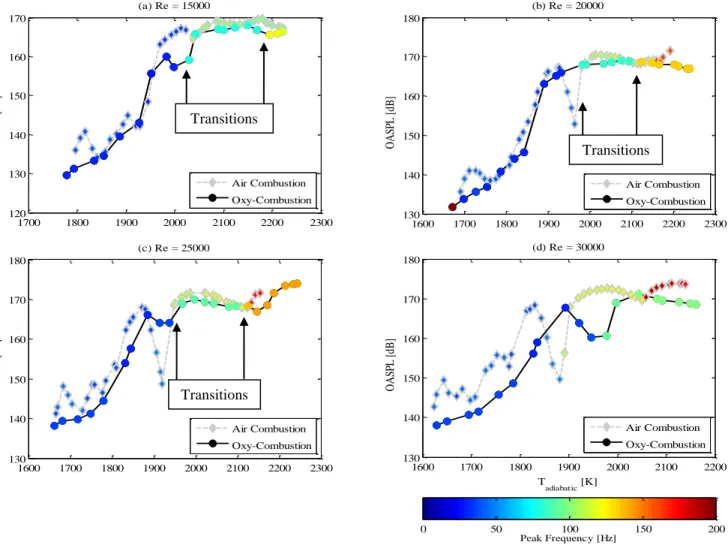
constant Reynolds numbers from 15,000 to 30,000 are shown in Figure 12. The equivalence ratio is maintained at unity in all the oxy-combustion tests. Each curve represents one test sequence in the combustor from ignition at the high temperature end toward blowout at the lower end. Because the mixtures are varied in different ways between the air and oxy-combustion cases, and the findings presented in the earlier section, the adiabatic flame temperature for the given mixture is used as the abscissa. Small gradients in color from point to point show mild frequency shifts (as the burnt gas temperature decreases w.r.t the reactants; this is expected, see Speth [12]). While weaker flames were expected in oxy-combustion, because of the significant change in the consumption speed [12], surprisingly, similar dynamic modes and transitions seen in air combustion are seen in oxy-combustion. With the exception of Re = 30,000, mode transitions collapse well when using the adiabatic flame temperature across the two combustion modes. At Re = 25,000, for instance, there is one clear transition at Tad = 2100 K from the five-quarter mode to the three-quarter mode and another at Tad = 1950 K from the three-quarter mode to the quarter-wave mode.
Strongest instabilities, those over 165 dB, exist at higher flame temperatures where a compact unstable flame exists in 3/4 or coexisting 3/4 and 5/4 wave modes. These peak frequencies are shown in Figure 13 and Figure 14 that plot the
frequency spectrum (truncated up to 250 Hz) as a function of the adiabatic flame temperature. The right and left edges of each plot are simply the condition at which data recording begins and the condition at blowout, respectively, so there is variation between plots. In oxy-combustion, the dominant frequencies for the high, medium, and low frequency modes are in the ranges of 125-150 Hz, 80-100 Hz, and 25-40 Hz, respectively. Frequencies for the three modes are shifted higher for air to 150-170 Hz, 100-120 Hz, and 30-50 Hz. Presumably the shift is due to the differences in acoustic properties of the products and reactants between air and oxy-combustion. While the quarter wave mode exists alone in all cases, the three-quarter and five-quarter wave modes coexist in an overlap region. The five-quarter wave mode is dominant at the highest temperatures. The temperature range where modes coexist diminishes with increasing Reynolds number.
As the flame temperature is decreased by changing the mixture composition, transitions occur to lower harmonics. In some cases, namely air combustion at all Reynolds numbers except for 15000, a „hole‟ exists (e.g. between Tad = 1930 K and 1980 K for Re = 20,000) in this transition where the flame is considerably more stable. The sound pressure levels for these conditions are much lower for air flames compared to oxy-flames. The reason for this is not entirely clear, but is the subject of current investigation.
Regardless of whether the fuel is burned in air or in O2/CO2, the low frequency (quarter-wave) unstable flames are
also note that a stable columnar flame that extends well into the exhaust is seen at the lowest temperatures for all Reynolds numbers before blowoff where the OASPL drops off significantly.
Figure 12. OASPL as a function of adiabatic flame temperature. (a) Re = 15,000; (b) Re = 20,000; (c) Re = 25,000; (d) Re = 30,000.
1700 1800 1900 2000 2100 2200 2300 120 130 140 150 160 170 O A SP L [d B] (a) Re = 15000 Air Combustion Oxy-Combustion 1600 1700 1800 1900 2000 2100 2200 2300 130 140 150 160 170 180 O A SP L [d B] (b) Re = 20000 Air Combustion Oxy-Combustion 1600 1700 1800 1900 2000 2100 2200 2300 130 140 150 160 170 180 O A SP L [d B] (c) Re = 25000 Air Combustion Oxy-Combustion 1600 1700 1800 1900 2000 2100 2200 130 140 150 160 170 180 O A SP L [d B] T adiabat ic [K] (d) Re = 30000 Air Combustion Oxy-Combustion Peak Frequency [Hz] 0 50 100 150 200 Transitions Transitions Transitions Transitions
Figure 13. Sound pressure level spectrum maps as a function of adiabatic flame temperature for stoichiometric oxy-combustion at different Reynolds numbers.
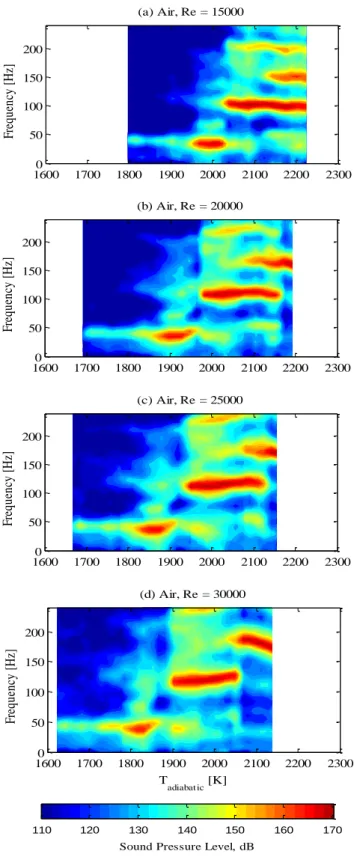
Figure 14. Sound pressure level spectrum maps as a function of adiabatic flame temperature for air combustion at different Reynolds numbers.
d. Hysteresis in Mode Transition
For the all the cases presented so far, the experiments were conducted by igniting the mixture at high equivalence ratios or high O2 fraction and then gradually lowering it until
blowoff. Results collected in this case indicate that there are two distinct transitions – a transition from the ¾ to ¼ wave
Fre qu en cy [H z] (a) Oxy, Re = 15000 16000 1700 1800 1900 2000 2100 2200 2300 50 100 150 200 Fre qu en cy [H z] (b) Oxy, Re = 20000 16000 1700 1800 1900 2000 2100 2200 2300 50 100 150 200 Fre qu en cy [H z] (c) Oxy, Re = 25000 16000 1700 1800 1900 2000 2100 2200 2300 50 100 150 200 Fre qu en cy [H z] (d) Oxy, Re = 30000 T adiabat ic [K] 16000 1700 1800 1900 2000 2100 2200 2300 50 100 150 200
Sound Pressure Level, dB
110 120 130 140 150 160 Fre qu en cy [H z] (a) Air, Re = 15000 1600 1700 1800 1900 2000 2100 2200 2300 0 50 100 150 200 Fre qu en cy [H z] (b) Air, Re = 20000 16000 1700 1800 1900 2000 2100 2200 2300 50 100 150 200 Fre qu en cy [H z] (c) Air, Re = 25000 16000 1700 1800 1900 2000 2100 2200 2300 50 100 150 200 Fre qu en cy [H z] (d) Air, Re = 30000 T adiabat ic [K] 1600 1700 1800 1900 2000 2100 2200 2300 0 50 100 150 200
Sound Pressure Level, dB
mode at high temperatures, and another from the ¼ wave mode to stable case at lower temperatures close to blowoff.
Now, consider results from experiments conducted in the reverse order – by increasing the equivalence ratio or O2
concentration (and hence the temperature) gradually until stoichiometry. This data is illustrated in Figure 15(a) for air and Figure 15(b) for oxy-fuel mixtures. This figure shows that the instability at the ¼ wave mode persists for much higher flame temperatures before transitioning to the ¾ wave mode, if the experiments are conducted by increasing the adiabatic flame temperature.
Figure 15. Demonstration of hysteresis by comparing experiments where the mixture adiabatic flame temperature is increased to previously shown tests for decreasing temperature at Re = 20,000.
These data suggest that mode transition depends on whether the combustor loading is increased or decreased, that is, it depends on the state and the history. At this point we were interested in determining whether the transitions depend on the temperature pathway or are function of the pathway followed by some other state variable. For this purpose, another experiment was conducted; this time we ignited the
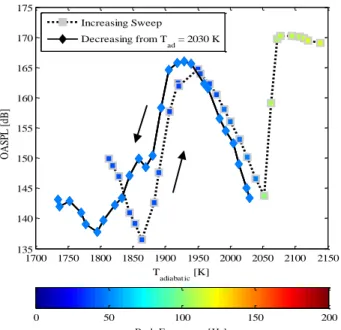
combustor and immediately switched to Tad = 2030 K. According to Figure 9, at this point the combustor should be in the ¾ wave mode as per the decreasing temperature path; but just at the border of the transition between the ¼ to ¾ wave mode as per the increasing temperature path. Once ignited the equivalence ratio was then gradually decreased. The trajectory of the limit cycle amplitude as a function of the temperature is illustrated in Figure 16. The figure shows that despite the decreasing temperature, the trajectory followed by the amplitude overlaps with the trajectory obtained as if the temperature was increased. This proves that the hysteresis in mode transitions is not just a function of temperature (and thus independent of the types of mixtures being burnt). At present tests are being conducted to identify a state variable that controls the hysteresis, but so far the data suggests that this is dependent on the instability frequency the combustor is in just prior to the point when the temperature is increased or decreased.
We should also note that the trajectories (and consequently the blowoff limits) deviate below Tad = 1940 K. This is in turn due to the hysteresis of the ¼ wave mode w.r.t. to the stable mode. Stated differently, if the combustor is ignited and suddenly brought to Tad = 1810K, the combustor is observed to be stable. The temperature has to be increased to
Tad = 1890K to “kick” it into the ¼ wave mode. However if the combustor is brought to Tad = 1890K slowly from higher temperatures when the ¼ wave mode is present, the same mode persists until lower temperatures.
Figure 16: Mode history dependency for air combustion at Re = 20,000. For the decreasing sweep, tests were conducted by igniting the combustor at Tad = 2030 K and then decreasing gradually.
Considering the effects of the hysteresis, the data that was presented throughout this paper was recorded by increasing the flame temperature after ignition until the combustor is “kicked” into the five-quarter mode, and then decreasing the temperature gradually. For CH4/Air mixtures, one could argue
that this is guaranteed by always starting at stoichiometric conditions and then decreasing the temperature. However, for CH4/O2/CO2 mixtures, the maximum temperature that can be
1600 1700 1800 1900 2000 2100 2200 135 140 145 150 155 160 165 170 175 O A SP L [d B] (a) Air, Re = 20000 Increasing Sweep Decreasing Sweep 1600 1700 1800 1900 2000 2100 2200 2300 130 135 140 145 150 155 160 165 170 O A SP L [d B] T adiabat ic [K] (b) Oxy, Re = 20000 Increasing Sweep Decreasing Sweep Peak Frequency [Hz] 0 50 100 150 200 1700 1750 1800 1850 1900 1950 2000 2050 2100 2150 135 140 145 150 155 160 165 170 175 O A SP L [d B] T adiabat ic [K] Increasing Sweep Decreasing from T ad = 2030 K Peak Frequency [Hz] 0 50 100 150 200
attained is Tad = 3051K; but this was not possible given the temperature limitations of our combustor. Hence the amount of dilution in the flow was reduced just enough to trigger the five-quarter wave mode.
Finally, note that for both air and oxy-combustion the shift in transition temperature between the 1/4 and 3/4 from hysteresis is on the order of 50 K. However, the quiet transition region between the 1/4 and 3/4 unstable modes is extended for air combustion and introduced for oxy-combustion. That is, a significantly more stable flame can be achieved at 2000 K for oxy-combustion by approaching the corresponding mixture composition while in the low frequency mode. As a result, the space of operation where the sound pressure level is over 165 dB is significantly decreased for the increasing sweeps. Making use of phenomena such as this could be exploited as an operation strategy for gas turbines.
4. CONCLUSIONS
In this paper we compared the combustion dynamics characteristics of CH4/O2/CO2 mixtures and CH4/Air mixtures
in a swirl stabilized combustor. Although weaker flames are expected in oxy-combustion due to lower consumption speed, the flame structures of air and O2/CO2 flames in each of the
modes are similar. The transitions from one instability mode to another are shown to be a function of the mixture adiabatic flame temperature for Re ≤ 25,000. The data match less well for Re = 30,000; the reasons for this are currently being investigated. It is not clear whether the discrepancy is due to the acoustics or is due to the turbulent nature of the flame at these high Reynolds numbers. Efforts are underway to obtain PLIF data for these conditions that may shed some light on the mismatch.
The data also reveal hysteresis w.r.t mode transitions, which are shown to be mode-dependent and not temperature dependent. This fact could be exploited for developing control strategies to avoid a particular mode of instability.
ACKNOWLEDGEMENTS
This work is supported by King Abdullah University of Science and Technology grant number KSU-I1-010-01.
REFERENCES
[1] Kvamsdal, H.M., Jordal, K., and Bolland, O. “A quantitative comparison of gas turbine cycles with CO2 capture.” Energy 32, no. 1. (2007): 10-24.
[2] Correa, S.M. “Power generation and aeropropulsion gas turbines: From combustion science to combustion
technology.” Symposium (International) on Combustion 2 (1998): 1793-1807.
[3] Lieuwen, T. C. and Yang, V., (ed.), “Combustion
Instabilities in Gas-Turbine Engines.” Progress in Aeronautics
and Astronautics (2005): Vol. 210 ISBN 1-56347-669-X.
[
4]
Huang, Y. and Yang, V. “Dynamics and stability of lean-premixed swirl-stabilized combustion.” Progress in Energyand Combustion Science 35, no. 4 (2009): 293-364.
[
5]
Kaskan, W. E. and Noreen, A. E., “High Frequency Oscillations of a Flame Held by a Bluff-Body.” ASMETransactions (1954): 77, 885-895.
[6] Ghoniem, A.F., Annaswamy, A. M., Wee, D., Yi, T. and Park, S. “Shear Flow Driven combustion instability: Evidence, simulation and modeling.” Proceedings of the
Combustion Institute 29, no. 1 (2002): 53-60.
[7] Nagaraja, S., Kedia, K., and Sujith, R.I. “Characterizing energy growth during combustion instabilities: Singularvalues or eigenvalues?” Proceedings of the Combustion Institute 32 (2009): 2933-2940.
[8] Lieuwen, T.C. and Zinn, B. T., “Experimental
Investigation of Limit Cycle Oscillations in an Unstable Gas Turbine Combustor.” 38th
AIAA Aerospace Sciences Meeting and Exhibit (2000): AIAA-2000-0707.
[9] Noiray, N., Durox, D., Schuller, T., and Candel, S. “A unified framework for nonlinear combustion instability analysis based on the flame describing function.” Journal of
Fluid Mechanics 615 (2008): 139-167.
[10] Fritsche, D., Furi, M., and Boulouchos, K. “An
experimental investigation of thermoacoustic instabilities in a premixed swirl-stabilized flame.” Combustion and Flame 151, no. 1 (2007): 29-36.
[11] Speth, R.L., and Ghoniem, A.F. “Using a strained flame model to collapse dynamic mode data in a swirl-stabilized syngas combustor.” Proceedings of the Combustion Institute 32 (2009): 2993-3000.
[12] Ghoniem, A.F., Speth, R.L., Altay, H.M., and Hudgins, D.E. “Dynamics and stability limits of syngas combustion in a swirl-stabilized combustor.” Proceedings of the ASME Turbo
Expo. (2008): 767-776.
[13] Liu, F., Guo, H., and Smallwood, G.J. “The chemical effect of CO2 replacement of N2 in air on the burning velocity of CH4 and H2 premixed flames.” Combustion and Flame 133, no. 4 (2003): 495-497.
[
14]
Zhu, D.L., Egolfopoulos, F.N., and Law, C.K.“Experimental and numerical determination of laminar flame speeds of methane/(Ar, N2, CO2)-air mixtures as function of stoichiometry, pressure, and flame temperature.” Symposium
(International) on Combustion 22, no. 1 (1989): 1537-1545.
[15] LaBry, Z. A., Shanbhogue, S. J., Speth, R. L. and Ghoniem, A. F., “Flow structures in a lean-premixed swirl-stabilized combustor with microjet air injection.” Proceedings
of the combustion institute 33 (2010):
doi:10.1016/j.proci.2010.06.092.
[16] Speth, R. L., Marzouk, Y. M. and Ghoniem, A. F., “Impact of Hydrogen Addition on Flame Response to Stretch and Curvature.” 43rd AIAA Aerospace Sciences Meeting (2005): Paper number AIAA-2005-143.
[17] Zhang. Q., Noble, D. R., Shanbhogue, S. J. and Lieuwen, T. C., "Impacts of Hydrogen Addition on near-Blowout
Dynamics in a Swirling Combustor.", ASME Turbo-Expo (2007): Paper Number GT2007-27308.
[18] Muruganandam, T.M. and Seitzman, J.M.
“Characterization of extinction events near blowout in swirl-dump combustors.” 41st AIAA/ASME/SAE/ASEE Joint