HAL Id: insu-00611543
https://hal-insu.archives-ouvertes.fr/insu-00611543
Submitted on 29 Jun 2016
HAL is a multi-disciplinary open access
archive for the deposit and dissemination of
sci-entific research documents, whether they are
pub-lished or not. The documents may come from
teaching and research institutions in France or
abroad, or from public or private research centers.
L’archive ouverte pluridisciplinaire HAL, est
destinée au dépôt et à la diffusion de documents
scientifiques de niveau recherche, publiés ou non,
émanant des établissements d’enseignement et de
recherche français ou étrangers, des laboratoires
publics ou privés.
of the Abancay deflection in the Andes of southern Peru
Pierrick Roperch, Victor Carlotto, Gilles Ruffet, Michel Fornari
To cite this version:
Pierrick Roperch, Victor Carlotto, Gilles Ruffet, Michel Fornari. Tectonic rotations and transcurrent
deformation south of the Abancay deflection in the Andes of southern Peru. Tectonics, American
Geophysical Union (AGU), 2011, 30 (2), pp.TC2010. �10.1029/2010TC002725�. �insu-00611543�
Tectonic rotations and transcurrent deformation south
of the Abancay deflection in the Andes of southern Peru
Pierrick Roperch,
1Victor Carlotto,
2,3Gilles Ruffet,
4and Michel Fornari
5Received 14 April 2010; revised 2 January 2011; accepted 11 January 2011; published 8 April 2011.
[1]
We report new paleomagnetic results from 55 out of 76 sites sampled at different
localities along a transect from Nazca to Cuzco where the general structures of the
Peruvian Andes are strongly offset across the Abancay deflection. Nine new
39Ar/
40Ar
ages better constrain the timing of volcanism along the western edge of the Western
Cordillera at the latitude of Nazca. A mean paleomagnetic result from 22 sites in the lower
Miocene volcanics does not show significant rotation (R =
−2.3° ± 7.7°) of the western
margin of the Central Andean Plateau since the early Miocene. Within the Western
Cordillera we sampled three structural blocks bounded to the north by the Abancay fault
system. In the westernmost block, a large counterclockwise rotation (R =
−65.0° ± 11.1°)
is found in Mesozoic limestones and Paleocene
‐Eocene red beds. Magnitude of rotation
decreases toward the east from (R =
−35.6° ± 12.8°) in the central block to (R = −4.5° ± 8.4°)
south of the town of Cuzco. The anisotropy of magnetic susceptibility (AMS) recorded
by the red beds sediments is the consequence of compaction and tectonic strain during the
early stages of deformation. We show that the magnetic lineations were also rotated
counterclockwise as the remanent magnetizations. The present study confirms results from
the Peruvian fore arc, showing that rotations are not older than circa 40 Ma and likely
not younger than circa 20 Ma. The spatial variation in the amount of counterclockwise
rotation suggests a large component of shear along the Abancay deflection concomitant
with a broad late Eocene
–Oligocene oroclinal deformation in southern Peru.
Citation: Roperch, P., V. Carlotto, G. Ruffet, and M. Fornari (2011), Tectonic rotations and transcurrent deformation south of the Abancay deflection in the Andes of southern Peru, Tectonics, 30, TC2010, doi:10.1029/2010TC002725.
1.
Introduction
[2] Building of the Andes in Peru is traditionally ascribed
to two major phases of deformation (Incaic and Quechua), each phase subdivided into short pulses of compressive deformation separated by period of tectonic quiescence [Steinmann, 1929; Noble et al., 1979a; Mégard, 1978, 1984; Mégard et al., 1984; Sébrier and Soler, 1991; Benavides‐ Cáceres, 1999]. The Incaic deformation in Peru is inter-preted as a sequence of compressive episodes (Incaic I (59–55 Ma), Incaic II (43–42 Ma), Incaic III (30–27 Ma), and Incaic IV (22 Ma)). The Incaic I and II phases are rec-ognized in central Peru and expressed within the Incaic fold and thrust belt between the Coastal block and the Eastern Cordillera [Noble et al., 1990]. In contrast with the view of short pulses of deformation characterizing the geodynamic evolution of central Peru, there is no evidence for Cenozoic
tectonic “phases” in Bolivia [Sempere, 1991]. The sedi-mentary record in several Andean syntectonic basins did not support the division in short pulses of deformation [Noblet et al., 1996]. An apparent more continuous period of com-pressive deformation during the late Eocene–early Miocene is proposed for the southern Bolivian Andes [Oncken et al., 2006] and in the Cuzco Region [Carlotto, 1998; Carlotto et al., 1999]. During the Mesozoic and the Tertiary, there are several differences in the paleogeographic evolution of the Andes of central and southern Peru that are separated by a major E‐W discontinuity (the Abancay deflection, Figure 1) [Carlotto et al., 2009]. South of the Abancay deflection, a wide magmatic arc was emplaced during the middle‐late Eocene–early Oligocene (∼48–30 Ma) [Perello et al., 2003], and James and Sacks [1999] speculated that its location hundreds of kilometers to the east of the Paleocene arc was a consequence of flat slab subduction below southern Peru. The Abancay deflection is also presently in front of the Nazca ridge that limits the southern edge of the flat slab segment below central Peru.
[3] Since the early work of Heki et al. [1985] and Kono
et al. [1985], subsequent paleomagnetic studies have con-firmed that counterclockwise rotations is a main character-istic of the geodynamic evolution of the Peruvian Andes. The rotations were observed from northern [Mitouard et al., 1992], central [Macedo‐Sánchez et al., 1992a, 1992b], to
1
IRD, LMTG, and Géosciences Rennes, Rennes, France.
2
INGEMMET, San Borja, Lima, Peru.
3
UNSAAC, Cuzco, Peru.
4
Géosciences Rennes, Université de Rennes 1, CNRS, Rennes, France.
5Géosciences Azur, Université de Nice‐Sophia Antipolis, CNRS, IRD,
Nice, France.
Copyright 2011 by the American Geophysical Union. 0278‐7407/11/2010TC002725
southern Peru [Roperch and Carlier, 1992]. Timing of these rotations with respect to successive pulses of compressive deformation was however controversial for southern Peru. Roperch and Carlier [1992] sampled mainly the coastal Jurassic and Cretaceous arc from southern Peru and found large rotations. Gilder et al. [2003] sampled Permian and Jurassic rocks in the Eastern Cordillera of southern Peru and the large rotations were interpreted to be post middle Oli-gocene in age. Rotations in the Eastern Cordillera come from sites near or within major fault system with complex deformation and they are likely not associated with large‐
scale bending. Rousse et al. [2003] suggested that most of the rotations in central Peru occurred during the late Miocene in relation with the subduction of the Nazca ridge. Counterclockwise rotations >40° were recorded in nearly flat‐lying upper Paleogene sediments from the Moquegua group along the fore arc from Arequipa to Caravelli‐Chala [Roperch et al., 2006]. The fact that the upper Oligocene and lower Miocene ignimbrites do not show evidence of significant rotation led Roperch et al. [2006] to propose a global oroclinal bending of the southern Peruvian margin mainly during the late Eocene–Oligocene. A summary of the Figure 1. Simplified geological map from Peru (modified from the 1/1,000,000 Peruvian map from
INGEMMET; modified from Roperch et al. [2006]. Indicated on map are, as labeled on color legend, a, Precambrian rocks; b, Paleozoic strata; c, Paleozoic intrusive rocks; d, Mesozoic sediments and volcanics; e and f, Cretaceous intrusive rocks; g, Tertiary sediments and volcanics; h, Tertiary intrusive rocks; and i, Plio‐Quaternary cover. More detailed maps are shown in Figures 2, 3, and 4. Paleomagnetic sampling of the principal previous published studies are shown in small circles (1, Macedo‐Sánchez et al. [1992a, 1992b]; 2, Rousse et al. [2003]; 3, Gilder et al. [2003]; 4, Roperch and Carlier [1992] and Roperch et al. [2006]; 5, Paquereau‐Lebti et al. [2008]; 6, Rousse et al. [2002]; and 7, Rousse et al. [2005]. The white square with green stroke corresponds to the location of the Ocros dike swarm of Heki et al. [1985]. The large red circles (circles labeled 8) correspond to the present study, and their precise locations are given in the auxiliary material. The dashed line is the northern boundary of the Arequipa domain identified by the geochemical data [Mamani et al., 2008]. The two Altiplano blocks proposed by Carlier et al. [2005] are highlighted with different shades of gray.
tectonic rotations in southern Peru is given by Roperch et al. [2006].
[4] Assuming that rotations are essentially driven by
oroclinal bending associated with shortening in the Eastern Cordillera and in the Subandean belt, Arriagada et al. [2008] proposed that the total amount of shortening across the central Andes is significantly greater than shortening estimated from balanced cross sections, and they suggested a major phase of oroclinal bending associated with a broad Incaic phase of deformation. The rotations are however even larger than those driven by pure shortening and rotations are likely enhanced locally by major deflections like the Abancay deflection where the main Andean morphotectonic features are sinistrally displaced.
[5] This study reports paleomagnetic results obtained in
the region between the main towns of Nazca and Cuzco (Figure 1). The study area corresponds to the location of the northern end of the Altiplano and to the transition zone with the central Peruvian Andes. In the Cuzco area, the Eastern Cordillera is also strongly deflected toward the east with a complex deformation as shown by the curved fold and thrust system associated with the Manu Indenter (Figure 1).
[6] In the companion paper, Roperch et al. [2010] report
paleomagnetic results from the Eocene‐Oligocene red bed sequence close to Cuzco and propose the use of Anisotropy of Magnetic Susceptibility (AMS) to constrain tilt correction applied to the paleomagnetic data. Results from this paper are integrated in the present study to discuss the timing and geodynamic evolution of the Andes of southern Peru.
2.
Geological Setting
2.1. Regional Overview
[7] Southern Peru corresponds to the northwest limb of
the Bolivian orocline, which is commonly divided into distinct geomorphic zones (Figure 1). The Paleozoic base-ment is mainly observed across the Eastern Cordillera. The Jurassic and Cretaceous magmatic arc form well developed belts along the fore arc of Peru. In southern Peru, fore‐arc basins are filled with Cenozoic sedimentary deposits of the Moquegua group partially covered by large sheets of late Oligocene–early Miocene ignimbrites [Roperch et al., 2006]. Several active volcanoes delineate the present‐day volcanic arc. In contrast with the central Bolivian orocline character-ized by a narrow high elevation Western Cordillera and a wide Altiplano, the Peruvian Altiplano progressively dis-appears to the northeast and is replaced by a wide Western Cordillera that has been the locus of active calc‐alkaline magmatism since the middle Eocene (Anta arc [Mamani et al., 2010]).
[8] The Andahuaylas‐Yauri batholith is the main intrusive
unit with at least three phases of emplacement broadly dated between 48 and 32 Ma [Bonhomme and Carlier, 1990; Carlier et al., 1996; Carlotto, 1998], the first one charac-terized by calc‐alkaline gabbro and diorite being the most important in volume. The second stage characterized by quartz diorite and granodiorite was followed by subvolcanic
intrusions associated to late Eocene–early Oligocene Cu‐Fe skarns [Perello et al., 2003]. During the late Oligocene, ignimbrite emplacement along the present‐day arc position was associated with the back‐arc eruption of the Tacaza mafic lavas and related rocks [Mamani et al., 2010]. Such a mafic volcanism appears to have migrated toward the Bolivian Altiplano during the late Oligocene–early Miocene [Fornari et al., 2002].
[9] A thick continental crust characterizes all the area
and recent geochemistry studies have highlighted different crustal domains in the Andes of southern Peru. A major geochemical E‐W boundary delineates the northern limit of the Precambrian Arequipa block [Mamani et al., 2008, 2010]. Carlier et al. [2005] obtained different depleted mantle ages in potassic‐ultrapotassic mafic rocks which argue for the existence of two Altiplano blocks with distinct lithospheric mantles, separated by the Urcos‐Sicuani‐Ayaviri fault system (Figures 1 and 2).
[10] Fission track data on both apatite and zircon crystals
on plutonic rocks of the Tertiary Andahuaylas‐Yauri bath-olith ranged between 24 and 14 Ma and between 38 and 30 Ma, respectively [Ruiz et al., 2009]. Thermal modeling suggests that the uplift of the Western Cordillera was thus probably steady for this period with sedimentary deposition restricted to the present‐day Altiplano and inter‐Andean valley regions.
[11] A detailed overview of the stratigraphy of the region
is given by Carlotto [1998] and Perello et al. [2003]. 2.2. Structural Overview
[12] Central and southern Peru are limited by the Abancay
deflection [Marocco, 1978], with structural orientations rotating E‐W and locally as anomalous as NE‐SW (Figure 1). In southern Peru, along the northeastern border of the Western Cordillera, the Mesozoic to Cenozoic sequences are moderately to intensely deformed in large, northwest trending folds with dominantly northeastern vergence (Figure 2). Folding in the region typically involves Albian‐Turonian carbonate and shaly sequences (Ferrobamba Formation and equivalent units) that wrap around cores of quartz arenite of the Yura Group (middle Jurassic–Lower Cretaceous). In northernmost southern Peru, the Altiplano and the associ-ated Tertiary basins are limited by two main north‐northwest trending fault systems; the Cuzco‐Lagunillas‐Mañazo to the west and the Urcos‐Sicuani‐Ayaviri to the east with exposed lengths of >300 km [Carlotto et al., 2005] (Figure 2). In the vicinity of the Abancay deflection [Marocco, 1978], the nearly E‐W Abancay fault system transposes Paleozoic plutonic rocks over Cenozoic cover sequences. Farther east, near Curahuasi, they place deep cumulate facies of the Eocene Andahuaylas‐Yauri batholith on top of either younger intru-sions from the same batholith or over late Eocene volcanic horizons of the Anta Formation [Carlotto, 1998]. The two main fault systems separate domains with different paleo-geographic histories during Mesozoic time [Carlotto, 1998; Carlotto et al., 2009]. These structures were reactivated during Andean deformation [Jaillard and Santander, 1992; Figure 2. Regional map of the Chalhuanca‐Abancay‐Cuzco area (modified from Perello et al. [2003]). The paleomagnetic results south of Cuzco are presented by Roperch et al. [2010]. A more detailed geological map of the Abancay area is shown in Figure 4.
Figure
Carlotto, 1998; Benavides‐Cáceres, 1999] and are still active with evidence of quaternary normal faulting [Cabrera et al., 1991; Cabrera and Sébrier, 1998] or Pleistocene ultra-potassic volcanism [Carlier et al., 2005]. The bulk of the deformation started at∼42 Ma [Carlotto, 1998] and thus is broadly synchronous with the Incaic orogeny of central and northern Peru [Noble et al., 1974, 1990; Mégard, 1984; Mégard, 1987; Sébrier et al., 1988; Sébrier and Soler, 1991].
3.
Geology and Paleomagnetic Sampling
[13] Within volcanic rocks, each sampling site
corre-sponds to a single cooling unit. Within sediments, oriented samples were collected from several beds with cumulative stratigraphic thickness of several meters. Samples from Tertiary red beds correspond to claystones or fine siltstones. Samples were usually oriented with a magnetic and when-ever possible with a sun compass. Locations of sampling sites are shown in Figures 2 and 3, and additional infor-mation (geographic coordinates, bedding attitude and rock type) are listed in Table S1 in the auxiliary material.1 3.1. The Western Volcanic Arc and Fore Arc 3.1.1. The Nazca Ignimbrites
[14] Large sheets of ignimbrites cover the western fore‐
arc escarpment from an elevation of about 2300 to 3700 m with an apparent dip of about 3° to the W‐SW. Six sites were drilled in lower Miocene Nazca ignimbrites that crop out along the main road from Nazca to Puquio (Figure 3).
Macedo‐Sánchez et al. [1992b] reported results from 6 sites in the Nazca ignimbrites. Roperch et al. [2006] reported paleomagnetic results on early Miocene ignimbrites farther south near Moquegua and the Oxaya ignimbrites in northern Chile. K‐Ar and39
Ar/40Ar ages [Lefevre, 1979; Noble et al., 1979b, Thouret et al., 2007] in the range 18–22 Ma for the Nazca ignimbrites indicate that ignimbrite emplacement occurred contemporaneously along the fore arc of northern Chile and southern Peru during the early Miocene.
3.1.2. The Pampa Galeras Volcanics
[15] About 10 km to the east of the Nazca ignimbrites, the
arc is crosscut by the deep Acari Rio. Twelve sites ranging from an elevation of 4200 m down to 3700 m were sampled in a sequence made of volcanoclastic sediments interbedded with ignimbrites and andesitic flows. Three sites at the base of the sampled sequence were drilled in ignimbrites (sites 52, 53 and 62), while the above sites correspond to andesitic lava flows (among which are sites 50 and 54). The lavas are gently folded.
3.1.3. The Puquio Volcanics
[16] Eight sites were drilled within dikes and lava flows
to the east of Puquio (Figure 3). 80 km farther east, two sites (35 and 36) were sampled within the same ignimbrite (Figure 2), possibly of late Miocene age since the uppermost ignimbrite filling valleys to the southwest was dated at 9.2 ± 0.5 Ma by Lefevre [1979].
3.2. The Central Western Cordillera 3.2.1. The Chalhuanca‐Abancay Domain
[17] Eighteen km in the south of Chalhuanca, a diorite
stock (site 63) was sampled for 39Ar/40Ar analysis and paleomagnetic study. Ten kilometers to the northeast of Figure 3. Paleomagnetic sampling of the early Miocene volcanic lava flows and ignimbrites (blue circles).
White circles correspond to the paleomagnetic sampling of Macedo‐Sánchez et al. [1992b]. The Nazca ignimbrites cover the upper slope of the fore arc where a parallel drainage network is observed. The two ages highlighted in pink are from Thouret et al. [2007]. Ages in blue are from this study, and the40Ar/39Ar data are shown in Figure 5.
1
Auxiliary materials are available in the HTML. doi:10.1029/ 2010TC002725.
site 63, Jurassic black shale of the Yura group (site 34) were sampled for paleomagnetism. This site is close to a weathered small stock of unknown age.
[18] North of Chalhuanca and north of the Mollebamba
fault (Figure 2), 2 sites (71, 72) were sampled in the Cretaceous (Albian‐Turonian) Ferrobamba Formation that consists of limestones, black shales, and nodular cherts [Marocco, 1978; Pecho, 1981]. In this area the Ferrobamba limestones are folded and present an anomalous WSW‐ENE orientation of the fold axes (Figure 2). The limestones are intruded by a stock which was sampled at site 73 about 300 m away from site 72 in the limestone.
[19] Red beds of Late Cretaceous–early Tertiary age
overlay the limestones. Representative outcrops of the red beds are found along the road to Abancay that crosscuts a broad syncline. The red beds are fine‐grained siltstones showing increasing evidence of contact metamorphism (epidote) toward the northeast likely associated with the intrusion of the Abancay batholith. The syncline is crosscut by numerous NS dikes roughly (e.g., sites 29 and 66) orthogonal to the bedding of the red beds. During the 2006 field‐sampling season, the red beds, dikes and baked sedi-ments within dike borders were sampled. Because of the poor magnetic records of the dikes, only the baked sedi-ments were sampled during the second field trip. Three sites (25, 26, 27) were also sampled in the Andahuaylas batholith crosscutting the Mesozoic units.
3.2.2. The Andahuaylas Domain
[20] The Copacabana Permian limestones and shales
were sampled at one site (75, Figure 4). A thick sequence
of Late Cretaceous–Paleocene and mainly fine‐grained Eocene‐Oligocene red beds, overlay the Permian sedi-ments. Three sites (76, 77, 78) were drilled in the red beds. In the whole area between Abancay and Andahuaylas, bedding strikes are roughly E‐W oriented. Bedding is dipping to the south for the Permian deposits and the red beds.
3.2.3. The Anta Domain
[21] The Anta domain is limited to the east by the Accha‐
Huanoquite fault and to the southwest by the Cotabambas fault (Figure 2). The domain is limited to the north by the Patacancha‐Tambourco fault that is part of the Abancay fault system. Late Eocene–early Oligocene volcanics of the Anta Formation were sampled near Chinchaypujio, north of the Cotabambas fault marked by the deep Apurimac canyon. The Anta Formation is a >1,000 m thick sequence charac-terized by a lower member with andesite lava flows and dacite pyroclastic flows locally interbedded with alluvial conglomerate, and an upper member of fluvial conglomerate with interbedded andesite and basaltic andesite flows of middle Eocene to early Oligocene age (stratigraphic relations and K‐Ar geochronology [Carlier et al., 1996; Carlotto, 1998]). Two biotite‐rich dacitic flows from the middle part of the formation displayed K‐Ar ages of 38.4 ± 1.5 (near site 84) and 37.9 ± 1.4 Ma, whereas a basaltic horizon from the upper part of the unit yielded a K‐Ar whole rock age of 29.9 ± 1.1 Ma [Carlotto, 1998]. Bedding attitude was determined from nearby interbedded sediments. Although the Anta formation is mainly conglomeratic, we were able to sample the finest beds at site 3.
Figure 4. Geological map of the Abancay‐Andahuaylas area and paleomagnetic sampling (UTM coor-dinates in m).
3.3. The Western Altiplano
[22] Major syntectonic Cenozoic continental sedimentary
basins characterize the western Altiplano. The sedimentary San Jerónimo Group corresponds to Eocene to early Oli-gocene sequences, found to the south and southwest of the town of Cuzco (Figure 2). The San Jerónimo Group consists of two main formations (Kayra and Soncco), with a total thickness of ∼4,500 m, made up of red bed terrigenous (sandstone, shale, pelitic sandstone, and volcanic micro-conglomerate) strata interbedded with tuffaceous horizons near the top. The age of the San Jerónimo Group is con-strained by stratigraphic relations (it unconformably overlies strata with plant fossils of Paleocene to early Eocene age) and on K‐Ar and39
Ar/40Ar ages of 29.9 ± 1.4 Ma and 30.84 ± 0.83 Ma, respectively, from the upper tuffaceous horizons of the Soncco Formation (Figure 2) [Carlotto, 1998; Fornari et al., 2002]. Between Cuzco and Sicuani, basal sandstone of the Soncco Formation includes horizons of stratiform
copper mineralization, up to several meters thick, with hypogene chalcocite and bornite, and supergene copper oxides [Cárdenas et al., 1999; Loza et al., 2004]. The San Jerónimo Group is equivalent to the Puno Group of the Peruvian Altiplano southeast of the study region (Figure 2), where it is overlain by the volcanic horizons of the Tacaza Group [Klinck et al., 1986; Clark et al., 1990; Jaillard and Santander, 1992]. Erosion products of the Anta Formation located to the west feed the San Jerónimo basin with increasing volcanoclastic input in upper part of the Soncco Formation. The coarsening upward characteristics of the sequence, with alluvial and fluvial conglomerates dominated by volcanic and plutonic clasts at the top, are interpreted to reflect topographic rejuvenation of the source regions in response to increasing regional tectonic uplift, with sedi-mentation in a piggyback style basin environment [Carlotto, 1998].
3.3.1. The Cuzco‐Quiquijana Domain
[23] South and west of Cuzco, 16 sites were sampled and
the results are presented in a companion paper [Roperch et al., 2010].
3.3.2. The Sicuani Syncline
[24] To the southwest of Sicuani, three sites (18, 19, 20)
were drilled in the red beds from the core of the syncline bounded to the west by the Pomacanchis fault and to the east by the Sicuani‐Ayaviri fault. The upper part of the red bed sequence can be correlated with the Soncco Formation. 3.3.3. Isolated Sites
[25] Isolated sites were also drilled at several locations
north of the fault system delimitating the northern edge of the Altiplano. An intrusive was sampled at site 21 located 1 km south the Sacsayhuaman Incaic site. The rock shares a similar lithology with the diorite stock of the famous and striated Rodadero block of the archeological site. Northeast of Cuzco, one site was sampled in Permian volcanics (82), and one site (07) in Tertiary red beds near Urubamba.
[26] Site 22 was drilled in the red beds near the Anta town
where bedding is dipping toward the southwest.
4.
New
39Ar/
40Ar Dating
[27] Argon analyses were performed at Géosciences Rennes
and Géosciences Azur. Samples are from the same paleo-magnetic sites drilled in lava flows, dikes or intrusion. The analyses were made on single whole rock fragments of basalt or andesite and on biotite from intrusives and ignimbrites.
[28] Samples were wrapped in aluminum foil and
irradi-ated at McMaster University’s (Hamilton, Canada) nuclear reactor. The procedures used in the laboratories of Rennes and Nice are described in more detailed by Galland et al. [2007] and Roperch et al. [2006], respectively. Whole rock fragments and minerals were carefully handpicked under a binocular microscope from crushed rocks (0.3–2 mm fraction).
[29] Results are summarized on Figure 5.
4.1. The Pampa Galeras Volcanics
[30] Lefevre [1979] reports a K‐Ar whole rock age of
17.1 Ma and a biotite age of 20.4 Ma for the ignimbrites at the base of the sampled section. Three new39Ar/40Ar ages from three different units greatly clarify time lag between bottom and top of this section. A biotite (site 62, altitude 3770 m) from an ignimbrite at the base of the section yields Figure 5. The40
Ar/39Ar data for sites in the Pampa Galeras, the Puquio area, and the Chalhuanca area.
a plateau age at 20.1 ± 0.1 Ma (1s). Whole rock samples from sites 54 (altitude 3900 m) and 50 (altitude 4150 m) from overlying andesites yield slightly younger plateau ages at 18.8 ± 0.1 Ma (1s) and 18.1 ± 0.1 Ma (1s), respectively. These ages are coherent with their stratigraphic position within section.
[31] Observed slope of Nazca ignimbrite sheets is ∼3°
toward the W‐SW. If this slope results of a general tectonic tilt, the Nazca ignimbrites should be found at an elevation higher than the uppermost volcanic flow of the Pampa Galeras section (site 50), suggesting that they could be stratigraphically younger. But our new39Ar/40Ar ages argue for emplacement of the Pampa Galeras volcanics just after the emplacement of the oldest ∼22 Ma Nazca ignimbrite. This result supports the interpretation of Noble et al. [1979b] that Pampa Galeras corresponds to a collapse caldera filled with a slightly younger volcanic sequence.
4.2. The Puquio Volcanics
[32] We dated three volcanic units at sites 41, 44 and 38.
The new39Ar/40Ar data suggest that these rocks are slightly younger than Pampa Galeras volcanics. Whole rock from an andesitic dike (41) displays two subtly discordant age spectra with slightly distinct but coherent plateau ages at 16.7 ± 0.1 Ma and 16.2 ± 0.1 Ma. A biotite from the uppermost ignimbrite within sampling area (44) yields a flat age spectrum with a plateau age at 13.5 ± 0.1 Ma in rather good agreement with an age at 14.4 ± 0.7 Ma reported by Lefevre [1979] for a nearby dacite. Furthermore our39Ar/40Ar results confirm that an upper Miocene volcanism (site 38) cover these lower Miocene volcanic rocks. Duplicated analyses, (one measured in Rennes and the other in Nice) on whole rock sample, display very reproducible age spectra with two highly concordant plateau ages at 6.1 and 6.2 ± 0.1 Ma.
4.3. Intrusive Rocks in the Chalhuanca‐Abancay Domain
[33] The diorite stock (site 63) was sampled for39Ar/40Ar
analysis. A biotite yields a rather flat age spectrum allowing a plateau age calculation at 38.1 ± 0.4 Ma, defining a late Eocene age for this plutonic massif (Figure 5).
[34] In between the towns of Chalhuanca and Abancay,
early Tertiary red beds are crosscut by numerous NS dikes roughly (e.g., sites 29 and 66) orthogonal to the bedding of the red beds. The two 39Ar/40Ar experiments run on dike whole rock samples display disturbed age spectra, probably as a result of weathering. One of the runs allows a plateau age calculation at 35.8 ± 0.2 Ma, suggesting the dikes intruded the red beds during the late Eocene.
5.
Paleomagnetic Methods and Results
[35] Measurements of the remanent magnetizations were
made with the 2G cryogenic magnetometer at the University of Rennes. Samples from volcanic rocks were usually demagnetized with the 2G alternating field degausser but for most sites a few samples were also thermally demagnetized in the MMTD furnace. Samples from sedimentary units were all thermally demagnetized and room temperature suscepti-bility was measured to monitor chemical changes during heating.
[36] Principal component analysis [Kirschvink, 1980] was
applied to determine sample characteristic remanent mag-netization (ChRM) directions.
[37] Site‐mean directions were calculated by applying
Fisher statistics [Fisher, 1953]. When normal and reversed‐ polarity directions were present, a single mean direction was calculated by inverting the set of normal directions. For some sites, when the demagnetization trajectories of the ChRM was better defined by planes than by lines, planes and ChRMs were combined to calculate the mean direction (see Table 1). The expected direction and tectonic rotations at a paleomagnetic locality were calculated using the appro-priate age reference paleomagnetic pole for South America [Besse and Courtillot, 2002]. Positive (negative) rotation values are clockwise (counterclockwise) rotations.
[38] AMS is a rapid nondestructive tool to study rock
fabric [Borradaile and Henry, 1997], and Roperch et al. [2010] report results from the Cuzco area showing that the AMS fabric is a good proxy to detect complex folding. AMS was measured at all sedimentary sites and in intrusive rocks (Table 2) with the Agico KLY3S kappabridge. The mean normalized tensors were calculated following the statistical procedure of Jélinek [1978]. Samples for which the magnetic susceptibility increases upon heating were also measured after being thermally demagnetized because these samples often provide an enhanced and better defined magnetic fabric without changes in the orientation of the ellipsoids between heated and nonheated samples.
5.1. The Western Volcanic Arc and Fore Arc
[39] Magnetite is the main magnetic carrier and for most
samples at all sites, a ChRM direction going through the origin was observed during AF (186 samples demagnetized) or thermal demagnetization (23 samples demagnetized). Examples of thermomagnetic experiments and orthogonal demagnetization plots are shown in Figures S1 and S2 in the auxiliary material. At some sites, a spurious magnetization due to lightning was observed in some samples. When the ChRM was not very well determined, a best fit plane was calculated (Table 1). The site‐mean directions are well determined with Fisher concentration parameters k > 100 for 22 out of 25 sites (Table 1 and Figure 6).
5.1.1. The Nazca Ignimbrites
[40] Normal and reverse polarity ChRMs are observed
(Figure 6). Macedo‐Sánchez et al. [1992b] sampled 4 sites in ignimbrites nearby site 45 and these four sites record a similar reversed polarity magnetization as the one found at site 45. A reverse polarity is also observed at site 49. It is difficult to know if sites 45 and 49 belong to the same ignimbrite. Since they are separated by about 20 km and a difference of elevation of nearly 1000 m, we will consider that these two sites come from two different units. Of the four sites with normal polarity, site 46 belongs to an ignimbrite overlying a different ignimbrite possibly sampled at the three other sites (Table 1).
5.1.2. The Pampa Galeras Volcanics
[41] Of the twelve sites sampled, only the lowermost site
52 has a reverse polarity magnetization.
[42] The dominant normal polarity is in agreement with a
time of emplacement between 18 and 20 Ma while the Earth’s magnetic field polarity was essentially normal. The
Table 1. Paleomagnetic Resultsa
Site l_p_t
In Situ Tilt Corrected VGP
D (deg) I (deg) a95 k D (deg) I (deg) Latitude (deg) Longitude (deg) The Western Volcanic Arc and Fore Arc: Lower Miocene Nazca Ignimbrites
45 12_0_12 151.7 43.5 4.9 78 151.7 43.5 −61.4 349.1 46 4_2_6 6.6 −11.7 2.2 1028 6.6 −11.7 79.0 322.6 47 8_0_8 3.2 −32.9 2.5 494 3.2 −32.9 85.6 61.0 48 3_6_9 358.7 −32.4 1.9 839 358.7 −32.4 86.9 128.5 49 9_0_9 162.5 34.4 2.7 355 162.5 34.4 −72.7 358.9 51 9_0_9 6.3 −38.2 2.1 626 6.3 −38.2 81.0 64.8
The Western Volcanic Arc and Fore Arc: Lower Miocene Pampa Galeras Volcanics
50 2_5_7 354.3 −47.4 2.2 1026 338.2 −55.6 61.0 143.8 52 9_0_9 164.0 24.4 1.3 1574 166.0 22.6 −76.1 25.9 53 5_0_5 339.9 −28.8 2.5 944 346.0 −21.4 75.9 208.7 54 5_4_9 358.9 −9.4 1.4 1367 355.3 −18.6 83.1 242.7 55 7_0_7 335.4 −43.5 1.9 970 354.5 −34.1 83.3 157.5 56 8_0_8 347.3 −39.7 11.4 25 1.6 −26.6 88.4 353.7 57 5_2_7 1.9 −25.1 6.1 103 7.7 −8.4 77.1 322.3 58 5_0_5 295.1 −60.7 5.8 175 334.6 −52.8 60.3 152.1 59 8_0_8 323.1 −49.2 5.5 101 342.6 −34.1 72.9 179.6 60 4_4_8 8.0 −20.7 5.6 110 8.0 −20.7 81.2 349.7 61 3_3_6 22.3 −47.2 6.9 119 22.3 −47.2 65.2 52.8 62 6_0_6 330.0 −45.0 5.0 180 342.6 −39.1 71.9 168.8 The Western Volcanic Arc and Fore Arc: Lower Miocene Puquio Volcanics
40 4_4_8 167.5 33.0 3.5 275 167.5 33.0 −77.5 358.6 41 5_2_7 188.6 61.8 4.6 186 188.6 61.8 −60.7 273.1 42 7_0_7 171.0 26.4 11.6 28 171.0 26.4 −81.3 19.3 43 7_0_7 167.6 8.8 3.0 396 167.6 8.8 −74.0 54.6 44b 8_0_8 297.8 −52.2 2.6 470 297.8 −52.2 31.1 166.2 (Mean)c 22 350.7 −35.9 7.9 16 (TC)c 22 7.0 21 354.0 −32.6 (VGP) 22 6.1 27 82.8 159.9
The Western Volcanic Arc and Fore Arc: Upper Miocene Puquio Volcanics
37 6_0_6 351.6 0.0 5.6 146 351.4 −2.3 74.0 252.9
38 5_0_5 344.2 −3.5 5.7 178 344.2 −3.5 69.8 234.1
35 10_0_10 169.9 20.8 2.3 439 169.9 20.8 −79.5 36.5 36 6_0_6 175.2 34.1 2.2 928 175.2 34.1 −83.8 333.7
The Central Western Cordillera: Chalhuanca‐Abancay Domain: Paleogene Red Beds and Dikes
28 8_0_8 287.0 −9.7 9.3 37 293.9 −27.5 26.1 187.3 30 7_0_7 112.4 20.0 3.9 243 119.7 39.3 −32.4 359.2 31 6_1_7 96.6 16.6 6.6 90 95.0 17.1 −6.9 9.5 32 2_1_3 300.6 −39.3 6.6 958 295.7 −39.7 28.7 178.5 32 4_0_4 302.2 −59.2 6.9 177 292.1 −59.5 25.7 158.5 66 12_0_12 281.4 −21.2 5.7 60 286.7 −39.1 20.5 178.2 67 9_0_9 92.4 32.5 4.4 139 92.7 37.5 −7.4 357.1 68 3_4_7 292.6 −42.2 11.7 31 287.2 −34.9 20.5 181.3 69 4_2_6 311.9 −37.9 10.2 48 302.6 −29.6 34.7 187.0 Mean 9 289.6 −31.4 12.2 19 Mean 9 9.2 32 289.2 −36.4
The Central Western Cordillera: Chalhuanca‐Abancay Domain: Upper Cretaceous Ferrobamba Limestone
72 7_0_7 107.0 25.6 6.0 102 117.6 20.3 −29.0 12.4
72 8_0_8 278.7 −42.8 4.2 178 300.4 −38.7 33.1 179.6 71 6_0_6 271.2 47.5 11.2 37 296.1 −27.9 28.3 187.2
The Central Western Cordillera: Chalhuanca‐Abancay Domain: Paleogene Intrusive (73 and 27) and Jurassic Black Shales (34) 73 2_4_6 180.0 35.3 4.3 311 181.8 10.6 −81.1 118.5
27 4_0_4 3.3 −29.8 9.3 99 3.3 −29.8 76.3 348.6
34 9_0_9 149.8 33.3 5.4 90 170.9 12.4 −78.0 58.1
The Central Western Cordillera: Andahuaylas Domain: Lower Permian Limestones (75) and Paleogene Red Beds (76 and 77)
75 8_0_8 26.7 26.5 6.0 86 95.2 47.0 −10.8 350.2
76 8_0_8 107.4 43.0 6.7 69 136.1 16.8 −46.7 18.7
77 6_0_6 82.6 42.5 15.4 20 128.6 28.9 −40.3 8.0
The Central Western Cordillera: Anta Domain: Upper Eocene–Lower Oligocene Volcanics and Sediments (03)
79 11_0_11 341.8 −35.2 8.9 27 334.0 −43.5 63.0 168.1 83 7_0_7 291.4 −43.1 1.5 1719 302.9 −46.1 35.2 173.6
sequence is slightly folded and there is a slight increase in the Fisher parameter K upon tilt correction.
5.1.3. The Puquio Volcanics
[43] Of the 5 sites sampled in the lower Miocene part of
the section, four sites have a reverse polarity.
[44] Secular variation is likely not fully averaged at each
sublocalities and a mean direction was calculated with all the lower Miocene sites. We do not include the results from Macedo‐Sánchez et al. [1992b] because the same ignimbrite was likely sampled in both studies. Site 44 is at more than twice the angular standard deviation from the mean after tilt correction and is considered to correspond to an interme-diate direction of the Earth magnetic field. The mean direction using 22 sites is declination = 174.0°, Inclination = 32.6° with a Fisher k parameter of 21 and an a95 of 7.0°. The mean of the 22 Virtual Geomagnetic Poles is not sta-tistically different from the reference pole for stable South America at 20 Ma (82.8, 159.9, 6.1 compared to 82.1, 131.8, 4.6) [Besse and Courtillot, 2002].
[45] Only two volcanic units were sampled in the upper
Miocene sequence, one at site 37 and 38 and the other at sites 35 and 36 and this is not sufficient to determine a mean paleofield.
5.2. The Central Western Cordillera 5.2.1. The Chalhuanca‐Abancay Domain
[46] Paleomagnetic results were obtained in red beds and
baked contact from intruding dikes. Thermomagnetic experi-ments in dike samples show evidence of maghemitization and this is possibly the reason why no ChRM was determined for the dikes (thermomagnetic curves shown in Figure S1 in the auxiliary material). The baked sediments provide, in most cases, very stable univectorial magnetizations within one or two meters of the dike contact (Figure 7a) or well defined secondary components within a few meters (Figure 7b). Components of magnetization carried by hematite and going to the origin were also observed in the red beds especially on the southwestern limb of the syncline (Figure 7e). The
magnetization is mainly carried by hematite as shown by high unblocking temperatures and the back field IRM acquisition (Figure 7f). Normal and reverse polarity magnetizations are observed in red beds primary magnetizations as well as in dikes contacts in agreement with the Tertiary age of these rocks (Table 1). The scatter of the ChRM directions decreases slightly upon tilt correction but the low deformation of the syncline does not provide a very robust fold test (a fold test using Lisa Tauxe Pmag software is given in Figure S3 in the auxiliary material). The decrease of the scatter of the ChRMs upon bedding correction suggests that the dikes intruded prior to the slight folding of the syncline.
[47] At site 71 in the Ferrobamba limestone, the remanent
magnetization has very low intensity (0.2 mA m−1). After removing a low‐temperature secondary component, the ChRM was determined in the temperature range 300°C– 580°C. The ChRM after tilt correction is coherent with the direction observed in the red beds. A stronger magnetization is observed at site 72 (1.6 mAm−1) and three components of magnetization can be observed (Figure 8a). After removing a viscous component in the recent field, a magnetization of reverse polarity is identified in the temperature range 190°C– 300°C. A sharp decrease in the magnetization is then observed in between 300°C and 330°C (Figure 8c). AF demagnetiza-tion, Hcr values > 100 mT in back field IRM acquisition and the unblocking temperatures suggest that pyrrhotite (sharp unblocking at∼320°C [Rochette et al., 1990]) is the magnetic carrier of this component but low‐temperature experiments may be necessary to confirm this interpretation. A similar component of magnetization is then observed during demagnetization up to 580°C and is attributed to magnetite. The tilt correction does not provide solid evidence for a pretectonic or posttectonic magnetization because the incli-nation before and after tilt correction is compatible either with the expected inclination for an Eocene remagnetization and a late Cretaceous magnetization, respectively. The paleo-magnetic directions in the limestone (after bedding correction Table 1. (continued)
Site l_p_t
In Situ Tilt Corrected VGP
D (deg) I (deg) a95 k D (deg) I (deg) Latitude (deg) Longitude (deg)
86 7_0_7 136.4 28.9 3.8 248 143.1 26.1 −54.2 13.0 87 7_0_7 127.4 29.0 3.2 360 130.0 27.9 −41.6 9.9 88 7_0_7 299.4 −44.6 5.5 121 299.4 −44.6 32.2 175.1 89 7_0_7 338.2 −31.2 9.2 45 338.2 −31.2 68.8 186.3 03 6_2_8 317.1 −51.9 9.1 39 299.6 −31.5 31.9 186.4 03& 5_1_6 176.6 26.4 7.1 99 163.3 24.1 −73.7 20.4 mean 8 316.7 −38.8 11.1 26 8 11.2 25 318.7 −36.3
The Western Altiplano: Isolated sites: Paleogene Red Beds (07 and 22); Miocene (21) and Permian Volcanics (82)
07 13_0_13 190.0 24.8 3.9 113 168.6 40.7 −75.3 333.8 22 2_7_9 276.0 −2.7 9.1 40 22 2_7_9 7.7 56 291.5 −32.9 24.3 184.0 21 7_0_7 124.8 34.9 13.8 20 −36.9 3.9 82 8_0_8 186.7 28.3 9.0 39 167.2 57.7 −62.7 310.4 a
The l_p_t, number of lines and planes used to calculate the mean ChRM direction, t = l + p; D, I,a95, and k are the declination, inclination angle of confidence at 95% and Fisher parameter k, respectively; Latitude and Longitude are the latitude and longitude of the virtual geomagnetic pole (VGP).
b
Site 44 has a VGP latitude at more than 45° from the mean and was not included in the calculation of the mean direction.
cMean from 22 sites in the lower Miocene volcanics. d
for site 71) are similar to those registered in the Tertiary red beds and dikes (Figures 9a and 9b).
[48] After thermal or AF demagnetization, a ChRM of
reverse polarity with a south pointing declination (Figure 9c) is found in samples of site 73 drilled in a small tonalite stock some 300 m away from site 72. Pyrrhotite formation with normal polarity in the limestone is thus not contemporane-ous of the acquisition of the reverse polarity magnetization in the intrusion [Gillett, 2003]. However, there are some evidence of strong chloritization of the biotite of the intru-sive rock at site 73 and its ChRM may not correspond to the time of emplacement but to the time of alteration.
[49] A different situation is observed south of Chalhuanca
at site 34 where a ChRM direction of reverse polarity is recorded by Jurassic black shales and by a nearby stock. As for site 72, the sharp unblocking temperatures near 320°C (Figure 8b) and Hcr values above 100 mT (Figure 8d) suggest that the magnetic carrier at site 34 is pyrrhotite. The inclina-tion in situ is in better agreement with the expected incli-nation but it is not possible to perform a complete fold test.
5.2.2. The Andahuaylas Domain
[50] A ChRM direction with unblocking temperature above
200°C was obtained in the early Permian Copacabana lime-stone but the overlying black shales have an unstable rema-nent magnetization (Figure 10). The steep positive inclination after tilt correction is in good agreement with the expected lower Permian Kiaman reverse inclination (Figure 10).
[51] Of the three sites sampled in Eocene‐Oligocene red
beds, the lowermost site (76) corresponds to samples with hematite as the main magnetic carrier and it records a stable primary magnetization of reverse polarity (Figure 10). Site 77 has a similar reverse polarity magnetization but slightly less stable than the one observed at site 76. We were not able to determine a ChRM for samples of site 78 located about 900 m stratigraphically above site 76. The magnetic min-eralogy at site 78 is dominated by magnetite.
5.2.3. The Anta Domain
[52] A univectorial ChRM was observed at most sites of
volcanic rocks of the Anta formation (Figure 11). Table 2. Anisotropy of Magnetic Susceptibility Resultsa
Site
Kmax Kmin
lin fol ani
D1 I1 D1s I1s D1s2 p1 D3 I3 D3s I3s
Red Beds Cusco Region
18 159.5 12.2 165.5 0.4 157.0 3.8 56.1 47.0 258.3 81.6 1.017 1.022 1.039 19 159.8 29.0 176.9 12.0 164.9 13.0 311.1 57.7 273.5 28.4 1.013 1.007 1.020 20 156.5 4.4 151.8 1.1 167.6 4.3 247.8 17.7 54.5 81.2 1.016 1.008 1.024 17 279.4 34.9 89.5 2.2 100.2 7.0 52.1 44.2 249.3 87.7 1.009 1.025 1.034 22 260.1 41.8 70.2 2.0 80.9 4.1 170.1 0.0 160.2 0.0 1.008 1.002 1.010 03 360.0 11.3 4.4 7.4 46.9 253.6 54.7 226.6 80.1 1.003 1.043 1.046 06 315.4 34.8 320.9 5.0 316.1 9.3 54.7 13.0 230.3 7.1 1.021 1.010 1.031 07 181.4 17.5 166.4 30.4 171.3 13.9 69.2 50.2 67.1 15.3 1.006 1.019 1.025
Red Beds Chalhuanca
28 238.2 23.6 58.4 2.4 58.2 3.3 331.5 7.6 328.1 7.1 1.018 1.007 1.025 30 238.5 17.5 59.6 3.7 58.2 6.3 31.1 70.4 318.3 71.8 1.006 1.007 1.013 31 84.6 6.4 84.1 5.8 84.3 33.8 277.4 83.4 312.2 81.3 1.012 1.146 1.160 32 78.7 8.1 78.2 4.6 78.5 13.5 222.1 79.9 244.8 85.2 1.013 1.029 1.042 64 237.1 19.6 57.7 5.1 56.9 4.5 5.9 60.4 317.7 62.7 1.040 1.003 1.042 65 228.8 22.7 227.0 4.2 228.5 4.2 346.9 48.4 324.9 61.8 1.031 1.041 1.074 66 236.3 20.6 237.7 1.8 236.4 7.0 331.9 14.6 327.9 8.6 1.013 1.006 1.019 67 243.4 20.4 244.1 15.8 243.7 13.2 95.1 66.4 97.1 71.3 1.013 1.005 1.018 68 63.0 8.0 243.1 2.0 243.0 7.3 314.8 65.9 338.0 67.8 1.003 1.002 1.005 69 70.1 21.0 69.9 5.0 70.1 3.9 237.1 68.5 210.2 83.5 1.017 1.044 1.062 70 48.1 19.9 49.3 4.7 48.3 14.2 234.6 70.0 195.2 84.3 1.003 1.019 1.022 74 215.1 10.3 35.1 10.7 35.2 7.8 327.2 64.2 281.5 64.8 1.021 1.009 1.030
Lower Permian Andahuaylas
75a 236.9 58.4 192.5 5.0 233.4 11.0 143.1 2.3 293.2 64.5 1.029 1.014 1.043 75b 73.1 3.9 78.9 5.2 76.5 14.1 340.8 30.0 213.4 82.6 1.012 1.059 1.071
Red Beds Andahuaylas
76 257.7 25.4 244.3 3.7 256.1 4.6 7.2 35.1 46.9 86.2 1.017 1.019 1.036 77 247.2 13.6 67.6 14.3 254.2 12.8 343.2 23.3 294.1 69.7 1.015 1.010 1.025 78 246.8 40.8 228.6 5.3 244.9 5.4 338.0 1.3 323.8 44.1 1.024 1.020 1.044 Intrusive Rocks 27 68.6 33.9 68.6 33.9 3.8 232.7 55.1 232.7 55.1 1.055 1.021 1.077 29 348.9 45.8 327.6 40.2 16.0 224.2 28.9 229.0 10.0 1.012 1.005 1.017 63 173.8 53.9 174.8 30.9 23.4 279.9 11.4 274.4 15.5 1.029 1.006 1.036 73 355.4 7.6 352.9 31.7 11.7 260.8 31.1 249.6 20.4 1.015 1.012 1.028 25 11.2 86.8 11.2 86.8 21.0 222.4 2.7 222.4 2.7 1.063 1.122 1.193 a
Kmax and Kmin are the maximum and minimum axes of the AMS ellipsoids. D1, I1, D1s, I1s, and D1s2, are the declination and inclination of the magnetic lineations in in situ, bedding corrected and after double correction bringing first to the horizontal the magnetic lineation, respectively. D3, I3, D3s, and I3s are the declination and inclination of the magnetic foliation in in situ and after tilt correction; lin, fol, and ani are the degree of lineation (k1/k2), foliation (k2/k3), and anisotropy (k1/k3), respectively; p1 is the largest angle of the ellipse of confidence at 95% around the lineation More details are given in Table S2 in the auxiliary material.
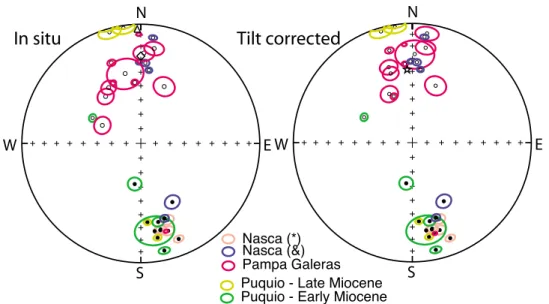
Figure 6. Equal‐area stereonet of ChRM directions ((left) in in situ coordinate and (right) tilt‐corrected coordinate) and 95% confidence angle around the mean for sites in the Puquio area. Open (solid) circles are projections in the upper (lower) hemisphere. The color of the confidence ellipse is used to separate the different data sets. Results in the Nazca ignimbrites are from Macedo‐Sánchez et al. [1992b] (asterisk) and this study (ampersand). The triangle, diamond, and star are the present‐day field direction, the geocentric axial dipole direction, and the expected direction at 20 Ma, respectively, from the Besse and Courtillot [2002] APWP for the South American plate.
Figure 7. (a–e) Orthogonal plots of thermal demagnetization of samples from Paleogene red beds of the Chalhuanca area. Open circles are projection in the vertical plane, while circles correspond to the hori-zontal plane. (f) Back field IRM acquisition after saturation in a field of 2.5 T for red bed samples.
[53] Samples at site 03 drilled in sediments at the
east-ernmost limit of the block record two magnetizations. A secondary remanent magnetization of reverse polarity is recorded in the temperature range 200°C–580°C. The high‐ temperature component corresponds to a normal polarity magnetization. Few undated tiny dikes are intruding the sedimentary sequence and associated hot fluid circulation could be responsible for the remagnetization of reverse polarity.
[54] The dispersion mainly in declination suggests a
possible differential amount of counterclockwise rotation that could be due to differences in ages if the dikes sampled at sites 79 and 89 are the youngest sampled rocks but further radiometric dating is needed.
5.3. The Western Altiplano 5.3.1. The Cuzco‐Quiquijana Area
[55] In the companion paper, Roperch et al. [2010] report
most of the results obtained in the Cuzco region. 5.3.2. The Sicuani Syncline
[56] Red bed samples from the Sicuani syncline have
hematite and magnetite as magnetic carriers. The large vis-cous component and a complex demagnetization behavior prohibit the determination of accurate ChRMs for these sites. 5.3.3. Isolated Sites
[57] At site 22, both polarities are observed in the same
sample with the normal polarity magnetization being the high‐temperature component. The ChRM direction for the Figure 8. (a) Orthogonal plot of thermal demagnetization of one sample in remagnetized limestones at
site 72. A normal polarity is observed above 285°C. A component of magnetization of opposite polarity is observed in the temperature range 150°C–285°C. (b) Orthogonal demagnetization of one sample from the Jurassic black shales at site 34. The sample was first submitted to AF demagnetization up to 50 mT and thermally demagnetized from 190°C up to 350°C. The ChRM, likely carried by pyrrhotite, is unblocked between 300°C and 320°C. (c) Variation in the intensity of the magnetization after demagnetization in zero field for all samples of site 72 in the Ferrobamba limestone. (d) Back field IRM acquisition after saturation in a field of 2.5 T. The gray circles correspond to one sample from site 72. The white circles correspond to one sample in remagnetized black shales from site 34. The solid circles correspond to one sample in nonremagnetized Ferrobamba limestone at site 71.
site was calculated with best fit planes and vectors anchored to the origin.
[58] Near Urrubamba, a secondary magnetization with
unblocking temperature (200°C–580°C) is observed in all the samples from site 07. The high‐temperature component of normal polarity was determined only in 3 samples.
[59] A reverse polarity ChRM was found at site 21 in a
small stock nearby the Saqsayhuaman archeological site. [60] Finally, we also obtained paleomagnetic results at
one site (82) in the Upper Permian Mitu volcanics. It was not possible to isolate well‐defined ChRMs in red beds from sites 6 and 17.
6.
Anisotropy of Magnetic Susceptibility
[61] The AMS data are listed in Table 2 in in situ and after
bedding correction. As suggested by [Roperch et al., 2010], the magnetic lineation was also untilted in two steps when the lineation is not horizontal in in situ coordinate (Table 2). This procedure reduces in several cases the scatter in the orientation of the lineations after tilt correction. An example
is given by three sites (18, 19, 20) sampled in the Sicuani syncline (Figure 2 and Table 2).
6.1. The Central Western Cordillera 6.1.1. The Chalhuanca‐Abancay Domain
[62] The anisotropy degree is usually low (P < 1.05) but
most sites have well‐defined triaxial ellipsoids (Figure 12). [63] The magnetic lineations are oriented NE‐SW while
the magnetic foliation is mainly controlled by sediment bedding (Figure 12). In the Chalhuanca area (Figure 12a), the magnetic lineation is not oriented along but strongly oblique (>70°) to the present syncline axis. It has not been possible to identify an organized magnetic fabric in the dikes. Samples taken in baked sediments within a few tens of centimeters of dike borders record the same fabric than the one recorded by sediments not affected by dike intru-sion. Sites from red beds with epidote along the northeastern limb of the syncline present also similar orientation of the ellipsoids though the shape of the ellipsoids are slightly more prolate than those of the southwestern limb. The magnetic fabric was also measured at few sites in the intrusive rocks. The magnetic lineations in intrusive units Figure 9. Equal‐area stereonets of ChRM directions in (a) in situ and (b) after bedding correction for sites
north of Chalhuanca. Circles are results in red beds and baked contacts, squares correspond to the antipodal magnetizations in limestones at site 72, and the star corresponds to the nonremagnetized limestone at site 71. The triangle, diamond, and hexagon are the present‐day field direction, the geocentric axial dipole direction, and the expected direction at 40 Ma, respectively, from the Besse and Courtillot [2002] APWP for the South American plate. (c) Results in intrusive stocks 27 and 73 and remagnetized Jurassic black shales at site 34 (gray square).
are more dispersed than in the red beds (Figure 12c). These preliminary results do not show evidence for a syntectonic stress control in the emplacement of the intrusive units and a more detailed AMS study is needed to constrain the nature of AMS fabric in the intrusive rocks.
6.1.2. The Andahuaylas Domain
[64] Red beds sediments in the Andahuaylas domain
have similar AMS ellipsoids than those of the Chalhuanca domain (Figure 12b). The magnetic lineations of the Eocene‐ Oligocene red beds are slightly tilted toward the W‐SW and oblique to the E‐W strike of bedding.
[65] A magnetic fabric was also observed in the Permian
sediments from the same locality (site 75, Table 2). The black shales present oblate ellipsoids and horizontal magnetic lineations while the underlying limestones have more pro-late ellipsoid.
6.2. The Western Altiplano
[66] Triaxial ellipsoids are also observed in red beds of the
Soncco and Kayra formation [Roperch et al., 2010]. Near Sicuani (sites 18, 19, 20), the nearly N‐S AMS lineation is oriented in the direction of the fold axis but slightly tilted to the south.
[67] At site 17, and site 22, the magnetic lineation is
nearly E‐W. This deviation of the lineation is correlated to a large apparent counterclockwise rotation at site 22. Unfor-tunately, no paleomagnetic result is available for site 17.
[68] At site 03, the magnetic lineation is not well defined
(p1 > 45°) and we will not use the result for the tectonic interpretation of the paleomagnetic results.
7.
Discussion
7.1. Tectonic Rotations
[69] Tectonic rotations were determined using the Besse and
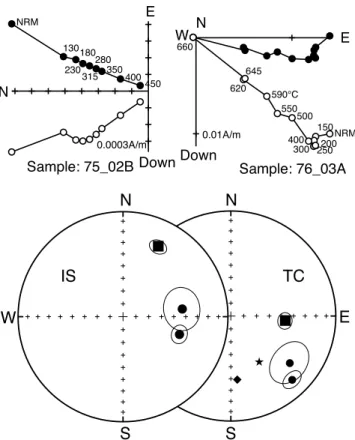
Courtillot [2002] APWP reference curve. For sites showing a nonhorizontal magnetic lineation in situ coordinates, Figure 10. (top) Orthogonal plots of thermal
demagnetiza-tion for one sample from site 75 and one sample from site 76. (bottom) Equal‐area stereonets of ChRM directions in lower Permian black shales (site 75, square) and Paleogene red beds (sites 76 and 77, circles). The diamond and star are the expected direction at 40 Ma and 290 Ma, respectively, for the stable South American plate.
Figure 11. Paleomagnetic results for the Anta domain shown in (left) in situ and (right) tilt‐corrected coordinates. The squares correspond to results from site 3 with the low unblocking temperatures of reverse polarity and the high unblocking temperature component with normal polarity. Circles correspond to volcanic rocks. The secondary component of reverse polarity at site 3 is not used to calculate the mean. The triangle, diamond, and hexagon are the present‐day field direction, the geocentric axial dipole direc-tion, and the expected direction at 40 Ma, respectively.
characteristic magnetization and bedding were first cor-rected to bring the AMS lineation to the horizontal as proposed by Roperch et al. [2010]. This correction can only be applied to sediments with a well‐defined AMS fabric and it was applied to sites 76, 77, and 22 (Table 3). The double correction was not necessary for the sites of the Chalhuanca syncline because there is no rotation about vertical axis induced by the bedding correction (see, e.g., the AMS data in Table 2).
[70] In the Puquio area, tectonic rotations (R = −2.3° ±
7.7°) since the early Miocene is less than the rotation determined by Rousse et al. [2003] for the Pisco basin (R = −10.3° ± 3.4°) but in agreement with the results from ignimbrites studied further south [Roperch et al., 2006].
[71] In the Chalhuanca area, the paleomagnetic data
document a large counterclockwise rotation (Figure 13a). We can discard the hypothesis that the large rotation is due to complex folding. Sites were sampled in an open syncline Figure 12. Equal‐area projections of AMS results in (left) in situ and (middle) after bedding correction
and (right) T‐P′ plot showing the shape of the AMS ellipsoids. (a) Red beds of the Chalhuanca area. (b) Copacabana limestone and black shales at site 75 and red beds of the Andahuaylas area. (c) AMS results in intrusive stocks of the Chalhuanca‐Andahuaylas area. In Figures 12a and 12b, great circles in green correspond to bedding. In Figure 12a the orientation of the syncline determined from the bedding measurements is also highlighted by two short line segments.
whose axis is roughly NNW‐SSE and bedding corrections do not result in significant changes in the paleomagnetic declination. Thus the large counterclockwise rotation is not the result of an improper tectonic correction. Moreover the same anomalous declination is found at sites separated by tens of kilometers allowing the definition of a large struc-tural block. This rotation postdates the intrusion of the dikes since the baked sediments at dike contact record the rotation. The preliminary ages on the dikes indicate that the rotation is no older than late Eocene. The results from the intrusive stocks are unfortunately limited and difficult to interpret. At site 73, the reverse polarity magnetization is nearly NS while the nearby remagnetized limestones (site 72, assuming the normal polarity magnetization was acquired during the late Eocene; see Table 3 and Figure 8) record the same large rotation than the red beds and crosscutting dikes. Taking into account evidence for alteration associated with chlorite, the magnetization in the stock (site 73) could be younger than the time of emplacement of the intrusive rock. At site 27, the ChRM is a normal polarity magnetization charac-terized by low unblocking temperature and we cannot reject the hypothesis that the magnetization is a more recent vis-cous magnetization. Finally, the remagnetization observed in the Jurassic black shales at site 34 cannot be precisely dated because the intrusive rock was altered. Moreover, this site is located to the south of the Mollebamba fault and may not belong to the strongly rotated block.
[72] The rotation in the Anta domain (R =−35.6 ± 12.8) is
less than the one observed in the Chalhuanca block (R =−65 ± 11.1) but is larger than the rotation recorded by the Eocene‐ early Oligocene red bed sequence in the Cuzco area (R = −4.5 ± 8.4 [Roperch et al., 2010]) (Figure 13a). Gilder et al. [2003] reported evidence for large counterclockwise rota-tions in Permian to Jurassic rocks. Most of their sites were taken within the main fault structures especially the Urcos‐ Sicuani‐Ayaviri fault system (Figures 1 and 2) limiting to the east the Tertiary basins. There is a large variability in the amount of counterclockwise rotations from site to site in the study of Gilder et al. [2003] and the paleomagnetic results obtained in the Tertiary red beds away from the faults do not show such large rotations [Roperch et al., 2010]. It is thus likely that the counterclockwise rotations along the fault system are induced by a component of sinistral displacement during thrusting. A somewhat opposite situation was found by Maffione et al. [2009] in the Eastern Cordillera of NW Argentina.
7.2. AMS and Paleostrain
[73] North of Chalhuanca, the magnetic lineation, oriented
SW‐NE, is oblique to nearly orthogonal to the present attitude of the syncline and it is readily observed in Figure 12a that the magnetic lineations were folded during the syncline formation and that they were acquired prior to this late phase of folding. The anomalous orientation (SW‐NE) of the lineations (Figure 13b) correspond to the largest counter-clockwise rotations (Figure 13a). In an oroclinal plot (Figure 13c), there is no correlation between the strike of bedding and the rotations but there is a correlation between the orientation of the magnetic lineation and the rotation. In the Eocene–early Oligocene red bed sequences of the San Jeronimo group near Cuzco, the AMS fabric was acquired during the early stages of the Andean deformation
Table 3. Mean Paleomagnetic Results and Tectonic Rotations a Loc Lat Lon Age N In Situ Tilt Corrected AMS Corrected Rotation (deg) Inclination Error (deg) D (deg) I (deg) a 95 (deg) k D (deg) I (deg) a 95(°) k D (deg) I (deg) a 95 (deg) k P − 14.60 − 74.30 20 (23 –16) 22 350.7 − 35.9 7.9 16 354.0 − 32.6 7.0 21 nd nd nd nd − 2.3 ± 7.7 − 5.9 ± 7.7 Ch − 13.94 − 73.12 40 (60 –35) 9 289.6 − 31.4 12.2 19 289.2 − 36.4 9.2 32 nd nd nd nd − 65.0 ± 11.1 − 2.9 ± 11.0 A − 13.63 − 72.23 40 (45 –30) 8 316.7 − 38.8 11.1 26 318.7 − 36.3 11.2 25 nd nd nd nd − 35.6 ± 12.8 − 2.7 ± 12.1 Cu b − 13.70 − 71.9 40 (50 –30) 16 324.5 − 38.6 15.5 7 352.8 − 24.3 10.3 14 169.9 23.1 6.3 35 − 4.5 ± 8.4 − 16.1 ± 9.6 Isolated sites 22 − 13.48 − 72.10 40 (50 –30) 1 276.0 − 2.7 9.1 40 291.5 − 32.9 7.7 56 300.4 − 31.8 7.7 56 − 54.0 ± 9.6 − 7.0 ± 10.3 34 − 14.35 − 73.16 40 (50 –20) 1 149.8 33.3 5.4 90 170.9 12.4 5.4 90 nd nd nd nd − 24.4 ± 8.2 − 6.6 ± 9.2 71 − 14.04 − 73.30 90 (100 –80) 1 271.2 47.5 11.2 37 296.1 − 27.9 11.2 37 nd nd nd nd − 58.9 ± 10.6 − 1.7 ± 10.1 72 − 14.04 − 73.23 40 (80 –35) 1 278.7 − 42.8 4.2 178 nd nd nd nd − 75.5 ± 7.8 − 3.3 ± 8.8 75 − 13.54 − 73.16 290 (310 –270) 1 26.7 26.5 6.0 86 95.2 47.0 6.0 86 nd nd nd nd − 53.0 ± 8.4 0.0 ± 6.8 76 − 13.56 − 73.14 40 (60 –30) 1 107.4 43.0 6.7 69 136.1 16.8 6.7 69 147.7 16.6 6.7 69 − 26.5 ± 8.4 − 22.2 ± 9.8 77 − 13.56 − 73.14 40 (60 –30) 1 82.6 42.5 15.4 20 128.6 28.9 15.4 20 135.0 28.8 15.4 20 − 39.2 ± 15.5 − 10.0 ± 14.8 aLoc, localities (P, Puquio; Ch, Chalhuanca; A, Anta; Cu, Cuzco) and site numbers. Lat, Lon, mean latitude and longitude of the locality; N, number of si tes used in the calculation of the mean; D, I, a 95, and k, the declination, inclination angle of confidence at 95% and Fisher parameter k, respectively; rotation and the inclination error were calculated with respect to the apparent polar wander path for stable South America of Besse and Courtillot [2002] and according to the expected time of acquisition (age) of the magnetization. b From Roperch et al. [2010].
[Roperch et al., 2010]. It is thus likely that the magnetic lineations were formed prior to the rotation recorded by the remanent magnetization. In that case, taking into account that the Chalhuanca block is rotated counterclockwise by ∼60°, the anomalous orientations of the magnetic lineations (NE‐SW) become more characteristic of a typical Andean paleostrain direction (NW‐SE) prior to the tectonic rotation (Figure 13d). This interpretation is supported by the con-sistent magnetic fabric in baked and nonbaked sediments suggesting that the magnetic fabric was likely acquired prior to the dike intrusion.
[74] The Cretaceous marine sediments sequence
(Ferro-bamba and Ayabacas Formation) are folded and fold axes are also anomalous with SW‐NE trends to the west of the Chalhuanca sampling area. Synsedimentary deformation led Callot et al. [2008] to argue that the Ayabacas Fm records evidence for a giant collapse of the carbonate platform at the Turonian‐Coniacian time. The trend of the anomalous fold axes in the Mesozoic units is parallel to the magnetic fabric in the red bed sequence. Thus we consider that the observed folding west of Chalhuanca, is not only the result of syn-sedimentary folding but also due to compressive tectonics that affect large tracts of the Peruvian Andes during the Eocene [Benavides‐Cáceres, 1999].
[75] The magnetic lineations of the Chalhuanca Tertiary
red beds have the same anomalous orientation than the anomalous SW‐NE fold axes in the Mesozoic units. More-over, the large counterclockwise rotation recorded by the Tertiary rocks is also observed in the Mesozoic rocks at sites 71 and 72. We can thus speculate that the block affected with the∼65° counterclockwise rotation corresponds to the whole area, with anomalous SW‐NE fold trends, that is traceable to the west for at least 50 km.
7.3. Timing of the Tectonic Rotations
[76] Arriagada et al. [2008] attempted to reconstruct the
evolution of the Bolivian orocline using plane view resto-ration of the deformation and rotations. While the tectonic constraints are relatively good for the last 15 Myr, geological constraints on the amount of shortening are less numerous for Andean deformation older than 15 Ma. This led Arriagada et al. [2008] to test two models of deformation attributed to a broad Incaic deformation event. Our new paleomagnetic results provide additional constraints on the timing of the deformation.
[77] The maximum age of the large rotations in the
Chalhuanca area are constrained by the preliminary ages of the dikes to late Eocene because the dikes record the same Figure 13. Summary of paleomagnetic results in the Chalhuanca‐Cuzco area including results shown by
Roperch et al. [2010]. (a) Tectonic rotations determined from the ChRM directions. (b) AMS lineations. (c) Oroclinal test with tectonic rotations versus strike of bedding (gray circles) or versus AMS lineations (red circles); (d) AMS lineations unrotated using the tectonic rotations calculated for each site.
rotation than the country rocks. This lower boundary for the age of the rotation is in agreement with the one determined from the late Eocene red beds of the Moquegua Group along the fore arc [Roperch et al., 2006]. This demonstrates that rotations are not related to the postulated late Cretaceous “Peruvian” phase of deformation or the Incaic I orogenic pulse dated as late Paleocene‐early Eocene (59–55 Ma) [Steinmann, 1929; Mégard, 1984]. In northern Peru, rota-tions in volcanics rocks overlying unconformably deformed Cretaceous strata also postdate the first stages of deforma-tion [Mitouard et al., 1992]. In southern Peru, Carlotto et al. [2005] also attribute the onset of the major deformation to the Incaic II pulse of late middle Eocene age (∼42 Ma) (see review by Benavides‐Cáceres [1999]).
[78] In central Peru, the Incaic fold and thrust belt is
stretched between the coastal block containing the Late Cretaceous magmatic belt and the Eastern Cordillera to the east. The Incaic belt is deflected to the east by the Abancay
deflection and south of Cuzco, it can be traced along the eastern Cordillera of southern Peru where Mesozoic rocks area highly folded and thrusted and form the Huancane fold and thrust belt or the Putina belt. Deformation in the Putina belt is usually associated to the Incaic II phase of defor-mation. The Incaic deformation is also recognized along the Chilean fore arc and several studies have reported evidence for Eocene deformation in the Eastern Cordillera of Bolivia. The recent thermochronological studies [Barnes et al., 2008] and field observations indicate the beginning of the deformation at the end of Eocene [Elger et al., 2005; Ege et al., 2007; Oncken et al., 2006]. Taking into account that the magnetic fabric was acquired prior to the large counter-clockwise rotations about vertical axis and that the magnetic fabric is likely associated with the early stages of shortening during the late Eocene, this suggests that the lowermost estimate of the age of the rotation is early Oligocene. In the Eastern cordillera of southern Peru, late Oligocene volcanism Figure 14. Summary of tectonic rotations in the Peruvian Andes. Squares correspond to this study.
References to circles are given by Roperch et al. [2006]. The Incaic fold and thrust belt corresponds to the belt of folded and thrusted Mesozoic rocks, including the highlighted Putina area. Paleozoic rocks from the Eastern Cordillera record several phases of deformation and were also likely affected by the late Paleogene Incaic deformation. The Andahuaylas‐Yauri magmatic belt (shown in orange) is mainly located within the Abancay deflection. The absence of major known structures between the fore‐arc area at 16°S and Puquio suggests that the event of large counterclockwise rotations along the fore arc ended prior to the emplacement of the early Miocene volcanics near Puquio.
postdates the late Eocene phase of deformation [Laubacher et al., 1988; Sandeman et al., 1995].
[79] Counterclockwise rotations of 10 to 15° have been
detected in Miocene rocks to the northwest of our study area (Ayacucho area [Rousse et al., 2002], Ocros dike swarm [Heki et al., 1985] and these results may be interpreted as evidence that the main phase of rotation like the one in the Chalhuanca area occurred prior to the Miocene. However, the large var-iation in the magnitude of rotation from Chalhuanca to Cuzco also indicates that paleomagnetic observations on Miocene rocks and older rocks from the same structural block are needed to constrain the upper limit of the age of rotation.
[80] Except the geochemical boundary defined by Mamani
et al. [2008] (Figure 1), no major fault has been identified in between Puquio and the fore‐arc areas, ∼150 km to the south of Puquio, for which Roperch et al. [2006] report large counterclockwise rotations in Eocene red beds (Figure 14). Thus, results from the Puquio area provide additional evi-dence that most rotations along the fore arc occurred before the early Miocene [Roperch et al., 2006].
7.4. Tectonic Rotations and Emplacement of the Andahuaylas‐Yauri Batholith
[81] During the Late Cretaceous and the Paleocene, the
volcanic arc was located mainly along the fore arc with the
emplacements of the Toquepala volcanics near Moquegua and of granodiorites in the Arequipa area [Mukasa, 1986] (Figures 1 and 15). In middle and late Eocene, the magmatic arc in southern Peru corresponds to the Andahuaylas plutonic complex and is located 100 to 200 km to the east of the Paleocene arc (Figure 15) [Mamani et al., 2008]. In contrast, the late Eocene magmatic arc in northern Chile is in a position close from that occupied during the Paleocene. In the late Eocene–early Oligocene, large porphyry copper deposits (Escondida, Chuquicamata, Collahuasi) are emplaced along the Chilean Andes between 24 and 21°S. Connection between this belt of copper deposits and the many late Eocene–early Oligocene Cu‐Fe skarns and deposits of the Andahuaylas‐Yauri arc is difficult because the structures are covered by Neogene volcanism of the Western Cordillera (Figure 1). The fact that porphyry coppers have a very reduced space‐time distribution suggests a style of subduc-tion different from that of the current mode under the central Andes. For example, localization of copper deposits of late Miocene–Pliocene age is closely related to horizontal sub-duction under central Chile.
[82] To explain the anomalous position of the Eocene‐
Oligocene magmatism in southern Peru, Noble et al. [1984] and James and Sacks [1999] proposed a model based on the changing geometry of the subduction. New models of plate Figure 15. Summary of the geodynamic evolution of the southern Peruvian Andes since the middle
Eocene. The Abancay line limits domains of central and southern Peru with different paleogeographic evolution [Carlotto et al., 2009] and the protodeflection was enhanced during Tertiary Andean defor-mation. A flat slab episode was proposed by James and Sacks [1999].