HAL Id: hal-00316645
https://hal.archives-ouvertes.fr/hal-00316645
Submitted on 1 Jan 1999
HAL is a multi-disciplinary open access
archive for the deposit and dissemination of sci-entific research documents, whether they are pub-lished or not. The documents may come from teaching and research institutions in France or abroad, or from public or private research centers.
L’archive ouverte pluridisciplinaire HAL, est destinée au dépôt et à la diffusion de documents scientifiques de niveau recherche, publiés ou non, émanant des établissements d’enseignement et de recherche français ou étrangers, des laboratoires publics ou privés.
R. Meerkötter, U. Schumann, D. R. Doelling, P. Minnis, T. Nakajima, Y.
Tsushima
To cite this version:
R. Meerkötter, U. Schumann, D. R. Doelling, P. Minnis, T. Nakajima, et al.. Radiative forcing by contrails. Annales Geophysicae, European Geosciences Union, 1999, 17 (8), pp.1080-1094. �hal-00316645�
Radiative forcing by contrails
R. MeerkoÈtter1, U. Schumann1, D. R. Doelling2, P. Minnis2, T. Nakajima3, Y. Tsushima3
1DLR Oberpfaenhofen, Institut fuÈr Physik der AtmosphaÈre, Wessling, Germany
E-mail: [email protected]
2NASA Langley Research Center, Hampton, Virginia, USA
3Center for Climate System Research, University of Tokyo, Tokyo, Japan
Received: 5 June 1998 / Revised: 25 November 1998 / Accepted: 14 December 1998
Abstract. A parametric study of the instantaneous radiative impact of contrails is presented using three dierent radiative transfer models for a series of model atmospheres and cloud parameters. Contrails are treat-ed as geometrically and optically thin plane parallel homogeneous cirrus layers in a static atmosphere. The ice water content is varied as a function of ambient temperature. The model atmospheres include tropical, mid-latitude, and subarctic summer and winter atmo-spheres. Optically thin contrails cause a positive net forcing at top of the atmosphere. At the surface the radiative forcing is negative during daytime. The forcing increases with the optical depth and the amount of contrail cover. At the top of the atmosphere, a mean contrail cover of 0.1% with average optical depth of 0.2
to 0.5 causes about 0.01 to 0.03 Wm)2 daily mean
instantaneous radiative forcing. Contrails cool the surface during the day and heat the surface during the night, and hence reduce the daily temperature ampli-tude. The net eect depends strongly on the daily variation of contrail cloud cover. The indirect radiative forcing due to particle changes in natural cirrus clouds may be of the same magnitude as the direct one due to additional cover.
Key words. Atmospheric composition and structure (aerosols and particles) á Meteorology and atmospheric dynamics (climatology, radiative processes)
1 Introduction
Contrails are ice clouds with radiative eects similar to thin cirrus cloud layers (Liou, 1986; Raschke et al., 1998). They are short-lived when formed in dry air but
persist and develop into extended cirrus cloud layers when the ambient air is moist with relative humidity above ice saturation. Individual contrails have been observed to persist for many hours (Minnis et al., 1998). Satellite data reveal that persistent line-shaped contrail clouds cover at least 0.5% of central Europe at noon time in the annual average (Mannstein et al., 1999). An analysis of meteorological data and aircraft fuel con-sumption data resulted in an estimate that such contrails cover about 0.1% of the globe with maximum cover values over the USA, Europe, the North Atlantic and the Indonesian area (Sausen et al., 1998). The actual contrail cover is larger than suggested by line-shaped contrails in satellite pictures (Minnis et al., 1998). Like thin layers of cirrus clouds, contrails are expected to enhance the `greenhouse eect' because they reduce outward longwave (LW) ¯ux more than they increase re¯ected shortwave (SW) ¯uxes (Platt, 1981; Stephens and Webster, 1981). However, measurements of downward ¯uxes below contrails from aircraft (Kuhn, 1970) and at the Earth' surface (Sassen, 1997) revealed rather large reductions in downward SW ¯ux in the shadow of individual contrails with little gain by infrared radiation leaving open the question of warming or cooling by contrails (Khvorostyanov and Sassen, 1998).
The radiative properties of cirrus clouds have been investigated in several studies (Ackerman et al., 1988; Rockel et al., 1991; Ebert and Curry, 1992; Fu and Liou, 1993). However, contrails dier from cirrus clouds in having relatively small vertical depth and occur mainly at temperatures below a threshold of order )40 °C (Schumann, 1996). Therefore, the ice water content (IWC) and ice water path (IWP) of contrails is smaller than for average cirrus clouds. On the other hand, contrails are formed from aircraft emissions which induce more and smaller ice particles in fresh contrail clouds (KaÈrcher et al., 1996; Petzold et al., 1997) so that the optical depth of contrails may be larger than that of cirrus with the same IWC. Aircraft emissions may also have indirect eects by modifying the microphysical
properties of cirrus clouds (StroÈm and Ohlsson, 1998b). The eect of aircraft aerosol in causing additional cirrus clouds, possibly long after emission, has not yet been determined.
Only a few studies have investigated the special radiative forcing properties of contrails (Grassl, 1990; Fortuin et al., 1995, Strauss et al., 1997). A systematic parametric study, covering the properties of contrails for various atmospheric conditions and seasons and for dierent trac regions of the Earth, has not yet been reported. The indirect eect of changing particle sizes has been examined recently by Wyser and StroÈm (1998). In this study, we apply one-dimensional radiative transfer models for a sequence of relevant cases to determine the instantaneous or static radiative forcing (IPCC, 1996) for given cloud cover and ®xed ambient conditions in the form of aircraft induced cirrus clouds. The next section reviews the available knowledge that guides this study. The methods used, the cases consid-ered, and the results obtained in this study are presented and discussed thereafter, including a discussion of the indirect eect of aircraft by changing particle properties in cirrus clouds.
2 Radiative properties of contrails
The radiative properties of contrails depend on many parameters. Only a few recent studies have provided data suitable for modeling contrail radiative eects. Contrails are radiatively important only if formed in ice-supersaturated air, where they may persist and spread to several kilometers lateral width and a few hundred meters vertical depth (Detwiler and Pratt, 1984; Schum-ann and Wendling, 1990; Freudenthaler et al., 1995, 1996; Sassen, 1997; JaÈger et al., 1998). In the solar range (near a wavelength of 0.55 lm), the optical depth of observed persistent contrails varies typically between 0.1 and 0.5 (KaÈstner et al., 1993; JaÈger et al., 1998; Minnis et al., 1998; Sassen, 1997). Occasionally, very thick contrails (order 700 m) with optical depth greater than 1.0 are found at higher temperatures (up to )30 °C) (Schumann and Wendling, 1990, Gayet et al., 1996). Contrail particles in young persistent contrails are typically smaller (mean radius of 5 to 15 lm) than in other cirrus cloud types (greater than about 30 lm) (Betancor-Gothe and Grassl, 1993; Brogniez et al., 1995; Gayet et al., 1996; SchroÈder et al., 1998). The number
density of ice crystals in contrails (order 10 to 200 cm)3)
is much larger than in cirrus clouds (Sassen, 1997; SchroÈder et al., 1998). The few measured values of the
IWC in aged contrails vary between 0.7 and 18 mg m)3
(Gayet et al., 1996; Sassen, 1997; SchroÈder et al., 1998), consistent with numerical studies (Gierens, 1996; Khvorostyanov and Sassen, 1998).
The shape of contrail particles is important because clouds with aspherical particles may have smaller asymmetry factors causing a stronger solar albedo (Wendling et al., 1979; Kinne and Liou, 1989; Liou et al., 1998; Raschke et al., 1998). Strong depolarization of Lidar returns by contrails with growing particles that
are a few minutes old indicate aspherical particles (Freudenthaler et al., 1996, Sassen, 1997). Both, com-plex ice particles (Goodman et al., 1998, Lawson et al., 1998) and nearly spherical ice particles at low ambient temperatures (<)55 °C) using replicators in contrail cirrus (SchroÈder et al., 1998) were identi®ed. It seems that the amount of water vapor available in the core of contrails is too small, in particular at low temperatures, to let very many ice particles grow. Hence the particles in the core remain close to spherical while the particles near the humid boundary of contrails may become large and very complex in shape in particular at high ambient temperature and humidity (Heyms®eld et al., 1998a). The large in¯uence of particle shape on the scattering phase function was demonstrated in measurements (Gayet et al., 1998) and computations (Liou et al., 1998; Raschke et al., 1998; Lawson et al., 1998).
Contrail particles have been found to contain soot (Kuhn et al., 1998; Petzold et al., 1998; StroÈm and Ohlsson, 1998a, b). Soot in or on the ice particles may increase absorption of solar radiation by the ice particles and hence reduce the albedo of the contrails. The importance of the soot depends on the type of internal or external mixing and the volume fraction of soot enclosures (e.g., Chylek and Hallett, 1992). Since soot particles are typically less than 1 lm in diameter, their impact on the optical properties of the ice particles in aged contrails is likely small.
The day/night contrail cover ratio is of importance for the mean forcing because SW cooling is restricted to the daytime period while the LW heating acts all day. Diurnal coverage ratios of about 2 (Bakan et al., 1994) over Europe and the eastern part of the North Atlantic, or 3 (Mannstein et al., 1998) over central Europe have been deduced from satellite data consistent with a global mean noon/midnight trac ratio of 2.8 (Schmitt and Brunner, 1997).
The change in radiative ¯uxes due to contrails has been computed with one-dimensional (1-D) models (Fortuin et al., 1995; Strauss et al., 1997). These studies treat contrails as a plane-parallel cloud in a homoge-neously layered atmosphere and use area-weighted sums for fractional contrail cover. As a consequence, the contrail forcing grows linearly with contrail cover in these models. Inhomogeneity eects may be large in natural cirrus (Raschke et al., 1998), but were consid-ered small for vertically thin cloud layers in the few studies addressing this issue (Fouquart et al., 1990; Schulz, 1998). Fortuin et al. (1995) computed the radiative forcing by contrails for ®xed atmospheric temperatures for the North Atlantic ¯ight corridor. Normalized to 100% contrail cover, a net forcing in the
range of )30 to +60 Wm)2is found in summer and 10
to 60 Wm)2in winter. They used a highly parametrized
radiative transfer model for cirrus with IWP values in
the range of 4 to 50 g m)2 and crystal radius of 4 to
100 lm, implying optical depth values of 0.05 to 20. They found a strong dependence on particle radius but do not discuss the accuracy of the model. The negative forcing values are computed for large IWP and small radius values. Wyser and StroÈm (1998) used a similar
model and discuss the particle impact in detail. Strauss et al. (1997) used a radiative convective model to simulate the climatic conditions of a mid-European region. They consider contrails and natural cirrus clouds with measured size spectra, but the particle size dier-ence between the two cloud types considered is small (less than 20% in eective radius) so that the net radiative forcing for the two cloud types diers only a
little. They ®nd about 30 Wm)2radiative ¯ux change at
the tropopause for 100% contrail cover with optical depth of 0.28 at 0.55 lm; and a surface temperature increase on the order 0.05 K for a 0.5% increase in current contrail cloud cover. With a 2-D radiative convective model, a 1 K increase was found in surface temperature over most of the Northern Hemisphere for an additional cirrus cover of 5% (Liou et al., 1990). Using a global circulation model, the potential eects of contrails on global climate were simulated by introduc-ing additional cirrus cover with the same optical properties as natural cirrus in air trac regions with large fuel consumption (Ponater et al., 1996). The induced temperature change was signi®cant for 5% additional cirrus cloud cover in the main trac regions. These studies demonstrate the importance of contrails in climate change and highlight the need for better understanding of the sensitivity of their radiative prop-erties to all relevant parameters.
3 Methods and parameters 3.1 Methods
In this section we present results of computations with 1-D radiative transfer models. The study uses three models, which we denote M, FL, and N, to quantify the sensitivity of the results to various established radiative techniques.
The model M is based on the matrix-operator-method (MOM) developed by Plass et al. (1973). The solar and terrestrial versions of this code performed successfully in an intercomparison of radiation codes (Ellingson and Fouquart, 1990). Fischer and Grassl (1984) described the shortwave version. The longwave version has successfully been applied in a comparison of modeled and measured broadband ¯uxes from aircraft data (Saunders et al., 1992). In the solar spectral range, the radiative transfer code accounts for multiple scat-tering and absorption processes related to air molecules, aerosol/cloud particles, the absorbing gases, and the surface, in the longwave range additionally for the thermal emission of the relevant constituents. The solar spectral range, from 0.2±4 lm, is divided into 25 wavelength intervals, the terrestrial spectral range from 4±100 lm into 28 intervals. Average transmission func-tions accounting for gaseous absorption in the wave-length intervals are approximated by exponential sum ®tting. The transmission functions result from line-by-line calculations based on the HITRAN-86 data base (Rothman et al., 1987). The spectral extraterrestrial sun in the solar range is extracted from data incorporated in
the LOWTRAN-7 radiative transfer code (Kneizys et al., 1988). The spectral optical parameters of ice clouds and aerosol particles are represented in each wavelength interval by the phase function (solar range), the asym-metry factor (terrestrial range), the volume extinction coecient, and the single scattering albedo. For spher-ical particles, the spectral optspher-ical parameters are computed using Mie-theory on the basis of given particle size distributions and spectral complex refractive indices. In case of cirrus clouds/contrails, the refractive indices for ice according to Warren (1984) have been used, the refractive indices of the dierent aerosol components (Sect. 3.2) stem from WMO (1986). The properties of hexagonally shaped particles are taken into account only for the solar region and computed assuming geometrical optics (Hess and Wiegner, 1994). Strauss et al. (1997) describe the procedure and its application for contrails with the same size spectrum as used here (and for a cirrus with slightly dierent size spectrum). The calculations have been performed by the ®rst author.
The model FL uses the radiative transfer code of Fu and Liou (1993) in the delta-4-stream model version (Liou et al., 1998), including scattering and gaseous absorption of both LW and SW radiation. Although the model is highly resolved for absorption and scattering by gases and aerosols in both SW (54 bands) and LW (67 bands) spectra, it uses only 6 SW bands and 12 LW bands to compute particulate scattering and absorption and surface emissivities and albedos. The model has also been tested during the intercomparison of radiation codes (Ellingson and Fouquart, 1990) and applied for cloud studies (Charlock et al., 1995). It uses spherical particles for liquid water at all wavelengths. For ice particles in the LW spectrum, the optical properties are computed using geometrical optics for hexagonal ice columns for size parameters less than 30 and a spheroi-dal approximation for smaller size parameters. In the SW regime, it uses optical properties resulting from randomly oriented columnar hexagon ray-tracing cal-culations for all particles. The calcal-culations have been performed by the third author.
The model N is a radiative transfer code (Nakajima and Tanaka, 1986, 1988) including scattering and gaseous absorption using the delta-4-stream approximation, 400 bands in the shortwave range and 8000 bands in the longwave range with spectral data as in Kneizys et al. (1988). The model treats spherical particles or hexagonal particles as in Fu and Liou (1993). The calculations have been performed by the sixth author.
The methods are used to compute the sum of upward and downward ¯uxes in the SW and LW spectral range and the net ¯uxes (sum of SW and LW ¯uxes) at the TOA (actually 50 km), above the contrail layer, and at the surface (0 km altitude). The static radiative forcing is the dierence in the ¯uxes at a certain level with and without inclusion of the contrail layer for otherwise constant conditions. A positive forcing at a certain altitude implies an energy gain of the system below that level. The results of these computations scale linearly with cloud cover.
3.2 Parameter values
The set of parameters necessary to assess the radiative impact of contrails consists of the vertical temperature, humidity, and aerosol pro®les, surface temperature and its diurnal cycle, the altitude and geometrical thickness of the contrails, cloud cover, IWC, size spectra and the shape of the particles, surface scattering properties, latitude and the time of year determining solar zenith angle (SZA), and the daily variation of the contrail cover.
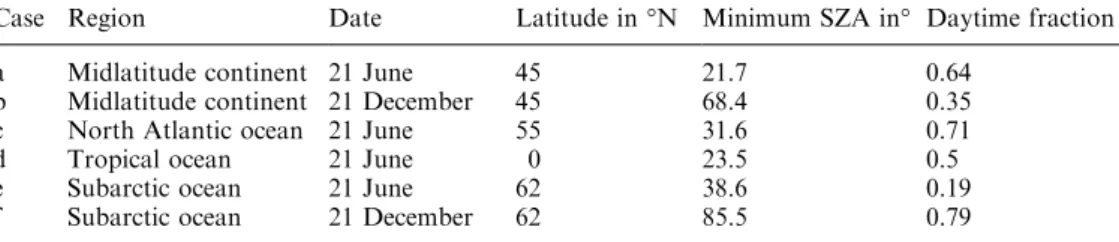
The parameters are speci®ed according to the cases listed in Table 1. They cover the regions of most intense air trac. The midlatitude continental summer, (a) is used as the reference case in the following. Case (d) is de®ned to approximate the Indonesian Equatorial region where a local maximum of contrail cover is expected (Sausen et al., 1998). The latitude 62°N of the subarctic cases (e) and (f) covers the northern edge of the main trac routes. It lies just south of the polar circle. The surface properties in the solar range are approx-imated by Lambertian surface re¯ection with spectrally constant albedo. In the infrared range the surfaces are assumed to emit as black bodies in each wavelength interval. For the continental surfaces of cases (a) and (b), the surface albedo is taken as 0.2 (0.7 with snow cover). For the maritime cases (c), (d), (e), and (f), a value of 0.05 is chosen to represent a typical ocean albedo (except for the subarctic winter case with an ice albedo of 0.7).
The temperature and humidity pro®les are speci®ed for the selected regions and seasons as in the corre-sponding standard atmospheres of McClatchey et al. (1972). The surface temperature is kept temporally constant and equals the atmospheric temperature at the surface unless speci®ed dierently. The midlatitude continental summer atmosphere speci®es 77% relative humidity at the surface, decreasing to 11% at the tropopause (12 km).
For model M, the aerosol properties are speci®ed following WMO (1986). To calculate spectral phase functions and spectral optical parameters appropriate for the air mass of the midlatitude continental summer and winter atmospheres, the microphysical properties of the aerosol components connected to the pro®le `CONT-I' of Table 2.3 in (WMO, 1986) are used. The pro®le is a composition of the aerosol types continental
(0±12 km) and 75% H2SO4above 12 km. For the North
Atlantic, tropical ocean, and subarctic summer and winter cases, the aerosol properties are calculated using the aerosol pro®le `MAR-I' of WMO (1986), with
maritime aerosol (0±2 km), continental (2±12 km), and
75% H2SO4above 12 km. The 0.55-lm optical depth of
the maritime aerosol (surface to 50 km) is 0.08, that of the continental aerosol is 0.28. In model FL, aerosols are speci®ed with the same total column optical depth as for model M but using a Spinhirne (1991) distribution based on humidity. Scattering properties are based on either maritime or continental aerosols. Model N is applied without aerosols.
The model results depend critically on the assumed ice water content values. Up to now, no systematic study of IWC values in contrails is available. As observed for cirrus clouds (Heyms®eld and Platt, 1984), the IWC of contrails may depend on ambient temperature because the amount of water available between liquid and ice saturation increases with temperature for temperature less than )12 °C (Ludlam, 1980). Contrails with small particles have little chance for precipitation and, hence, may contain more ice than aged cirrus clouds. For modeling, we assume that the IWC is determined by a fraction (1/2) of the amount of water available for ice formation between the limit of ice nucleation and ice saturation. Heyms®eld et al. (1998b) ®nd that the limit for ice nucleation decreases almost linearly with respect to relative humidity (RH) from water saturation (100% RH) at temperatures above )39 °C to 75% RH at and below )55 °C. In principal, the IWC will depend on many other atmospheric parameters and may exceed the limit of potential IWC at a given level when contrails form in rising air.
Figure 1 compares the IWC of the model contrail as a function of temperature with the IWC in cirrus clouds as obtained from measurements over Wisconsin (a), various places in the USA (b), and in a tropical cirrus (c), using interpolations as given in Heyms®eld (1993). Curve (d) (Stephens et al., 1990; correction in Sinha and Shine, 1994) ®ts earlier data from midlatitude cirrus over the USA (Heyms®eld and Platt, 1984). Individual IWC values measured in cirrus clouds may deviate from the curves by more than a factor of ten. We see that the model gives IWC values which are slightly greater than the values measured in natural cirrus clouds. Figure 1 also shows the few data points which are available from direct measurements in aged contrails (Gayet et al., 1996; Sassen, 1997; SchroÈder et al., 1998). While the data of Sassen and SchroÈder support the IWC model within reasonable limits, Gayet et al. (1996) ®nd IWC values at various altitudes in a single contrail that are smaller and decrease with temperature. Deviations between the measured IWC values and any systematic trend are not surprising because of the diculties in
Table 1. Cases (a) to (f)
Case Region Date Latitude in °N Minimum SZA in° Daytime fraction a Midlatitude continent 21 June 45 21.7 0.64
b Midlatitude continent 21 December 45 68.4 0.35 c North Atlantic ocean 21 June 55 31.6 0.71
d Tropical ocean 21 June 0 23.5 0.5
e Subarctic ocean 21 June 62 38.6 0.19 f Subarctic ocean 21 December 62 85.5 0.79
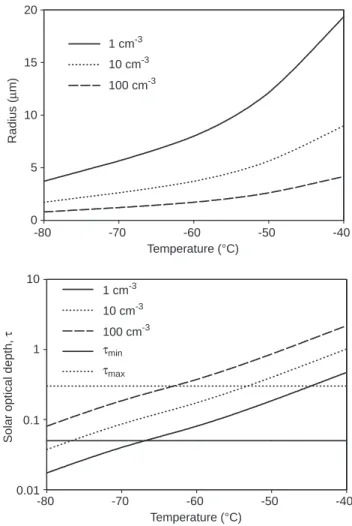
measuring IWC inside a contrail, which are due to the shortcomings of the various sensors and the represent-ativity of such measurements in a contrail cloud which is highly heterogeneous spatially. Figure 2a shows the volume mean radius of ice particles as it would result for monodisperse ice particles of typical ice particle con-centrations in contrails and the modeled IWC. Fig-ure 2b shows the optical depth s which a cloud of 200 m geometrical thickness which is composed of these particles would have for an optical extinction eciency of 2. As can be seen, the range of computed values is consistent with data from measurements as cited in Sect. 2 and indicates that the IWC estimate is reason-able. As expected, the computed particle sizes vary by a
factor 1001/3 = 4.6 for a factor 100 variation in particle
concentration, and are within the range of particle sizes reported. The computed optical depth matches the range of 0.05 to 0.3 measured by JaÈger et al. (1998). It would match even better if the particle concentration decreased with temperature, which may well be the case due to reduced nucleation rates at higher ambient temperatures (KaÈrcher et al., 1996). Unfortunately, the temperature dependence of contrail particle radius, concentration, and optical depth values has not been documented. Obviously, many more measurements are needed for reliable estimates of IWC in contrails.
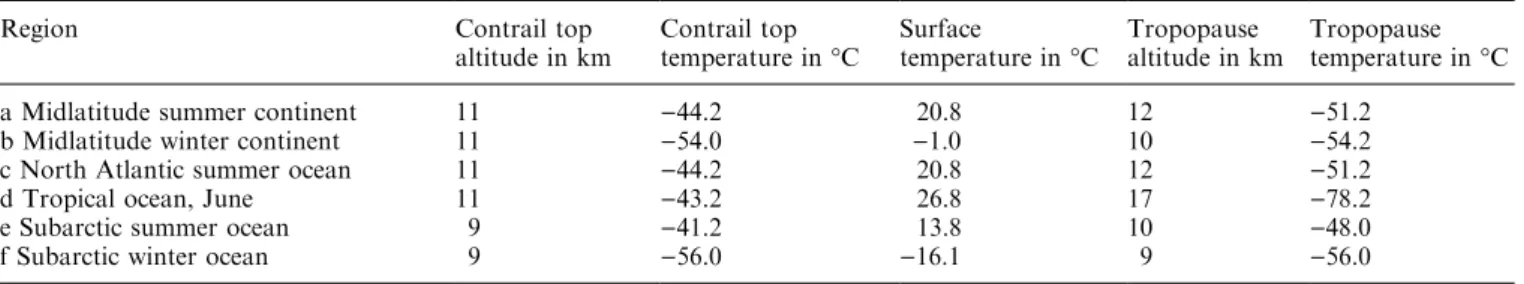
Table 2 characterizes the various cases in terms of contrail layer altitudes and relevant temperatures. The contrail is represented as a temporally constant cloud cover of thin cirrus of 200 m vertical depth between 10.8 and 11 km altitude (except for the subarctic atmo-spheres with contrails located between 8.8 to 9 km) with a realistic particle size spectrum as given by Strauss et al. (1997) (volume-mean particle diameter = 16.4 lm). In
the reference case, the IWC is 21 mg m)3, the ice water
path is IWP = 4.4 g m)2, and the optical depth is
s 0:52.
The reference case assumes spherical ice particles mainly for simplicity but also because contrail particles have been found to be about spherical when collected on impactors at least in young contrails and at low ambient temperatures (SchroÈder et al., 1998). On the other hand, observations (see Sect. 2), indicate that contrail particles deviate from spherical shape after some time in aging contrails in particular at high ambient temperatures. Therefore, calculations are also performed with clouds of hexagonal particles of the same IWC.
4 Results
The shortwave (SW), longwave (LW), and net radiative ¯ux changes are listed in Table 3 for reference case a), see Tables 1 and 2, as computed with model M for spherical and model FL for hexagonal ice particles at three levels of the atmosphere. Table 3 shows daily means of the instantaneous values that are computed as
Fig. 1. Ice water content (IWC) versus ambient temperature. The solid curve is the proposed contrail IWC model of this study. The various dashed curves represent ®ts to IWC values observed in cirrus over (a) Wisconsin, (b) various parts of continental USA, (c) tropical cirrus (Heyms®eld, 1993) and a ®t (d) (Stephens et al., 1990; Sinha and Slingo, 1994) for midlatitude cirrus data of Heyms®eld and Platt (1984). The symbols denote individual IWC data measured in aged contrail cirrus by Gayet et al. (1996), by the Desert Research Institute (see Sassen, 1997), and SchroÈder et al. (1998)
0 5 10 15 20 -40 -40 -50 -50 -60 -60 -70 -70 -80 -80 1 cm-3 1 cm-3 10 cm-3 10 cm-3 100 cm-3 100 cm-3 Radius ( m) µ Temperature (°C) Temperature (°C) τmax τmin 0.01 0.1 1 10
Solar optical depth,
τ
Fig. 2a, b. Particle radius and solar optical depth s versus temper-ature for a 200 m thick contrail for three values of particle number concentration of monodisperse particles. IWC as given by the solid curve of Fig. 1, and extinction eciency of 2. The two horizontal lines in the lower panel denote the range of data s 0:05 to 0.3) obtained by JaÈger et al. (1998)
averages over 24 hours including the diurnal variation of the solar zenith angle on 21 June at 45°N for 100% cloud cover. Also listed is the daytime mean of the net forcing. The daytime mean is the average over the period from sunrise to sunset (see Table 1 for daytime fraction), whereas the daily mean is the average over the 24 hours of a day. The daytime mean SW forcing equals the daily mean divided by the daytime fraction. The nighttime mean equals the LW forcing, which is constant throughout the day because of assumed constant temperatures.
In the reference case, a constant 100% contrail cover with spherical particles causes a positive static radiative
forcing in the daily average of about 40 Wm)2. The
TOT (top of troposphere) value is slightly larger, indicating a slight cooling of the stratosphere. The TOA and TOT ¯ux changes due to contrails dier by only about 10%. When adjusting the stratospheric temperature to the change in net radiative forcing, the TOA and TOT forcing values are expected to become equal and equal to a value in between the static TOA and TOT values. Hence, the static TOA ¯ux change gives a reasonable approximation for the adjusted radiative forcing considered in IPCC (1996). At the surface, the LW ¯ux changes are much smaller because of strong absorption by water vapour, while the SW ¯ux changes are only a little smaller than at TOA because the atmosphere is largely transparent to solar radiation. The net ¯ux change is negative at the surface, as observed by Sassen (1997), but smaller in magnitude than at TOA. The day time SW contribution dominates and cools the surface also in the daily mean. During daylight only, the net forcing is about 20 to 30% smaller, but still positive for TOA. At the surface, the daytime mean net forcing is negative and more than a
factor of 2 larger than the daily mean. Hence, the surface forcing depends strongly on the daily cycle of contrail cover.
The results of the parametric study for various regions, seasons and particle shapes are shown in Table 4, as computed with models M and D. The contrails cause negative SW and positive LW ¯ux changes. For reasons to be discussed in Sect. 5, the magnitude of the SW forcing is larger over dark ocean areas than over bright snow surfaces, while the LW forcing is larger in the tropics than in polar regions. The net forcing over the midlatitude continent is larger in summer than in winter. In all cases considered the net forcing is positive, suggesting that contrail heating of the atmosphere prevails over cooling. Hexagonal particles cause a more negative SW forcing and less net forcing, therefore.
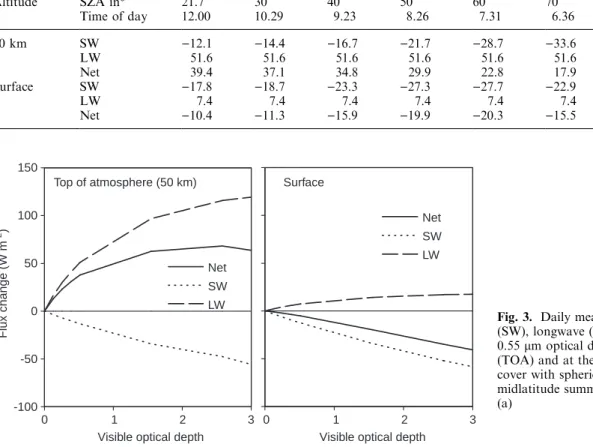
The net ¯uxes depend strongly on the assumed IWP or optical depth. Figure 3 shows the computed SW, LW and net change in radiative ¯uxes at TOA and at the surface for 100% contrail cloud cover for the reference case with spherical particles as computed with model M. The IWC was varied to yield dierent values of the optical depth s at 0.55 lm. At TOA, the LW forcing is larger than the SW. The net radiative forcing grows linearly with s for small values of s but soon approaches
a maximum of about 60 Wm)2 near s 3 (IWP of
about 25 g m)2). The exact value of this maximum
depends on details of the particle properties, cloud location, temperature, surface properties, and time of year. For larger values of s the net forcing decreases and
becomes negative in our case for s > 10
(IWP > 80 g m)2), but contrails are probably never
that thick. Our results are qualitatively very similar to those for cirrus clouds presented by Rockel et al. (1991), Fu and Liou (1993), Jensen et al. (1994), Fortuin et al. (1995), and Strauss et al. (1997), who report maximum
net forcing values of 30 to 80 Wm)2at comparable IWP
or optical depth values. The quantitative dierences are likely the result of dierent case speci®cations. Based on this analysis, contrails are expected to heat the atmo-sphere below them.
In the diurnal cycle, radiative forcing by contrails at TOA is positive and strongest during night. For small optical depth, the net forcing at TOA is also positive during day and, hence, always positive regardless of the diurnal cycle of contrail cover. As can be seen from Table 5 and Fig. 4, for an optical depth of 0.52, the negative SW forcing at TOA is maximum not at noon
Table 3. Daily mean (24 h) and daytime mean (from sunrise to sunset) radiative ¯ux changes in the midlatitude summer con-tinental case at top of the atmosphere (TOA, 50 km), top of troposphere (TOT, 12 km), and at the surface (SUR, 0 km) in Wm)2. Results from model M for spherical particles
Altitude Daily mean Daytime mean
SW LW Net SW LW Net
TOA )13.4 51.6 38.2 )21.0 51.6 30.6 TOT )13.8 55.6 41.8 )21.5 55.6 33.1 SUR )12.7 7.4 )5.3 )20.0 7.4 )12.6
Table 2. Contrail and tropopause altitude and temperature values for cases (a) to (f)
Region Contrail top
altitude in km Contrail toptemperature in °C Surfacetemperature in °C Tropopausealtitude in km Tropopausetemperature in °C a Midlatitude summer continent 11 )44.2 20.8 12 )51.2
b Midlatitude winter continent 11 )54.0 )1.0 10 )54.2
c North Atlantic summer ocean 11 )44.2 20.8 12 )51.2
d Tropical ocean, June 11 )43.2 26.8 17 )78.2
e Subarctic summer ocean 9 )41.2 13.8 10 )48.0
but during morning or afternoon hours when the solar zenith angle is near 60 to 70°. The dierence between spherical and hexagonal particles is largest around noon at smallest SZA. Kinne and Liou (1989) ®nd similar results for thin cirrus clouds. They ®nd that the net forcing may become even negative near solar zenith angles of 50 to 80° in case of cirrus clouds of large
hexagonal ice crystals. We, too, ®nd smaller, but still positive values (possibly because of a dierent particle size spectrum) of the net forcing at TOA for large zenith angles when using hexagonal particles (model M), see Fig. 4a.
Other than at TOA, the net ¯ux change is negative at the surface even for thin contrails during the day,
-100 -50 0 50 100 150 3 3 2 2 1 1 0 0 LW LW SW SW Net Net Top of atmosphere (50 km) Surface
Visible optical depth Visible optical depth
Flux change (W m
)
-2
Fig. 3. Daily mean instantaneous shortwave (SW), longwave (LW), and net forcing versus 0.55 lm optical depth at 50 km altitude (TOA) and at the surface for 100% contrail cover with spherical ice particles for the midlatitude summer continent reference case (a)
Table 5. Variation of the shortwave (SW), longwave (LW) and net radiative ¯ux change in Wm)2as a function of solar zenith angle
(SZA) and morning hours, results of model M for spherical
particles, for the reference case (midlatitude summer continent), at TOA and at the surface. The value SZA = 21.7° is the minimum value on 21 June at 45°N
Altitude SZA in° 21.7 30 40 50 60 70 80 90
Time of day 12.00 10.29 9.23 8.26 7.31 6.36 5.35 <4.29 50 km SW )12.1 )14.4 )16.7 )21.7 )28.7 )33.6 )28.1 0 LW 51.6 51.6 51.6 51.6 51.6 51.6 51.6 51.6 Net 39.4 37.1 34.8 29.9 22.8 17.9 23.4 51.6 Surface SW )17.8 )18.7 )23.3 )27.3 )27.7 )22.9 )12.9 0 LW 7.4 7.4 7.4 7.4 7.4 7.4 7.4 7.4 Net )10.4 )11.3 )15.9 )19.9 )20.3 )15.5 )5.5 7.4
Table 4. Daily mean TOA radiative ¯ux changes for shortwave (SW), longwave (LW), and Net(SW + LW) radiation for 100% contrail cover in various regions and seasons, with prescribed surface albedo, with contrail ice water content IWC, and computed
optical depth s of the contrail at 0:55 lm. Results are for spherical ice particles (model M, upper entry) and hexagonal ice particles (model D, lower entry)
Region Surface
albedo IWC inmg m)3 s SWWm)2 LWWm)2 NetWm)2
Midlatitude summer continent, 45°N 0.2 21 0.52 )13.4 51.6 38.2 )22.0 51.5 29.5 Midlatitude winter continent, 45°N 0.2 7.2 0.18 )4.2 18.4 14.2
)4.6 18.3 13.7
Midlatitude winter continent with
snow, 45°N 0.7 7.2 0.18 )2.3 18.4 16.1
)2.0 18.3 16.3
North Atlantic summer ocean, 55°N 0.05 21 0.52 )21.5 53.3 31.8 )32.7 50.9 18.2 Tropical ocean (Equator., June) 0.05 23 0.57 )16.0 63.0 47.0 )25.9 57.4 31.5 Subarctic summer ocean, 62°N 0.05 28.2 0.70 )30.8 55.7 24.9
)45.3 49.1 3.7
Subarctic winter ocean ice 62°N 0.7 7.2 0.18 )0.6 14.6 14.0
causing maximum cooling at solar zenith angles near 50 to 60° (see Table 5 and Fig. 4b). The maximum SW
cooling is approximately 20 to 25 Wm)2, while the
maximum LW warming is about 5 to 10 Wm)2 (see
Table 2). Similar values were computed recently by Khvorostyanov and Sassen (1998). Hence, the maxi-mum day-night dierence in net radiative forcing at the surface for otherwise cloudless summer mid-latitude
conditions amounts to about 20 Wm)2 for constant
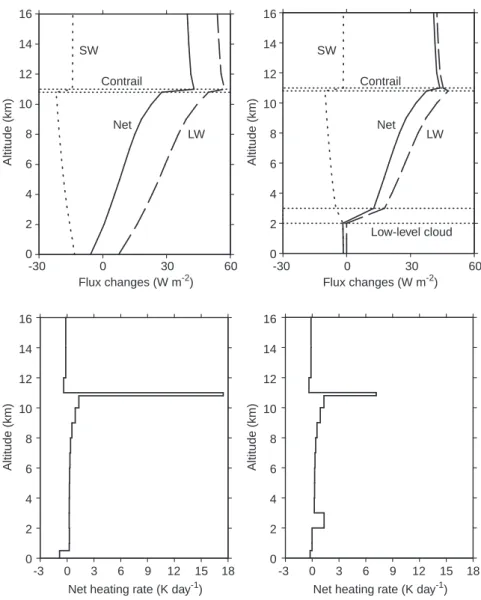
100% contrail cover with optical depth of 0.5 and constant surface temperature. The daily forcing ampli-tude due to contrails will be smaller when accounting for the change in LW forcing due to the daily surface temperature cycle. Also increased low-level humidity and low-level cloud cover reduce this forcing amplitude. As shown in Fig. 5, contrails change the pro®les of radiative ¯uxes and volumetric heat sources within the atmosphere and the energy budget at the surface. The perturbed surface energy budget induces surface temper-ature changes depending on the heat ¯ux into the ground, evaporation, and the depth of the atmospheric boundary layer that exchanges heat with the surface. For an adiabatic surface with uniform distribution of the contrail induced heat source over the lowest, say, 500 m of the atmosphere, a change in net heat budget at the surface by
)5.3 Wm)2 in the daily mean (see Table 3) would cool
that layer at a rate of 0.8 K day)1. Similarly, a day-night
dierence of )20 Wm)2over 12 hours would reduce the
daily temperature range by 1.4 K if the radiation heat gets distributed over the lowest 500 m atmosphere only (0.7 K for 1000 m). A constant 100% contrail cover lasting the whole day is, of course, unlikely.
Above the surface, Fig. 5 shows the contrail induced volumetric heat source given by the change in divergence of the sum of the solar and infrared radiation ¯uxes (Loiu, 1986, Ackerman et al., 1988). In the reference case, the 200 m deep contrail layer gets heated at a rate of 17 K/day for 100% contrail cover at about equal fractions by LW and SW ¯ux changes, while the stratosphere above the contrail gets cooled and the troposphere below the contrail layer gets heated mainly in the LW range at a rate of order 0.3 K/day. A contrail above a thick lower-level cloud heats the atmosphere mainly above the lower cloud; the heating rates are much smaller below the cloud. This is illustrated in Fig. 5 for a low-level cloud with water droplets of 5 lm mode radius, a lognormal size distribution, and a
concentration of 100 cm)3 at 2 to 3 km altitude with
an optical depth of 23 at 0:55 lm.
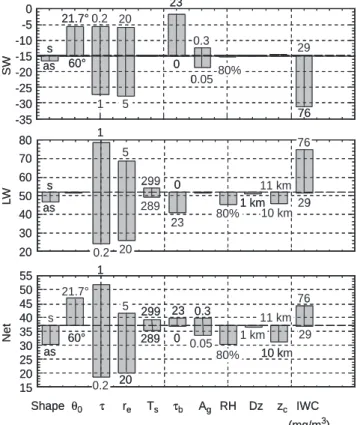
Finally, the sensitivity of contrail forcing to other important parameters is studied. The midlatitude con-tinental summer atmosphere, case a) of Table 2, is considered as reference, but for ®xed solar zenith angle of 60° and an assumed daytime fraction of 50%. Figure 6 shows the results of model N separately for SW, LW and net forcing at TOA. Aspherical particles cause stronger SW cooling because of larger side-ward scattering and less forward scattering. The net forcing results are sensitive to the solar zenith angle, optical depth of the contrails (ice water content), particle radius, presence of lower level clouds, surface albedo, and relative humidity pro®le. The SW forcing is much more negative at a solar zenith angle of 60° compared to 21.7°. The forcing increases with the optical depth (or the IWC). The increase is nearly linear for the SW part but less than linear for the LW part. For the same IWC, contrail with particles of 5 lm mean radius cause more radiative forcing than contrails with larger particles. Variations in surface temperature (here by 5 K) cause a relatively small net ¯ux change but the heating eect of contrails is higher over a warmer surface. The net forcing is larger over a surface with higher surface albedo because of less negative SW forcing. Low-level clouds at 2 to 3 km altitude, as in Fig. 5, with large cover and optical depth of 23 at 0:55 lm reduce both the SW and the LW forcing of the cloud-free case below a contrail, causing a small net increase of the forcing. A contrail above a low level cloud causes larger net heating because of a high albedo and relatively high temperature of the lower cloud. Thick clouds below contrails may also reduce net heating when high and cold. The LW forcing decreases when the humidity in the atmosphere below the contrail increases because of reduced upward LW ¯ux reaching the contrail. The geometrical thickness of the contrails is unimportant as long as the IWP remains unchanged. Lowering the altitude of a contrail for ®xed IWC reduces the LW eects slightly because of higher ambient temperature at the lower contrail level. However, adapting the IWC to the warmer atmosphere makes the lower contrail optically thicker and radia-tively more eective than the higher contrail.
Hence, contrails heat most when covering a warm and bright surface. Contrail heating increases with IWP
-40 -20 -20 0 0 20 40 60 24 24 21 21 18 18 15 15 12 12 9 9 6 6 3 3 0 0 Time of day (h) Time of day (h) a TOA b Surface SW SW Net LW Hexagons Hexagons Spheres Spheres Flux changes (W m ) -2 Flux changes (W m ) -2 LW Net
Fig. 4a, b. Flux changes a at top of atmosphere (TOA) and b at the surface versus time of day for shortwave (SW), longwave (LW), and net (SW + LW) ¯uxes for spherical and hexagonal (shown for TOA only) particles in a contrail with optical depth of 0.52, case (a)
for small IWP values. As a whole, the TOA radiative forcing is only weakly sensitive to key parameters except for the optical depth and the contrail cover, with which the forcing scales about linearly. Representative net
forcing values are 20 to 50 Wm)2 for 100% contrail
cover and optical depth of 0.5 at 0:55 lm. 5 Discussion
5.1 Model dierences
Table 6 lists the net forcing results for the parameter study shown in Fig. 6 as obtained from the three models FL, M, and N. The model results agree well with each other. The largest model dierences are found for aspherical particles which are represented with dierent shapes in various spectral regions in the models, but all show stronger SW cooling and therefore smaller net forcing for aspherical particles than for spherical ones, as expected from Kinne and Liou (1989). Otherwise the dierences between the results from the three models, with various ¯ux approximations and spectral resolu-tions, dier by less than 7% from each other. This is
consistent with ®ndings from other model comparisons for optically thin clouds (King and Harshvardhan, 1986). Similar to cirrus cases (Ackerman et al., 1988), any errors in the scattering properties of individual particles is dwarfed by the uncertainty in the assumed IWP values of contrails. The tropospheric aerosol slightly enhances the planetary albedo and the absorption properties, reducing both the SW and LW contrail forcing. If mode M is applied for the reference case (a) using maritime aerosol (aerosol optical depth of 0.08 at 0:55 lm) instead of the continental aerosol (optical depth 0.28), the contrail
forcing increases from 38.16 to 39.71 Wm)2 for 100%
contrail cover. Obviously, the background aerosol prop-erties are of minor importance, as shown also by the good agreement between models M and N, where N has been applied to the contrail cases for zero background aerosol. 5.2 Forcing by a layer of contrail cirrus
In all cases, the computations show positive values of the net forcing at TOA, suggesting that contrail heating generally prevails over cooling in the atmosphere/ surface system. This can be understood as follows.
SW SW
Flux changes (W m )-2 Flux changes (W m )-2
LW LW Net Net Contrail Contrail 0 0 0 0 2 2 2 2 4 4 4 4 6 6 6 6 8 8 8 8 10 10 10 10 12 12 12 12 14 14 14 14 16 16 16 16 60 60 30 30 0 0 -30 -30 Altitude (km) Altitude (km) Altitude (km) Altitude (km) Low-level cloud 18 18 15 15 12 12 9 9 6 6 3 3 0 0 -3 -3
Net heating rate (K day )-1 Net heating rate (K day )-1
Fig. 5. Vertical pro®les of shortwave (SW), longwave (LW) and net ¯ux changes (top) and net heating rate (bottom) induced by a contrail (at altitude as indicated by horizontal dotted lines) for the reference case (left, optical depth 0.52; case a) and the same case but with a low-level water cloud at 2±3 km altitude (right). The net heating rate is plotted as mean values over certain altitude intervals as indicated by the step functions. The ¯ux pro®le is the linear interpolation between the ¯ux values at the boundaries of these altitude intervals. The heating rate near the surface illustrates the net change in the radiative heat budget at the surface assuming adiabatic surfaces and a uniform mixing of heat across the lowest 500 m of the atmosphere
The shortwave (SW) radiative forcing FSW of
con-trails is
FSW ÿSDA;
where S is the solar irradiance and DA is the dierence of the system albedo A with and without a contrail. The SW forcing is negative when the cloud increases the
albedo. This is the case in most instances. Exceptions
occur over surfaces with very large surface albedo Ag
and sucient absorption in the atmosphere between contrail top and the surface. For 100% coverage, the change in albedo is
DA R 1 ÿ Ag2= 1 ÿ RAg;
where R is the re¯ectance of the cloud layer and Ag the
eective ground albedo (Paltridge and Platt, 1976, p.
235). Hence, the SW forcing grows as 1 ÿ Ag2for small
cloud re¯ectance, R < 0:1 (Charlson et al., 1992). In the
reference case, the forcing is close to linear in 1 ÿ Ag.
In any case, SW forcing has a greater magnitude over dark surfaces than over bright surfaces. The re¯ectance R of a thin, non-absorbing cloud layer,
R bs=cos h0;
increases with the upward scattered fraction b of the incident light, the optical depth s, and the solar zenith
angle h0. The value of b depends on the scattering phase
function of the ice particles and the solar zenith angle. In the two-stream approximation, the upward scattered fraction b of diuse light increases with 1 ÿ g, where g is the asymmetry factor (Paltridge and Platt, 1976, p. 76). For directed radiation, backscatter increases ap-proximately as
b 1=2 ÿ 3=4 g= 1 g cos h0
(see Rockel et al., 1991). Hence, the shortwave forcing is larger for smaller g, and therefore larger for hexagonal ice particles than for spherical particles (Wendling et al., 1979; Kinne and Liou, 1989; Rockel et al., 1991). The optical depth can be estimated for monodisperse thin clouds from
s 3 IWPQe= 4 r qice;
with extinction eciency Qe, particle radius r, and ice
density qice. For particle radius r large compared to the
typical wavelength 0:55 lm of the solar range, the
extinction eciency is close to a constant, Qe 2.
Hence, for ®xed IWP, clouds containing smaller parti-cles have larger optical depth and larger solar albedo (Twomey, 1977). -35 -30 -25 -20 -15 -10 -5 0 23 21.7° 21.7° s s s as as as 60° 60° 1 5 0.2 20 0 0.3 0.05 29 76 80% SW L W Net 1 1 5 5 299 299 0 0 11 km 11 km 76 76 29 29 10 km 10 km 1 km 1 km 80% 80% 23 23 289 289 20 20 0.2 0.2 20 30 40 50 60 70 80 0.3 0.05 15 20 25 30 35 40 45 50 55 IWC zc Dz RH Ag Ts re τb τ θ0 Shape (mg/m )3 -35 -30 -25 -20 -15 -10 -5 0 23 21.7° 21.7° s s s as as as 60° 60° 1 5 0.2 20 0 0.3 0.05 29 76 80% SW L W Net 1 1 5 5 299 299 0 0 11 km 11 km 76 76 29 29 10 km 10 km 1 km 1 km 80% 80% 23 23 289 289 20 20 0.2 0.2 20 30 40 50 60 70 80 0.3 0.05 15 20 25 30 35 40 45 50 55 IWC zc Dz RH Ag Ts re τb τ θ0 Shape (mg/m )3
Fig. 6. Results of a sensitivity study using model N. The bars indicate the range of variation of shortwave (SW), longwave (LW) and net (Net) ¯ux changes in Wm)2for 100% contrail cover due to the given
variation of the parameters: particle shape, solar zenith angle h0, IWC
or optical depth s, volume-mean particle radius re(in lm), surface
temperature Ts(K), optical depth of lower level cloud sb, ground
albedo Ag, ambient relative humidity RH (% of liquid saturation),
contrail layer depth Dz (km), cloud top level zc(km), and contrail at
1 km lower level but with increased ice water content IWC (mg m)3)
Table 6. Sensitivity of the daily mean net TOA ¯ux change by contrails to various parameters for 100% contrail with given optical depth s at 0:55 lm. Results from models N, FL, and M, where available
Case/parameters Parameter range s Net forcing in Wm)2
N FL M
Reference 0.52 37.1 37.2 37.2
Dierent aspherical particles Spherical ± aspherical 0.4 37±22 37±34 37±36
Solar zenith angle 60°±21° 0.52 37±48 37±45 37±46
Ice water content (IWC) 7.2±42 mg m)3 0.2±1.0 19±51 18±53 19±52
Particle radius 5±20 lm 0.85±0.21 41±20 ± ±
Surface temperature 289±299 K 0.52 34±39 36±39 35±40
Optical depth of low-level clouds 0±23 0.52 37±40 37±39 37±40
Surface albedo 0.05±0.3 0.52 31±40 34±39 34±40
Relative humidity Reference ± 80% 0.52 37±31 37±31 37±31
Contrail depth (for ®xed ice water path) 200 m±1 km 0.52 37±37 ± 37±37 Lower contrail top (for ®xed IWC) 11±10 km 0.52 37±31 37±32 37±31 Lower contrail top (increased IWC) 11±10 km 0.52±1.32 37±45 ± 37±41
The LW forcing by a 100% cover of contrails, which is given approximately by
FLW re Te4ÿ Tb4;
with Stefan-Boltzmann constant r, is greatest when the
dierence between contrail temperature Te and
bright-ness temperature Tb of the atmosphere below the
contrail is large (i.e., larger over warm than over cool surfaces, larger in a dry than in a humid atmosphere) and the contrail emissivity e is large (Ebert and Curry, 1992, Fu and Liou, 1993). The brightness temperature
Tb is smaller than the ground temperature Tg, in
particular over humid atmospheres and low-emissivity surfaces. In the absorption approximation (Paltridge and Platt, 1976, p. 197), the contrail emissivity is
e 1 ÿ exp ÿbaDz
and, for monodisperse contrail cloud, the volume absorption coecient
baDz 3 IWPQa= 4 r qice
increases with the ice water path (IWP). The absorption
eciency Qa increases in fairly linear manner with
particle radius up to radius of order 10 to 20 lm (Paltridge and Platt, 1976, p. 195) and thereafter approaches its asymptotic value of 1.0. Therefore, the emissivity of the contrail is fairly independent of particle radius for eective particle radius less than about 10 lm, and decreases with particle radius for larger particles. For increasing IWP values, the emissivity approaches one and ``saturates'' (approaches a constant) quickly when the particles are small while the albedo is still much smaller than one (Stephens and Webster, 1981). Use of spheres instead of more realistic ice particle shapes may overestimate the absorption by ice particles but only to a minor degree in the infrared regime (Ackerman et al., 1988; Fu et al., 1998).
The water vapor that is converted to ice during contrail formation has an opposing radiative eect. The water-vapor-induced LW forcing increases strongly with altitude and depends on the temperature and water vapor pro®les. In the tropical reference atmosphere, a 10% increase in humidity in a small vertical range at
11 km altitude causes a LW forcing of 0.4 Wm)2
(g m)2))1 when normalized to the added water vapor
mass column (Schmetz et al., 1995). Thus the ice mass
path of 4.6 g m)2 contained in the tropical contrail
causes 0.2 Wm)2 LW forcing as gas. The ice cloud
causes 60 Wm)2 of LW forcing (see Table 4). Hence
water in the ice phase is about 300 time more eective radiatively than water as vapor at the altitudes of contrails. Therefore, the reduction of water vapor concentration during contrail formation is of little radiative importance.
The net radiative forcing of clouds is the sum of the SW and LW ¯ux changes and may be positive or negative. Thin contrails with small re¯ectivity but rather large emissivity cause a small but positive radiative forcing at TOA, while thick cirrus clouds may cause a cooling (Stephens and Webster, 1981; Fu and Liou,
1993). Maximum heating is reached at intermediate IWP
of order 20 g m)2, corresponding to an optical depth of
about 2 to 3, and the net forcing becomes negative for
large IWP greater than an order 100 g m)2with optical
depths greater than about 10 to 20 (Jensen et al., 1994). The calculations show that contrails cause a positive net forcing at TOA in most cases. Exceptions are possible for situations where contrails form over very cold surfaces with low albedo, at SZA near 60 to 70°, over a very humid but cloud free troposphere, and for contrails with very small particles <10 lm, particles with small asymmetry factor (as for some ice crystals), and contrails with large optical depth (>10). In fact, Fortuin et al. (1995) ®nd negative forcing only for large
IWP values (>25 g m)2) and small crystal radius
(<8 lm), implying optical depth values larger 20, far larger than observed for contrails.
Based on the assumed IWP values, the computations suggest that the contrails have optical depth values in between 0.2 and 0.7 and cause net TOA forcing for
100% contrail cover between about 10 Wm)2 and
30 Wm)2in the annual mean, and little more in tropical
regions. If the global contrail cover is of order 0.1% as computed by Sausen et al. (1998), the global mean
radiative forcing is of order 0.01 to 0.03 Wm)2. Hence,
the global radiative forcing by contrails is much smaller than that due to other anthropogenic changes in the last
century (1.5 Wm)2 according to IPCC, 1996), but
comparable to the 0.007 to 0.024 Wm)2forcing by past
emissions of carbon dioxide by aircraft (Brasseur et al., 1998). If contrails occur only during the day and not during the night, the positive forcing by contrails at TOA would be smaller by about 20 to 30%, and the negative forcing at the surface would be 100% larger. Our results depend also strongly on the assumed IWC, the geometrical thickness of the contrails, and the particle sizes of the contrails, all together controlling the optical depth of the contrails. Contrails could have a factor of 3 smaller IWC than assumed in this study (see Fig. 1), may be geometrically thicker by a factor of 3 (Freudenthaler et al., 1996; Sassen, 1997), and the particle size is known, at best, to a factor of 2, implying an uncertainty in optical depth of about factor 4 (based on the square of the sum of the individual uncertainty factors). The contrail cover value is estimated to be uncertain by a factor of about 2. Hence, the given amount of radiative forcing by contrails is uncertain by a factor of about 5, mainly because of uncertain contrail cover and optical depth values.
The computational results are fully consistent with the observed negative daytime forcing at the surface. A
reduction of solar ¯ux by an order 50 Wm)2, as
measured by Sassen (1997), is to be expected for thick contrails s > 1. The surface LW forcing is small because of shielding of terrestrial radiation by water vapor in the atmosphere above the surface. Hence, the Earth's surface gets locally cooled in the shadow of contrails (Sassen, 1997). This does not exclude a warming of the whole atmosphere-surface system driven by the net ¯ux change at the TOA. As shown, for example, by radiation-convection models, vertical heat exchange in
the atmosphere may cause a warming of the surface even when it gets less energy by radiation (Strauss et al., 1997). The measurements of Kuhn (1970) show strongly reduced downward SW ¯uxes below contrails which are not balanced by a similar increase in downward LW ¯uxes. This might be a consequence of the narrow geometry of contrails. A strong localized SW cooling in the shadow of contrails may be balanced by the integral change of less focused LW radiation. The 3-D eect of narrow but thick contrails has not yet been computed. 5.3 Indirect eect due to change in particle size
Aircraft emissions may have indirect eects on radiative forcing, e.g., by changing the particle size spectra in otherwise existing `natural' cirrus clouds. Some mea-surements indicate that aircraft emissions may induce a factor of 2 to 3 more but smaller ice particles in cirrus clouds (StroÈm and Ohlsson, 1998b), regionally. Hence, aircraft may increase the optical depth of natural cirrus clouds. Therefore, the sensitivity of radiative forcing to changes in the particle size is of particular interest. For thin cirrus with few small particles, additional smaller particles tend to cause stronger heating by increasing cloud albedo less strongly than emissivity (Fu and Liou, 1993). However, contrails may contain very small particles of 1 to 10 lm radius. Such small particles have low absorption eciency but larger single scattering albedo, causing more scattering and less absorption per unit mass, in particular, at infrared wavelengths. Hence, in this size range, a reduction of particle size increases the system albedo much more than the emissivity and hence causes a cooling at least for suciently large IWP values.
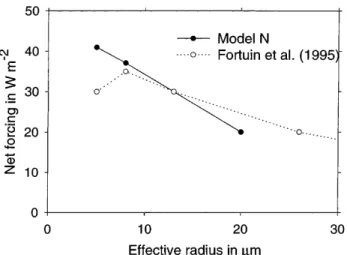
As shown in Fig. 6, for ®xed IWC, smaller particles increase both the SW and the LW forcing. As a consequence, the net forcing increases with smaller particles or larger optical depth also but less strongly. This result holds only as long as the contrail is optically thin, see Fig. 3. For optically thick cirrus the increase in optical depth causes a reduction of net radiative forcing. Most natural cirrus is optically thin suggesting that the warming eect prevails. Figure 7 shows that the sensi-tivity of net forcing to a change in particle radius for the given IWP values is slightly larger in the present computation than in the results of Fortuin et al. (1995) and amounts to about
DFnet=Dr ÿ1 Wmÿ2lmÿ1:
Consistent with the results presented by Fortuin et al. (1995) and Wyser and StroÈm (1998), the sensitivity is positive for small and negative for larger particles. As shown by the results of Fortain et al. (1995), the critical radius increases from about 5 to 10 lm with IWP value and the sensitivity to particle changes reaches its
maxi-mum for 10 to 20 g m)2IWP and 20 to 40 lm eective
particle radius (optical depth of order 1), which is in the range to be expected for high altitude thin cirrus clouds. An increase in particle number by a factor of 2 would
imply particles smaller by a factor of 2)1/3or 26%. For a
mean radius of, e.g., 30 lm in a cirrus cloud, this implies
an increase in net forcing of about 5 Wm)2 for 100%
cirrus cover. The global cirrus cover is of order 30%. In a heavy air trac region over Germany, StroÈm and Ohlson (1998) estimate that aircraft may impact 25% of cirrus clouds. Based on the ratio of global to European contrail cover (Sausen et al., 1998), the global fraction of impacted cirrus clouds is probably more than an order of 10 times smaller. Hence, aircraft may aect up to 2.5% of all cirrus clouds, and the global radiative forcing due to an increase in particle number could
reach an order 0.04 Wm)2globally. It suggests that the
indirect eect by particle changes might be comparable in magnitude to the direct eect.
6 Conclusions
Major parameters in¯uencing static radiative forcing due to contrails were identi®ed from a model study. Contrails were considered as geometrically and optically thin plane parallel homogeneous cirrus layers in a static atmosphere. The ice water content depends on the amount of water available for ice particle formation in ice-supersaturated air, implying contrails to be thinner at higher levels with lower ambient temperatures. The model atmospheres include tropical, mid-latitude, and subarctic summer and winter atmospheres, where air-craft ¯y. Three state-of-the-art radiative transfer models are applied. The dierences between the model results are small and do not in¯uence the conclusions. Three-dimensional geometry and climate feedback eects are not included in this study.
The radiative forcing of contrails is similar to that by thin cirrus clouds. A temporally constant cover by optically thin contrails increases the net radiative heat budget below the top of the atmosphere but cools radiatively at the Earth's surface. The radiative forcing grows with the optical depth and the amount of contrail
Fig. 7. Net forcing versus eective particle radius for ®xed ice water path (IWP) and for 100% contrail cover with parameters as in case (a). Results from the present computations (model N, solid curve with solid dots), results from Fortuin et al. (1995) for IWP 4 g m)2
cover. The negative net forcing values computed by Fortuin et al. (1995) apply to cirrus clouds with optical depth values that are larger than expected for contrails. Contrails heat most when covering a warm and bright surface. Contrails are most ecient in radiatively forcing the Earth's atmosphere in the tropics and above low-level clouds. Contrails with smaller ice particles cause stronger heating, unless the mean particle radius is smaller than about 5 lm (depending on IWP). Cirrus with smaller particles cause stronger heating only when optically thin. Aircraft emissions may cause indirect climate forcing by changing the particle size of natural cirrus clouds. This indirect forcing may be comparable to the direct forcing due to additional contrail cloud cover. The indirect eects due to additional cirrus forming from aged aircraft aerosol or changes due to enhanced precipitation from modi®ed cirrus are un-known. Contrails cool the surface radiatively during the day and heat the surface during the night, and hence reduce the daily temperature amplitude. The net eect depends strongly on the daily variation of contrail cloud cover. For a global mean contrail cover of 0.1% and an average optical depth of 0.2 to 0.5, contrails cause about
0.01 to 0.03 Wm)2daily and annual mean instantaneous
radiative forcing. This is of the same order of magnitude as the radiative forcing due to all previous carbon dioxide emissions by aviation. The best estimate value
0.02 Wm)2 of global contrail forcing is uncertain to
about a factor 5, mainly because of not well known contrail cover and optical depth values.
Acknowledgements. This study was performed during preparation of the IPCC-report on Aviation and Global Atmosphere. We gained strongly from the discussions with Drs. David W. Fahey, Steven Ackerman, Olivier Boucher, and Eric J. Jensen. We thank also Drs. Klaus Gierens and Peter Wendling for critical and helpful remarks.
Topical Editor Y.-P. Duvel thanks a referee for his help in evaluating this paper.
References
Ackerman, T. P., K.-N. Liou, F. P. J. Valero, and L. P®ster, Heating rates in tropical anvils, J. Atmos. Sci., 45, 1606±1623, 1988.
Bakan, S., M. Betancor, V. Gayler, and H. Grassl, Contrail frequency over Europe from NOAA-satellite images, Ann. Geophysicae 12, 962±968, 1994.
Betancor-Gothe, M., and H. Grassl, Satellite remote sensing of the optical depth and mean crystal size of thin cirrus and contrails, Theor. Appl. Climatol., 48, 101±113, 1993.
Brasseur, G. P., R. A. Cox, D. Hauglustaine, I. Isaksen, J. Lelieveld, D. H. Lister, R. Sausen, U. Schumann, A. Wahner, and P. Wiesen, European assessment of the atmospheric eects of aircraft emissions, Atmos. Environ., 32, 2327±2422, 1998. Brogniez, G., J. C. Buriez, V. Giraud, F. Parol, and C. Vanbauce,
Determination of eective emittance and a radiatively equiva-lent microphysical model of cirrus from ground-based and satellite observations during the International Cirrus Experi-ment: the 18 October 1989 case study, Mon. Weather Rev., 123, 1025±1036, 1995.
Charlock, T. P. et al., Clouds and the Earth's Radiant Energy System (CERES) Algorithm Theoretical Basis Document, NASA Reference Publ. 1376, vol. IV, 1995.
Charlson, R. J., S. E. Schwartz, J. M. Hales, R. D. Cess, J. A. Coakley, Jr., J. E. Hansen, and D. J. Hofmann, Climate forcing by anthropogenic aerosols, Science, 255, 423±430, 1992. Chylek, P., and J. Hallett, Enhanced absorption of solar radiation
by cloud droplets containing soot particles on their surface. Q. J. Roy. Meteorological Soc., 118, 167±172, 1992.
Detwiler, A., and R. Pratt, Clear-air seeding: opportunities and strategies, J. Weather Mod., 16, 46±60, 1984.
Ebert, E. E., and J. A. Curry, A parameterization of ice cloud optical properties for climate models, J. Geophys. Res., 97, 3831±3836, 1992.
Ellingson, R. G., and Y. Fouquart, The intercomparison of radiation codes in climate models, IRCCM, WCRP-39, WMO/TD-371, 1990.
Fischer, J., and H. Grassl, Radiative transfer in an atmosphere-ocean system: An azimuthally dependent matrix-operator-approach, Appl. Opt., 23, 1032±1039, 1984.
Fortuin, J. P. F., R. van Dorland, W. M. F. Wauben, and H. Kelder, Greenhouse eects of aircraft emissions as calculated by a radiative transfer model, Ann. Geophysicae, 13, 413±418, 1995. Fouquart, Y., J. C. Buriez, M. Herman, and R. S. Kandel, The in¯uence of clouds on radiation: a climate-modeling perspec-tive, Rev. Geophys., 28, 145±166, 1990.
Freudenthaler, V., F. Homburg, and H. JaÈger, Contrail observa-tions by ground-based scanning lidar: cross-sectional growth, Geophys. Res. Lett., 22, 3501±3504, 1995.
Freudenthaler, V., F. Homburg, and H. JaÈger, Optical parameters of contrails from lidar measurements: linear depolarization, Geophys. Res. Lett., 23, 3715±3718, 1996.
Fu, Q., and K. N. Liou, Parametrization of the radiative properties of cirrus clouds, J. Atmos. Sci., 50, 2008±2025, 1993.
Fu, Q., P. Yang, and W. B. Sun, An accurate parameterization of the infrared radiative properties of cirrus clouds for climate models, J. Clim., 11, 2223±2237, 1998.
Gayet, J.-F., G. Febvre, G. Brogniez, H. Chepfer, W. Renger, and P. Wending, Microphysical and optical properties of cirrus and contrails: cloud ®eld study on 13 October 1989, J. Atmos. Sci., 53, 126±138, 1996.
Gayet, J.-F., F. Auriol, S. Oshchepkov, F. SchroÈder, C. Duroure, G. Febvre, J.-F. Fournol, O. CreÂpel, P. Personne, and D. Daugereon, In situ measurements of the scattering phase function of stratocumulus, contrails and cirrus, Geophys. Res. Lett., 25, 971±974, 1998.
Gierens, K., Numerical simulations of persistent contrails, J. Atmos. Sci., 53, 3333±3348, 1996.
Goodman, J., R. F. Pueschel, E. J. Jensen, S. Verma, G. V. Ferry, S. D. Howard, S. A. Kinne, and D. Baumgardner, Shape and size of contrail particles, Geophys. Res. Lett., 25, 1327±1330, 1998. Grassl, H., Possible climatic eects of contrails and additional
water vapour, in Air Trac and the Environment-Background, Tendencies, and Potential Global Atmospheric Eects, Ed. U. Schumann, Springer-Verlag, Berlin Heidelberg New York, pp 124±137, 1990.
Hess, M., and M. Wiegner, COP: data library of optical properties of hexagonal ice crystals, Appl. Opt., 33, 7740±7746, 1994. Heyms®eld, A. J., Microphysical structures of stratiform and cirrus
clouds, in Aerosol-Cloud-Climate Interactions, Ed. P. V. Hobbs, Academic Press, San Diego, pp 97±121, 1993.
Heyms®eld, A. J., and C. M. R. Platt, A parametrization of the particle size spectrum of ice clouds, in terms of the ambient temperature and ice water content, J. Atmos. Sci., 41, 846±855, 1984.
Heyms®eld, A. J., R. P. Lawson, and G. W. Sachse, Growth of ice crystals in a precipitating contrail, Geophys. Res. Lett. 25, 1335± 1338, 1998a.
Heyms®eld, A. J., L. M. Miloshevich, C. Twohy, G. Sachse, and S. Oltmans, Upper tropospheric relative humidity observations and implications for ice nucleation, Geophys. Res. Lett., 25, 1343±1346, 1998b.
IPCC, Climate Change 1995: The Science of Climate Change, Eds. J. H. Houghton, L. G. Meira Filho, B. A. Callander, N. Harris,