HAL Id: hal-01342647
https://hal.archives-ouvertes.fr/hal-01342647
Submitted on 11 Jul 2016HAL is a multi-disciplinary open access archive for the deposit and dissemination of sci-entific research documents, whether they are pub-lished or not. The documents may come from teaching and research institutions in France or abroad, or from public or private research centers.
L’archive ouverte pluridisciplinaire HAL, est destinée au dépôt et à la diffusion de documents scientifiques de niveau recherche, publiés ou non, émanant des établissements d’enseignement et de recherche français ou étrangers, des laboratoires publics ou privés.
A17 Topographic Migration of GPR Data -Case Studies
from Dry Sand Dunes and Active Fault Areas
Jean-Rémi Dujardin, Maksim Bano
To cite this version:
Jean-Rémi Dujardin, Maksim Bano. A17 Topographic Migration of GPR Data -Case Studies from Dry Sand Dunes and Active Fault Areas. Near Surface Geoscience 2012, 18th European Meeting of Environmental and Engineering Geophysics, Sep 2012, Paris, France. �hal-01342647�
A17
Topographic Migration of GPR Data - Case
Studies from Dry Sand Dunes and Active Fault
Areas
J.R. Dujardin* (Institut de Physique du Globe de Strasbourg) & M. Bano (Institut de Physique du Globe de Strasbourg)
SUMMARY
Most Ground Penetrating Radar (GPR) measurements are performed on nearly flat areas. If strongly dipping reflections and/or diffractions are present in the GPR data, a classical migration processing step is needed in order to determine the geometries of shallow structures. Nevertheless, standard migration routine is not suitable for GPR data collected on areas showing variable and high topographic relief. To account for the topographic variations the GPR data are, in general, corrected by applying static shifts instead of using an appropriate topographic migration which would place the reflectors at their correct locations with the right dip angle. In this paper we present an overview of Kirchhoff migration and show the importance of topographic migration in the case where the depth of the target structures is of the same order as the relief variations. Examples of synthetic and real GPR data are shown to illustrate the
efficiency of the topographic migration.
Introduction
One of the goals of GPR measurements is to determine the geometries of fine structures by imaging the shallow subsurface. In general, the GPR profiles are recorded on nearly flat surfaces and in this case, if highly dipping reflections and/or diffractions are present in data, a standard migration is needed in order to precisely determine the geometries of shallow structures (Zeng et al., 2004). For variable topographic relief, a standard processing procedure includes the application of static shifts (Annan, 1991) followed by a classical migration commonly performed with a flat datum plane. Nevertheless, this processing technique does not give good results for high topographic variation. In addition, the inadequacy of conventional elevation static corrections in accounting for gentle to rugged topographic relief was shown to be a particular problem (Lehmann and Green, 2000). To obtain reliable images from GPR data acquired on the areas showing irregular topography might require a special processing which accounts for the topography.
Lehmann and Green (2000) adapted a topographic migration for GPR data based on the Kirchhoff algorithm proposed by Wiggins (1984) for the seismic data collected in mountainous areas. According to these authors, the topographic migration should be considered when the surface gradient exceeds 10%. This migration method has been successfully used, in 3D, by McClymont et al. (2008) for the GPR data acquired on active fault areas showing rugged topography.
In this paper, we first present an overview of the Kirchhoff topographic migration and demonstrate the diffraction equation used in this method as presented by Lehmann et al. (1998). To show the efficiency of the method we use synthetic data from a single diffraction point model, and compare the results of migration with flat datum and topography, respectively. Next, we present different examples of real GPR data recorded on areas with local and high topographic variations. The data are from the Chadian desert and Mongolia. Finally, we compare the result of GPR profiles processed with static shift and topographic migration, and discuss the supremacy of the later one.
The Kirchhoff topographic migration
We assume a zero offset survey with transmitting and receiving antennas which move on a flat horizontal surface at z = 0. The goal of the migration is to find the geological model (in the x-z plane) from the zero offset GPR profile (in the x-t plane). For a resistive medium, we can use the Kirchhoff method which gives the wave field at the location of the diffractor (xd, zd) from the zero-offset wave
field measured at the surface z = 0 (Schneider, 1978; Leparoux et al. 2001). Practically, the Kirchhoff migration will calculate the diffraction hyperbola (migration template) for each point of the GPR profile, and by adding the amplitudes along the template will place it at the top of the template, in the migrated profile (Claerbout, 1985; Yilmaz 2001). For the standard Kirchhoff migration, at a location x on the surface z = 0 (i.e. the antennas move on the flat datum plane), the two way travel time t(x) along the gray line path in Figure 1a is given by:
(
)
2 2 2 04
)
(
V
x
x
t
x
t
=
+
−
d , (1)where t0 = 2zd/V is the two way travel time above the diffraction point (black point), xd is the
horizontal position of the diffraction point, zd is the depth of diffraction point from the flat datum
surface (see Figure 1a) and V is the EM wave velocity.
When GPR measurements are performed over a surface with topography, the migration template is not any more a diffraction hyperbola, instead it will be a distorted diffraction curve. This is shown by the thick line in Figure 1a where the topography is chosen to be a circle whose centre is on the diffraction point (xd, zd), and on both sides of this circle the topography is flat. The distance between
the diffraction point and the antennas (in zero offset), moving on the surface along the circle, is constant. Therefore the migration template, shown in Figure 1b, is flat on the top, and on both sides it is presented by two flanks of a diffraction hyperbola. In this case the imaging result of the classical
Kirchhoff migration with a flat datum plane will be spurious (see Figure 1c). For that reason we need absolutely to take into account the topography of the GPR acquisition surface. Thus, we have to choose for migration template the diffraction curve shown in Figure 1b instead of using the diffraction hyperbola given by equation (1). This will allow the template to follow exactly the real travel path of the GPR data. Indeed, for the same x location (Figure 1a) the z position of the antennas (moving on the rugged surface) has been changed and the two way travel time t(x) is now calculated along the thick line path in Figure 1a to obtain:
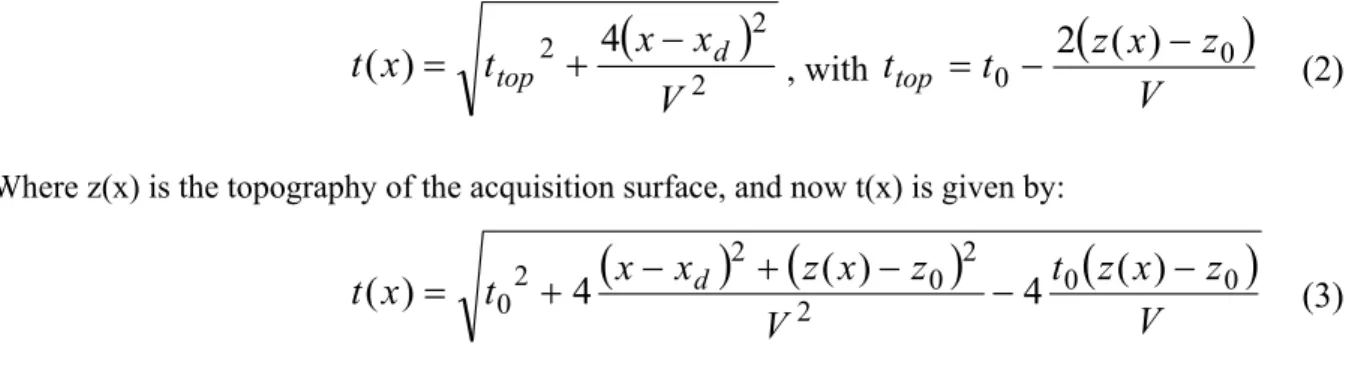
(
)
2 2 24
)
(
V
x
x
t
x
t
=
top+
−
d , with(
)
V
z
x
z
t
t
top=
0−
2
(
)
−
0 (2)Where z(x) is the topography of the acquisition surface, and now t(x) is given by:
(
) (
)
(
)
V
z
x
z
t
V
z
x
z
x
x
t
x
t
d 2 0 0 2 0 2 2 04
(
)
4
(
)
)
(
=
+
−
+
−
−
−
(3)This equation is the same as the one shown without any demonstration by Lehmann et al. (1998) in the case of 2D migration. In Figure 1d we present the result of the topographic migration appropriately weighted by an amplitude factor proportional to cos(α) = ttop/t(x) which also depends on
the topography z(x). The data are well imaged and, as expected, focused to a bright single point located at its real depth of 1.5 m.
Figure 1 a) The model of the diffraction point, with topography (thick line); b) Zero offset GPR data
corresponding to a survey over this area; c) classical Kirchhoff migration with a flat surface at z = 0 (dashed line); d) The result of the topographic migration, the thick line corresponds to the real topography.
Real GPR data examples
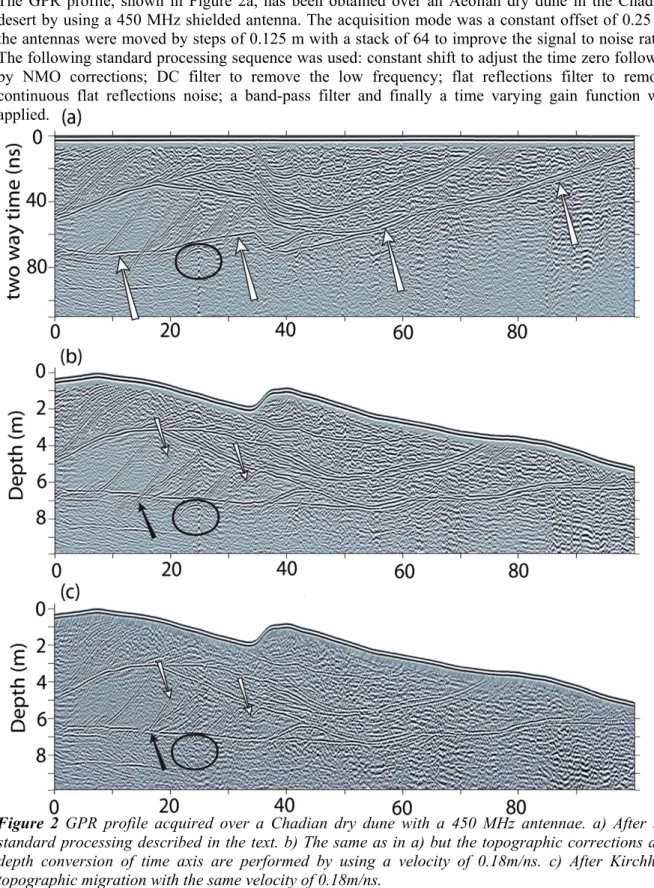
The GPR profile, shown in Figure 2a, has been obtained over an Aeolian dry dune in the Chadian desert by using a 450 MHz shielded antenna. The acquisition mode was a constant offset of 0.25 m, the antennas were moved by steps of 0.125 m with a stack of 64 to improve the signal to noise ratio. The following standard processing sequence was used: constant shift to adjust the time zero followed by NMO corrections; DC filter to remove the low frequency; flat reflections filter to remove continuous flat reflections noise; a band-pass filter and finally a time varying gain function was applied.
Figure 2 GPR profile acquired over a Chadian dry dune with a 450 MHz antennae. a) After the
standard processing described in the text. b) The same as in a) but the topographic corrections and depth conversion of time axis are performed by using a velocity of 0.18m/ns. c) After Kirchhoff topographic migration with the same velocity of 0.18m/ns.
The GPR profile of Figure 2a shows complex geometries, with imbricate reflections corresponding to different phases of deposits. The undulating reflection indicated by four white arrows in this figure represents the base of the dune, which in fact is flat and consists of pebbles (>2.0 mm diameter). In order to apply the topographic static shift and/or migration we need to know the velocity of GPR waves. In Figure 2a we also observe a nice diffraction hyperbola of 10 m wide situated just under the
base of the dune (see black circle). After analyzing this diffraction, with different velocities, we have found that it can be fitted very well with a constant velocity model of 0.18 m/ns, which is in good agreement with values for dry sand. Figure 2b shows the same GPR profile as in Figure 2a, but the topographic corrections and the depth conversion of the time axis are performed by using a velocity of 0.18 m/ns. The topography shows a local variation (at profile coordinate 38 m) and its global variation of about 5 m (5%) is comparable to the investigation depth. The reflection from the base of the dune is roughly flattened while the diffraction hyperbola (at profile coordinate 25m) is still present and the dipping reflectors (see black arrow) are crossing down-dip leftwards the base of the dune instead of starting from the top of the base and going up-dip rightwards. The measured dips for the two reflectors indicated by the white arrows (from left to right) are 23.5° and 16°, respectively.
Figure 2c presents the topographic migration with the same velocity (0.18 m/ns) and a specific migration template width of 13 m, due to the number of traces per meter (8). The base of the dune is flattened and the diffraction at 25 m is now correctly focused on a single point inside the black circle, which justifies our choice of 0.18 m/ns for the GPR velocity. In addition, the dipping reflector shown by the black arrow has undergone a vertical and horizontal shift of 1.1 and 3.8 m. It starts at the base of the dune and goes up-dip rightwards as expected. The measured dips on the migrated section of the same reflectors shown by white arrows are higher than the ones found on the section with topographic corrections. Their values are now 26.5° and 19.5° on the migrated section, which corresponds to an error varying from 12% to 18%. Although the low value of topographic gradient (5%), the error of dips is very large due to the high EM velocity medium. This highlights the importance of the topographic migration even in the case where the surface gradient does not exceed 5%.
Conclusion
In the presence of relief variations of the same order as the investigation depth of GPR data, a topographic migration is necessary to correctly locate the dipping reflectors and correctly focus the diffractions. The topographic migration, presented in this paper, is based on the Kirchhoff algorithm similar to the method shown by Lehmann and Green (2000). We demonstrate the equation of migration template, as a function of the topography, along which the amplitudes are added together to give a single point on the migrated section. By comparing processed section obtained from GPR data measured over media of high EM velocity (dry sand) having a topographic gradient of 5%, we show that reflectors obtained by standard processing (static shift corrections) have dip angles that deviate from the angles in topographically migrated profile by 12% to 18%. Thus, for high velocity media, even in the case where the surface gradient does not exceed 5%, the application of the topographic migration is necessary and efficient.
References
Annan, A.P. [1991] Topographic Corrections of GPR data. Sensors&Software Inc. Technical Note. Claerbout, J.F. [1985] Imaging the Earth’s Interior, Blackwell Scientific Publications, Oxford.
Lehmann, F. and Green, A.G. [2000] Topographic migration of georadar data: Implications for acquisition and processing. Geophysics, 65(3), 836-848.
Lehmann, F., Mühll, D.V., Van der Veen, M., Wild, P. and Green, A.G. [1998] True Topographic 2-D Migration of Georadar Data. SAGEEP, 11, 107-114.
Leparoux, D., Gibert, D. and Cote, Ph. [2001] Adaptation of prestack migration to multi-offset ground-penetrating radar (GPR) data. Geophys. Prospect., 49(3), 374–386.
McClymont, A.F., Alan, G., Green, A.G., Streich, R., Horstmeyer, H., Tronicke3, J., Nobes, D., Pettinga, D., Campbell, J. and Langridge, R. [2008] Visualization of active faults using geometric attributes of 3D GPR data: An example from the Alpine Fault Zone, New Zealand. Geophysics, 73(2) p.B11–B23, 10.1190/1.2825408 Schneider, W.A. [1978] Integral formulation for migration in two and three dimensions. Geophysics, 43(1), 49– 76.
Wiggins, J.W. [1984] Kirchhoff integral extrapolation and migration of nonplanar data. Geophysics, 49(8), 1239-1248.
Yilmaz, Ö. [2001] Seismic Data Analysis. Tulsa, OK., 2nd ed., Society of. Exploration Geophysicists.
Zeng, X., McMechan, G.A., Janok, P., Bhattacharya, J.P., Aiken, C.L.V., Xu, X., William, S., Hammon, W.S. and Corbeanu, R.M. [2004] 3D imaging of a reservoir analogue in point bar deposits in the Ferron Sandstone, Utah, using ground-penetrating radar. Geophysical Prospecting, 52, 151–163.