HAL Id: hal-03070405
https://hal.archives-ouvertes.fr/hal-03070405
Submitted on 16 Dec 2020
HAL is a multi-disciplinary open access
archive for the deposit and dissemination of
sci-entific research documents, whether they are
pub-lished or not. The documents may come from
teaching and research institutions in France or
abroad, or from public or private research centers.
L’archive ouverte pluridisciplinaire HAL, est
destinée au dépôt et à la diffusion de documents
scientifiques de niveau recherche, publiés ou non,
émanant des établissements d’enseignement et de
recherche français ou étrangers, des laboratoires
publics ou privés.
Volcano From Seismic Reflection Data: A New Model
for La Réunion, Indian Ocean
E. Lebas, A. Le Friant, C. Deplus, B. de Voogd
To cite this version:
E. Lebas, A. Le Friant, C. Deplus, B. de Voogd. Understanding the Evolution of an Oceanic
In-traplate Volcano From Seismic Reflection Data: A New Model for La Réunion, Indian Ocean. Journal
of Geophysical Research : Solid Earth, American Geophysical Union, 2018, 123 (2), pp.1035-1059.
�10.1002/2017JB014959�. �hal-03070405�
Understanding the Evolution of an Oceanic Intraplate
Volcano From Seismic Re
flection Data: A New
Model for La Réunion, Indian Ocean
E. Lebas1,2 , A. Le Friant1, C. Deplus1, and B. de Voogd3
1
Institut de Physique du Globe de Paris, Sorbonne Paris Cité and CNRS UMR 7154, Paris, France,2Now at Institut für Geowissenschaften, Christian-Albrechts-Universität zu Kiel, Kiel, Germany,3Université de Pau et des Pays de l’Adour, CNRS
FR 2952, Pau, France
Abstract
High-resolution seismic reflection profiles gathered in 2006 on La Réunion submarine flanks and surrounding abyssal plain, enabled characterization of the seismostratigraphy architecture of thevolcaniclastic apron. Four seismic units are defined beyond the edifice base: (1) a basal unit, interpreted as
pelagic sediment predating La Réunion volcanism; (2) a second unit showing low- to medium-amplitude
reflections, related to La Réunion emergence including the submarine explosive phase; (3) a high-amplitude
seismic unit, associated with subaerial volcanic activity (i.e., mature island stage); and (4) an acoustically transparent unit, ascribed to erosion that currently affects the volcanic complex. Two prominent horizons delineate the base of the units II and III marking, respectively, the onset of La Réunion seamount explosive activity and the Piton des Neiges volcanic activity. Related isopach maps demonstrate: (1) the existence of a
large proto-Piton des Neiges volcano during thefirst building phase of the volcanic complex, and (2) the
central role of the Piton des Neiges volcano during the second phase. Shield growth stage of the Piton de la Fournaise volcano is also captured in the upper part of the volcaniclastic apron, attesting to its recent
contribution. Seismic facies identified in the apron highlight a prevalence of sedimentary and reworking
processes since the onset of the volcanism compared to catastrophicflank collapses. We present here a new
model of evolution for La Réunion volcanic complex since the onset of the volcanism and argue that a major proto Piton des Neiges-Piton des Neiges volcanic complex controls La Réunion present-day morphology.
1. Introduction
Thefirst models of evolution proposed for volcanic islands were based on geological and geomorphological
studies (e.g., Rivals, 1950; Stearns, 1946; Upton & Wadsworth, 1965). Later complemented by geochronologi-cal data, they provided spatial and temporal constraints on the subaerial volcanic activity (Germa et al., 2011). Data gathered by oceanographic cruises during the last decades showed that subaerial parts of volcanic
islands represent a small percentage of the total edifice volume compared to the submarine parts (3% for
La Réunion, de Voogd et al., 1999; ~2% for Gran Canaria, Krastel & Schmincke, 2002; ~15% for Vulcano,
Romagnoli et al., 2013). Investigations of submarineflanks are therefore required to assess the whole history
of volcanic islands and to propose a complete model of their evolution. For instance, hummocky
topogra-phies on swath bathymetry and hyperbolic facies on subbottom profiles are characteristic of mass-wasting
deposits (Deplus et al., 2001; Masson et al., 2002; Moore et al., 1989, 1994). Such deposits can cover hundreds of square kilometers, reach volumes of thousands of cubic kilometers, and are common and recurrent during the whole evolution of volcanic islands (McGuire, 1996). Understanding the evolution of volcanic islands therefore requires the combined analysis of marine geophysical data sets with terrestrial observations. However, fundamental questions remain unanswered as regards the location of the main volcanic activity during the early phases of an island growth: Where was the main volcanic center located at the initiation of the volcanism? Was only one volcanic center present? If not, how many were they? How did they evolve
through time? Did they experience large flank collapses? What was the respective role of gradual
erosion/dismantling processes versus catastrophic collapses during the different building phases?
Submarine aprons surrounding oceanic islands are directly derived from volcanic activity and dismantling
processes of both the subaerial and submarine parts (Menard, 1956). They reflect the long-term evolution
of volcanic islands and therefore are keys to tackle the above questions. Nature and internal architecture of apron units can be assessed through drilling and acquisition of seismic data (e.g., Funck et al., 1996;
Journal of Geophysical Research: Solid Earth
RESEARCH ARTICLE
10.1002/2017JB014959
Key Points:
• Multichannel seismic imaging reveals the seismostratigraphy architecture of La Réunion volcaniclastic apron • Prevalence of gradual
degradation/dismantling processes on largeflank collapse events • Control of La Réunion present-day
morphology by a major proto Piton des Neiges-Piton des Neiges volcanic complex Supporting Information: • Supporting Information S1 Correspondence to: E. Lebas, elodie.lebas@ifg.uni-kiel.de Citation:
Lebas, E., Le Friant, A., Deplus, C., & de Voogd, B. (2018). Understanding the evolution of an oceanic intraplate vol-cano from seismic reflection data: A new model for La Réunion, Indian Ocean. Journal of Geophysical Research: Solid Earth, 123, 1035–1059. https://doi. org/10.1002/2017JB014959
Received 6 SEP 2017 Accepted 18 JAN 2018
Accepted article online 24 JAN 2018 Published online 20 FEB 2018
©2018. American Geophysical Union. All Rights Reserved.
Leslie et al., 2002; Rees et al., 1993; Schmincke & Sumita, 1998; Urgeles et al., 1998; Wolfe et al., 1994). For
instance, correlations between seismic data, drilled lithologies, and onshore observations identify specific
periods in the Canary Islands volcanism within the apron providing insights on their evolution (Funck et al., 1996; Urgeles et al., 1998).
This contribution aims to provide new insights on the evolution of an isolated oceanic intraplate volcano from investigations of its volcaniclastic apron, based on results from La Réunion. Analysis of the seismic data gath-ered during the FOREVER cruise allows us to study the processes captured in the offshore sediment record and to propose a new model of evolution of La Réunion volcanic complex since the onset of the volcanism.
2. Previous Models of Evolution
La Réunion Island is located in the Mascarene Basin, in the Indian Ocean, approximately 750 km east from Madagascar (Figure 1, inset). It is thought to have formed from a mantle plume that was also responsible
for the Deccan Traps (~65 Ma), the Laccadives, Maldives (~55–60 Ma) and Chagos (~47–48 Ma) Ridges, the
Mascarene Plateau (~35 Ma), and the Mauritius Island (~7–8 Ma) (Duncan et al., 1989).
Thefirst models of evolution proposed for La Réunion were based on geomorphological (Rivals, 1950) and
geological studies (Upton & Wadsworth, 1965, 1969) and identified two main volcanoes on the island: the
Piton des Neiges and the active Piton de la Fournaise (Figure 1b). Results from successive geochronological studies complemented these models, providing temporal and spatial constraints on the evolution of the two volcanoes (Figure 1a) (Gillot et al., 1994; Gillot & Nativel, 1989; McDougall, 1971; Salvany et al., 2012). The
oldest subaerial lava flows were dated at 2.17 ± 0.03 Ma (Quidelleur et al., 2010) and found in La
Montagne Massif (Figure 1b). This massif represents ~5% of the present-day island surface area and was
inter-preted as the remnant of a proto-Piton des Neiges volcano, referred to as La Montagne (2.1–1.9 Ma; Gillot
Figure 1. (a) Building phases (color) and erosional intervals (gray) related to the Piton des Neiges (blue) and the Piton de la Fournaise (green) volcanoes from on-land observations. Roman numerals correspond to the names of the building phases usually given in the literature for the Piton des Neiges. Light colors indicate differentiated series. Ages are from (1) Quidelleur et al. (2010), (2) McDougall (1971), (3) Bachèlery and Mairine (1990), (4) Gillot et al. (1994), (5) Merle et al. (2010), and (6) Salvany et al. (2012). (b) Main morphological structures identified on land are indicated in blue for the Piton des Neiges and in green for the Piton de la Fournaise. Green dot indicates the location of the Grand-Brûlé drill hole. Inset: Location of La Réunion Island in the Mascarene Basin (Indian Ocean) from predicted bathymetry (Smith & Sandwell, 1997).
et al., 1994). According to Gillot et al. (1994) and Salvany et al. (2012),
La Montagne edifice experienced, at least, one catastrophic flank
collapse at 1.8 Ma. Following a period of quiescence in volcanic activ-ity of ~500 ka, the Piton des Neiges was emplaced between 1.4 Ma and 30 ka (Salvany et al., 2012), and is now located in the northwes-tern part of the island. Its volcanic activity is divided in two main
stages (Figure 1a). Thefirst stage (1.4–0.43 Ma; based on the
interpre-tation of La Montagne volcano as being the subaerial protoedifice of
Piton des Neiges) corresponds to the shield building phase, and mainly consisting of emissions of aphyric and olivine-rich basaltic lava flows, known as the Oceanites Series (McDougall, 1971). Salvany et al.
(2012) distinguished two building phases (PN1: 1.4–0.95 Ma and PN2:
600–430 ka) during that period (Figure 1a). A period of quiescence
and intense erosion of ~90 ka separates the two stages. From 430 ka to 30 ka the Piton des Neiges stratovolcano was emplaced.
Two building phases (PN3: 340–220 ka and PN4: 140–30 ka) have also
been distinguished (Salvany et al., 2012) during this second period (Figure 1a). Lavas from basalts to trachytes were emitted during this period, also known as the Differentiated Series.
The Piton de la Fournaise volcano was built contemporaneously to the volcanic activity of Piton des Neiges (Figure 1a). Radiogenic ages
obtained on F-rich lava flows recognized within the Rivière des
Remparts, Rivière de l’Est, and Rivière Morne-Langevin (Figure 1b)
dated the onset of the Piton de la Fournaise volcanic activity at, at least, 527 ka (Gillot & Nativel, 1989). Merle et al. (2010) recently proposed a younger age of 450 ka. The vol-canic activity of Piton de la Fournaise is also divided in two main stages (Bachèlery & Mairine, 1990; Gillot &
Nativel, 1989; Gillot et al., 1994; Figure 1a). Thefirst stage (527 ka–150 ka) corresponds to the building of the
Ancient Shield volcano, whose volcanic center was located near the present-day site of the Plaine des Sables
(Bachèlery & Mairine, 1990; Figure 1b). During the second stage (150 ka to present), the Modern Shield edifice
was emplaced leading to the current Piton de la Fournaise. A migration of the volcanic activity toward the
east was identified between the two stages. Four volcanotectonic structures opened to the east were
observed on its eastern flank. From west to east, they correspond to the Morne-Langevin, Rivière des
Remparts, Plaine des Sables, and Enclos-Fouqué/Grand-Brûlé structures (Figure 1b).
The geothermal exploration carried out in the Grand-Brûlé area, in the eastern part of Piton de la Fournaise
(Figure 1b), included investigation of the flank lithostratigraphy from drill hole data. Drilled lithologies
revealed the presence of a layered intrusive complex mainly composed of gabbro cumulates from 1,010 m down to 3,003.5 m (Rançon et al., 1989). This complex was interpreted as a former, shallower magma
cham-ber of an ancient edifice referred to as proto-Fournaise by Rançon et al. (1989); a large positive gravimetric
anomaly identified by Rousset et al. (1987) supported the interpretation. Geophysical data gathered
subse-quently complemented the previous findings. From interpretations of gravimetric and magnetic data,
Malengreau et al. (1999), Lénat et al. (2001), and Gailler and Lénat (2010, 2012) associated this intrusive
complex to an older volcanic edifice, referring to it as Les Alizés. Lénat et al. (2001) proposed an age older
than 0.78 Ma for Les Alizés volcano from magnetic observations and a size similar to the present-day Piton des Neiges, based on similitudes observed between the dimensions of the two gravimetric anomalies recog-nized. The lack of on-land evidence of Les Alizés volcano led Lénat et al. (2001) to propose a complete
dismantlement of the volcanic edifice by, at least, one large flank collapse. In their model, the Piton des
Neiges, Les Alizés and Piton de la Fournaise volcanoes were all affected by large, subaerialflank collapses
whose related deposits accumulated offshore, leading to the formation of the four submarine bulges identi-fied by Labazuy (1996) on the bathymetry.
Over the last decades, several research cruises carried out offshore La Réunion investigated the submarine
terrains. Debris avalanche deposits were identified offshore Piton de la Fournaise during the Fournaise 1
and Fournaise 2 cruises (Labazuy, 1996; Lénat et al., 1989). Seismic data collected during the REUSIS cruise
Figure 2. Location of the seismic profiles collected during the REUSIS (1993) and FOREVER (2006) cruises. Green lines correspond to the location of the seismic profiles illustrated in this contribution.
captured the sediment record offshore La Réunion down to the oceanic basement, in the eastern region and a part of the southern one (de Voogd et al., 1999; Figure 2). A prominent horizon, named V, was recognized and interpreted as the top of sedimentary units predating the volcanism (de Voogd et al., 1999). The lack of
angular unconformities within the apron revealed the absence offlexure of the lithosphere under the load of
Figure 3. (a) Combined bathymetry (FOREVER and ERODER1 cruises) and topography data of La Réunion volcanic complex illuminated from NW. Dashed thick circle indicates the base of the volcanic complex as delimited by Le Friant et al. (2011). Note the coincidence between the center of the circle, shown by the blue star, and the summit area of the Piton des Neiges. Black square indicates the location of the oldest submarine dredged sample dated at 3.77 Ma by Smietana (2011). Thin dashed lines delimit the turbidite systems identified by Sisavath et al. (2011) and Mazuel et al. (2016). The numbers 1–5 correspond, respectively, to the deep-sea fans of Cilaos, Mafate, Saint-Denis, Salazie, and Saint-Joseph. ESR: Etang Salé Ridge. MM: La Montagne Massif. PdN: Piton des Neiges. PdF: Piton de la Fournaise. GB: Grand-Brûlé. NESZ: NE Sedimentary Zone. Cilaos c.: Cilaos canyon; same for Mafate c., St Denis c., Salazie c., and St Pierre c. (c.: canyon). (b–h) Seismic profiles illus-trating the seismic expression of the main morphological features of the seafloor discussed in the text.
La Réunion volcanic edifice (de Voogd et al., 1999) contrary to previous suggestions (e.g., Bonneville et al., 1988). Velocity models derived from the REUSIS OBS and on-land data supported this interpretation (Charvis et al., 1999; Gallart et al., 1999).
From a compilation of all the marine geophysical data sets available prior to 2006, Oehler et al. (2008) proposed that at least 47 mass-wasting events affected La Réunion, 37 of which had a submarine origin. Giant landslides were therefore considered a major and recurrent process during the whole evolution of
the volcanic edifice. However, the data available prior to 2006 solely covered the southeastern flank and a
section to the southwest; the northeastern and northwesternflanks being only constrained by few isolated
profiles (e.g., Figure 1 in Oehler et al., 2008).
The FOREVER cruise was thus carried out in 2006 and provided for thefirst time full coverage of La Réunion
submarineflanks and surrounding abyssal plain (Figure 2). Five large deep-sea fans (numbered 1 to 5 in
Figure 3a) were discovered offshore La Réunion from combined analysis of swath bathymetry, backscatter, and 3.5 kHz echo sounder data (Mazuel et al., 2016; Saint-Ange et al., 2011; Sisavath et al., 2011). Sea bottom
morphology analysis performed by Le Friant et al. (2011) showed that the base of the volcanic edifice
(defined as the slope transition between the volcanic complex and the surrounding seafloor) could be
approximated by a circle with a radius of ~100 km (dashed circle in Figure 3a). Contrary to its elongated sub-aerial form, La Réunion submarine base has a circular shape. The center of the circle is located at the summit area of Piton des Neiges, suggesting that the Piton des Neiges was the main volcano on which evolved the entire complex of La Réunion. Chaotic deposits, recognized offshore the active Piton de la Fournaise volcano
(e.g., Labazuy, 1996; Lénat et al., 1989; Oehler et al., 2004, 2008) extend far away beyond the edifice base
while elsewhere, chaotic deposits do not extend on the abyssal plain as pointed out by Le Friant et al. (2011). The absence of chaotic deposits on the abyssal plain offshore Piton des Neiges led these authors to
propose two distinct behaviors for the volcanoes: while Piton de la Fournaise experienced catastrophicflank
collapses, the Piton des Neiges would be affected by slow deformation processes such as sliding and spreading.
The geomorphological and geochronological study performed by Salvany et al. (2012) underlined the
absence of large subaerialflank collapses from the Piton des Neiges since 1.4 Ma, possibly longer. The authors
considered erosion and particularly gradual disintegration as a prevailing factor during the whole evolution of the Piton des Neiges, having greatly contributed to shape its present-day morphology.
3. Data Acquisition and Processing
The FOREVER cruise onboard French R/V L’Atalante (2006) collected a dense network of marine geophysical
data (swath bathymetry, backscatter, 3.5 kHz echo sounder, seismic, gravity, and magnetic data) on La
Réunion submarineflanks and surrounding abyssal plain (Deplus, 2006). The 24-channel, high-resolution
seis-mic reflection profiles, with a total length of 12,200 km, were gathered using three different configurations
(Figure 2 and Table 1). Most profiles (1–54 and 61–64) were acquired using two GI air gun sources (45/45
and 105/105 in.3) towed at ~6 m below the sea surface, with a shot spacing of 10 s (~50 m). A few profiles
(55–60 and 65–73) were acquired with slightly different source configurations, as detailed in Table 1. All data
werefiltered, stacked, and migrated using seawater velocity (1,500 m/s) within the Seismic Unix software©
(Cohen & Stockwell, 1996). Navigation was based on GPS data providing a positioning accuracy of a few meters.
The 96-channel, seismic reflection profiles, with a total length of 2,500 km, were previously collected on the
southeastern and southwestern submarineflanks, up to ~50 km from the edifice base during the REUSIS
cruise (R/V Marion Dufresne, 1993; Figure 2). Source and recording parameters are summarized in Table 1 and details on data processing may be found in de Voogd et al. (1999).
4. Architecture of La Réunion Volcaniclastic Apron
The high-resolution and full coverage of the FOREVER swath bathymetry and seismic data afford us a detailed
characterization of La Réunion submarineflanks and surrounding seafloor morphology. Here we present the
varying morphology of the seafloor and describe the related seismic expressions from the coastline toward
4.1. Seafloor Morphology and Related Seismic Expression Offshore La Réunion
A shallow submarine shelf extending to a water depth of ~100 m borders La Réunion Island (Oehler et al., 2008; Figure 3a). Offshore Piton des Neiges, the shelf is well developed with a maximum width of 7 km near La Montagne Massif (Figure 3a) and an average width of 2.5 km elsewhere (Oehler et al., 2008). Offshore Piton de la Fournaise, the shelf becomes narrower (0.5 km to 1 km) while it is entirely missing offshore the Grand-Brûlé. Oehler et al. (2008)
ascribed its origin to repeated eustatic sea levelfluctuations.
La Réunion submarineflanks show gentle slopes with an average of
about 5° that extend down to a water depth of ~4,000 m. The dashed circle shown in Figure 3a indicates the base of the volcanic
edifice (defined as the slope transition between the volcanic
com-plex and the surrounding seafloor) as delimitated by Le Friant
et al. (2011). The volcaniclastic apron as described in the literature (e.g., Menard, 1956; Schmincke & Sumita, 1998) extends far beyond the slope transition. In the seismic data, a prominent and prevalent
opaque facies overlain by thin chaotic reflections characterizes La
Réunion submarineflanks (Figure 3b). This chaotic facies is draped
in places by low- to medium-amplitude, wavy to subhorizontal,
parallel seismic reflections (Figure 3b, inset).
Several canyons cut through the submarineflanks and delimit the
upper parts of five large volcaniclastic turbidite systems named
Cilaos, Mafate, Saint-Denis, Salazie, and Saint-Joseph (Figure 3a). These turbidite systems, also known as deep-sea fans, are clearly
identifiable on the FOREVER backscatter sonar images (see Figure
1 in Saint-Ange et al., 2011 and Figure 2 in Sisavath et al., 2011). The Cilaos deep-sea fan corresponds to the largest turbidite system recognized offshore La Réunion. It covers an area of about
15,000 km2(Sisavath et al., 2011), three times more than the
coales-cent deep-sea fans of Mafate and Saint-Denis (Mazuel et al., 2016). A prevalent, acoustically opaque seismic facies overlain by chaotic
reflections characterizes the head of the submarine canyons. In
the proximal area of the turbidite systems, the seismic signature
changes and a chaotic facies overlies highly disrupted reflections
of variable amplitudes (Figure 3c). In the Salazie deep-sea fan,
dis-turbed reflections truncate underlying layers (Figure 3d), attesting
to the erosional character of the turbidites on the underlying units. This erosional unconformity disappears further north and only
well-bedded reflections compose the distal part of the turbidite system.
Bedded to well-bedded reflections also characterize the deep-sea
fan of Cilaos. This seismic facies is comparable to the well-bedded
facies encountered in the flat-lying part of the abyssal plain
(Figure 3f).
Sediment waves observed around La Réunion are radially
distribu-ted (Figure 3a) and identified up to 30 km beyond the slope
transi-tion (Le Friant et al., 2011). Their dimensions are up to several kilometers in wavelength and tens of meters in amplitude. In the seismic data, low- to medium-amplitude, disrupted to subparallel,
internal reflections characterize the sediment waves (Figure 3e).
When located on the sides of sedimentary fan paths, such as
Tab le 1 Su mmary of th e Acquisition Parameters of the Two Seis mic Surveys Mentioned in Th is Con tribution Crui se Set Lines Source s Numb er of guns Gun depth (m ) Str eamer lengt h (m) Nu mber of channe ls Chan nel spacing (m) Streame r dep th (m ) Minim um offse t (m) Sho t interva l (s) Avera ge band width of the processed data REU SIS (1993) 1 W a 9 L (6) + 5 L (2) 8 1 0– 20 2,400 96 25 2 5 270 20 10 –30 Hz 2 C/R a 16 L 8 10 –20 2,400 96 25 2 5 270 80 10 –30 Hz FOREV ER (2006) 1 1– 54 + 6 1– 64 45 /45 –105/1 05 (Cu.I n) b 2 6 300 24 12,5 4– 1 0 204 –214 10 10 –90 Hz 25 5– 56 35 /35 –105/1 05 (Cu.I n) b 2 3 300 24 12,5 3– 5 177 6 1 0– 90 Hz 35 7– 60 + 6 5– 73 10 5/105 –45/ 45 (Cu.I n) b 2 3 300 24 12,5 4– 1 0 214 –224 10 10 –90 Hz a de Voogd et al. (1999) and Pou Palomé (1997). b G I air gun vo lumes give n a s genera tor volume/inj ector volum e.
offshore the canyons of Mafate, Saint-Denis, and Saint-Pierre, the sediment waves can be related to active channel sedimentary processes (Mazuel et al., 2016; Saint-Ange et al., 2011). Elsewhere, Le Friant et al.
(2011) ascribed their origin to unconfined turbidity flows on the flanks of the volcanic complex, which
could be related to the spreading of the volcano that continuously dismantled the superficial part of the
flanks. Chaotic terrains characterizing the submarine flanks would serve as irregularities to form these sediment waves.
Submarine landslides of variable sizes are widely observed around La Réunion and mainly recognized at the
foot of the submarineflanks (Figure 3a). They correspond to the front instabilities described by Le Friant et al.
(2011). A prevalent, acoustically opaque seismic facies characterizes the most voluminous landslides
(Figure 3h), while the smaller instabilities show chaotic reflections of variable amplitudes (Figure 3g). Such
signature is also observed at the toe of the large front instabilities, where the slumped mass desegregates to form hummocks (Figure 3a). Offshore the Piton de la Fournaise, the presence of hummocks is related to
debris avalanche deposits resulting fromflank collapses that affected the edifice (Labazuy, 1996; Le Friant
et al., 2011; Lénat et al., 1989; Oehler et al., 2004, 2008).
4.2. Seismic Sequence Analysis
Four units are recognized in the seismic data and numbered I to IV from the oldest to the youngest (Figure 4).
The basal unit I displays relatively low-amplitude reflections. The second unit (II) shows low- to
medium-amplitude reflections and is bounded at its base by a prominent horizon that we refer to as horizon V
(Figures 4 and 5). Another strong reflection marks the upper boundary of the unit II and, consequently, the
base of the unit III (Figure 4). We call this strong reflection horizon S. We delineate the horizons V and S all
around the island (Figures 6a and 6b). In the eastern region, it is worth pointing out the striking undulated
morphology of the horizon S (Figure 7). The third unit (III) identified shows higher-amplitude seismic
reflec-tions than the two previous units, which is particularly evident in the distal area, and is bounded at its top by
another prominent reflection, which is clearly—but only—identified in the northern region (Figures 4 and
6c). We call this strong reflection, horizon H1, which scarcely displays an undulated morphology in the
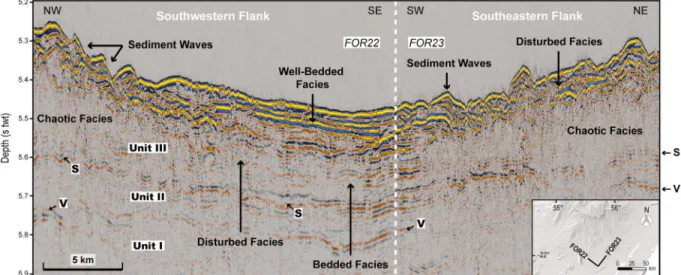
Figure 4. Seismic profiles showing the four seismostratigraphic units identified in the volcaniclastic apron offshore La Réunion Island (a) in the distal region and (b) in the proximal region. The basal unit I shows the lowest amplitudes, while the unit III shows the highest amplitudes. The last unit IV is characterized by a semitran-sparent facies, where internal reflections can be seen. The prominent horizons V and S bound the units II and III at a regional scale, while the horizon H1is only observed in the northern region. Note the reverse polarity of the horizon V in the northern distal region.
proximal area (Figure 4b). The youngest unit IV, which is not visible everywhere, exhibits an acoustically
semitransparent facies, with low- to medium-amplitude, wavy to subhorizontal, parallel internal reflections
(Figure 4). Two other horizons are identified locally in the southeastern region and correspond to the
hori-zons H2and H3(Figures 6d, 6e, and 7).
Each horizon has been picked on the FOREVER seismic lines using the SMT Kingdom Suite software and correlated along strike and between parallel lines through comparisons of the seismic signatures of the units
Figure 5. Continuity of the two prominent horizons V (deeper) and S (shallower) identified in the volcaniclastic apron between the southeastern and southwestern submarineflanks. Inset: Location of the seismic lines.
Figure 6. Extent and two-way travel time (TWT) for the horizons (a) V, (b) S, (c) H1, (d) H2, and (e) H3superimposed on shaded bathymetry. Dashed line separates the deeper northern region mentioned in the text from the shallower southern region. Because of the poor seismic imaging in the thickest parts of the edifice, the horizons have not been identified on the submarine flanks. Note the local character of the minor prominent horizons H1, H2, and H3, while the horizons V and S are regionally mapped.
identified above and below. Two-way travel time (TWT) and geographic positioning for each horizon have been then extracted from the Kingdom Suite project. To corroborate the uniqueness of the horizons, a cross-over error analysis has been performed on the horizons TWT time using the radial seismic lines. TWT time differences at internal FOREVER crossover are less than 0.02 s and probably related to the picking. These low values attest to the recognition of the same horizons on the parallel seismic lines.
To investigate the depth variations of the horizons and the thickness of the seismostratigraphic units, we constructed regular grids using the GMT software (Wessel & Smith, 2004) with a grid spacing of 10 km, which results from the mean distance between adjacent seismic lines.
4.3. Tie With the REUSIS Data
Parts of the eastern and southern regions of the volcaniclastic apron were previously imaged down to the oceanic crust during the REUSIS cruise, but at a lower resolution (e.g., de Voogd et al., 1999). Difference in
Figure 7. (a) Seismic profile FOR66 underlying the presence of local horizons H2and H3in the volcaniclastic apron east of La Réunion. While the horizons V and S are identified at a regional scale, the horizons H2and H3are only observed offshore the southeastern submarineflank. Note the high amplitude of the horizon S and its specific undulated morphology. High amplitudes are also noted for the horizon V. Note the absence of a superficial unit characterized by an acoustically semitransparent facies (like Unit IV in the northern region). (b) Interpretation of the seismic profile FOR66. Inset: Location of the seismic profile.
the frequency bandwidth of the two seismic data sets (Table 1) results in wavelets of ~50 ms wide for the
REUSIS data and of 12.5 ms for the FOREVER data. It is therefore difficult to precisely tie reflectors between
the two surveys. As few seismic lines were collected beyond the edifice base during the REUSIS cruise and
since the configuration used during the FOREVER experiment did not allow penetration of the acoustic
signal below the volcanic edifice, correlation of the two seismic data sets can only be performed between
a few seismic profiles. However, at existing intersections, it appears that the deeper horizon highlighting in
our data (horizon V) correlates with the horizon also named V in the REUSIS interpretations (Figure 8) and considered by de Voogd et al. (1999) as the top of sedimentary units predating the volcanism. TWT time differences at FOREVER-REUSIS crossover are generally less than 0.05 s and of 0.01 s (TWT) at the
intersection between the profiles R4 and FOR20 (Figure 8), attesting to the recognition of the same
horizon V on the FOREVER seismic profiles. The full coverage of the FOREVER seismic lines enables to
extend the location of the horizon V of de Voogd et al. (1999) all around the island (Figure 6a).
Thereafter, we investigate the distribution of the material deposited in the volcaniclastic apron of La Réunion above and between each horizon, in order to identify potential changes in the source(s) of sediment supply
during the evolution of the volcanic complex. We then discuss in section 6 the significance of the horizons,
together with the nature, origin, and mode of deposition of the seismostratigraphic units with respect to the evolution of the volcanic complex.
5. Depth Variations of the Horizons and Thickness Maps
5.1. Influence of the Seismic Velocity
Figure 6 shows the extent and TWT time for each horizon. As seafloor topography induces lateral variations of
seismic velocity, we also constructed depth maps for the horizons V and S using a seismic velocity of 1,500 m/s
in the water column and a higher velocity within underlying material. Unfortunately, the configuration used
to collect the seismic data during the FOREVER cruise did not permit to constrain the seismic velocities within the apron. We therefore consider the seismic velocities derived by Charvis et al. (1999) and Gallart et al. (1999) from the OBS data gathered during the REUSIS cruise. An average velocity of 4,000 m/s has been proposed by
the authors. Such velocity is well adapted for the volcanic edifice but probably not for the
volcanosedimen-tary units composing the distal part of the apron. We thus present depth-converted maps (Figure S1 in the
Figure 8. (a) Correlation of the deeper horizon V identified on the FOREVER seismic lines to the horizon also named V in the REUSIS profile R4 (modified from Pou Palomé, 1997). Black arrow labeled B indicates the top of the oceanic basement from de Voogd et al. (1999), while other black arrows represent the horizon V identified in our data and in the REUSIS profile. Poor signal penetration in the thickest parts of the submarine flanks prevents to identify the horizon B in the FOREVER lines. Note the difference in vertical resolution between the two data sets. (b) Enlargement of the correlation of V between the profiles R4 and FOR20. Inset: Location of the seismic profiles.
supporting information) using a range of seismic velocities from 2,000 m/s to 4,000 m/s within the sediment. A seismic velocity of 2,000 m/s is comparable to the P wave velocities measured at Site 953 in the volcaniclastic apron offshore Gran Canaria (e.g., Funck & Lykke-Andersen, 1998) and in the Lesser Antilles (e.g., Le Friant et al., 2015). For the thickness of the seismostratigraphic units, there is a linear relationship
between the TWT time and thefigure in meters. We therefore only discussed the thickness maps in time.
5.2. Depth Maps
All maps produced for the horizons V and S show a strong difference between the northern and southern regions (Figures 6a, 6b, and S1). Whatever the seismic velocity used within the apron, the greater depths are always located in the northern region. Deplus et al. (2009) reported the same observation for the base-ment topography. This observation, together with ours, suggests a control of the basebase-ment morphology on the horizons depth. The second feature observed both on the time and depth domain converted maps, is the shallowest area offshore the Piton de la Fournaise, which is present for the horizons V and S (Figures 6a, 6b, and S1).
5.3. Thickness Maps
5.3.1. Above the Horizon V (From Unit II to Unit IV)
Cumulative isopach map of the units deposited above the horizon V (units II, III, and IV) shows an increase in thickness toward the island, which attests to a material origin from La Réunion (Figure 9a). These units
repre-sent the volcaniclastic apron of La Réunion, which extends beyond the edifice base (indicated with the dash
circle in Figure 9) up to a distance of about 70 km northward. The thickness increases from 0.20 s TWT in the distal region, with a minimum value of ~0.10 s TWT offshore Mauritius, to 0.60 s TWT in the proximal region. The contour map shown in Figure 9a reveals a progressive increase and a regular material distribution cen-tered on Piton des Neiges, as depicted by the subcircular shape of the isopachs. For example, the dash circle, whose center is located on the present-day summit of Piton des Neiges, roughly corresponds to the 0.40 s TWT isoline (transition between the yellow and orange areas). Four local accumulations are, however,
observed beyond the edifice base. The largest accumulation (v1) is located in the northern region, while
the second and third major accumulations (v2and v3) are located in the southeastern and southern regions.
Each accumulation shows thicknesses ranging from 0.30 s to 0.35 s TWT. The last accumulation (v4)
corre-sponds to the smallest accumulation identified in our data. It is located in the distal part of the northern
region and shows an average thickness of less than 0.30 s TWT. Due to its location, we relate it to the
Mauritius Island. Despite the accumulation v4, the contribution of Mauritius in supplying material to the
volcaniclastic apron of La Réunion appears to be low since the deposition of the horizon V.
5.3.2. Between the Horizons V and S (Unit II)
Figure 9b1 shows the thickness distribution of the material deposited around La Réunion between the hor-izons V and S, which corresponds to the thickness of the unit II (Figures 4, 5, and 7). The thickness is relatively homogeneous in the distal part of the northeastern, southeastern, and southwestern regions, while two
major accumulations are observed close to the edifice base. The largest accumulation b1is located to the
north and shows a thickness that exceeds 0.25 s TWT at the base of the submarineflanks, which slightly
decreases to 0.10 s TWT beyond the edifice base. Bedded layers compose the accumulation b1(Figures 4b
and 10b/10c). The second accumulation b2is located in the southeastern region and shows thicknesses
ranging from 0.20 s TWT close to the edifice base to 0.10 s TWT beyond. The lateral extent of b2is restricted
within a broadly round shape, which contrasts with the widespread extent of b1. Bedded layers also compose
the accumulation b2and are particularly well observed in the distal part of the accumulation (Figure 10d). The
rough and chaotic terrains that characterize the submarineflank, together with the presence of highly
disrupted reflections below, obscure the interpretation of the seismic facies that constitute the central part
of b2. Nevertheless, we can clearly identify in places discontinuous bedded reflections indicating the
presence of stratified material in the central area, attesting to a deposition due to gradual dismantling.
Four smaller accumulations named b3, b4, b5, and b6 are observed locally. Each accumulation displays
bedded (b3) to well-bedded (b6) layers, except the accumulations b4 and b5, which exhibit, respectively,
highly (proximal area; Figure 3c) to slightly (distal area) disrupted reflections and a thin chaotic facies
under-lain by bedded reflections (Figure 10a). Despite this thin chaotic facies, the seismic signatures recognized
Figure 9. Thickness distribution of material deposited offshore La Réunion superimposed on shaded bathymetry (left column). (a) Above the horizon V (i.e., cumulative thickness of the units II, III and IV). Dashed circle, the center of which is shown by a star, indicates the base of the volcanic complex. (b1) Between the horizons V and S (i.e., unit II) and (b2) above the horizon S (cumulative thickness of the units III and IV). (c1to d2) During the most recent building periods of the volcanic complex, respectively, offshore the northern and southeastern regions. (e1and e2) Detailed evolution in the southeastern region. Contour lines of the thickness distribution of material deposited offshore La Réunion superimposed on shaded bathymetry (right column). Main contour lines are of 0.05 s (TWT). Dashed lines in the northwestern region delimits the front instability recognized by Le Friant et al. (2011). The colors on the isopach maps indicate the extent of bedded to well-bedded facies (light green), chaotic facies (dark blue) and a combination of chaotic to highly disturbed seismic facies (gray). Seismic profiles 05, 06, 20-21, and 15 are illustrated in Figure 10, while the profile 16 is illustrated in Figure 4b. CC: Cilaos Canyon. SC: Salazie Canyon. EP: Eastern Plateau. Color bar scale is slightly different for e1to e2, to better identify the pattern of the material distribution during these recent time intervals.
5.3.3. Above the Horizon S (From Unit III to Unit IV)
Material deposited above the horizon S and beyond the edifice base mainly accumulates in the northeastern
and southeastern regions (Figure 9b2). A progressive and regular increase in the material thickness centered on the summit area of Piton des Neiges is depicted by the subcircular shape of the isopachs. Minimum thickness
(<0.10 s TWT) is recognized south of Mauritius. The accumulations identified in the northeastern and
south-eastern regions may be divided up into subzones that we call s1, s2, s3, and s4. The average thickness in each
area decreases from 0.25 s TWT at the edifice base (exceeding 0.40 s TWT in the subzone s4) to 0.10 s TWT in the
distal areas. Thicknesses measured in these subzones are approximately twice as high than those measured in
the western region. It is interesting to note that each subzone extends up to ~50 km from the edifice base, with
the exception of the subzone s1, which only extends ~35 km away. The extent of the subzone s1is limited by the
presence of the volcanic feature identified in Figure 3a, which may have acted as barrier to sediment
migration further north. Of particular interest is the widespread extent of a chaotic facies in the eastern region
(Figure 10e), which almost entirely covers the surface area of the subzone s3(Figure 9b2). The chaotic facies
can be mapped until the Mauritius Fracture Zone, approximately 55 km from the edifice base.
5.3.4. Between the Horizons S and H1, and Above H1(NE Region)
Material continues to accumulate in the northern region between the horizons S and H1(Figure 9c1) and
displays well-bedded seismic reflections in the distal area (Figure 4a), slightly disturbed locally in the proximal
area (Figure 4b). Above the horizon H1(unit IV; Figure 4), material accumulates in a different area: offshore the
canyon of Salazie (Figure 9c2). Material thickness exceeds 0.16 s TWT in the central part of the accumulation to regularly and progressively decrease to 0.12 s TWT at the edges, while it is ~0.08 s TWT elsewhere. The shape of the isopachs allows to trace back the source of the material supply to the canyon of Salazie. Well-bedded
seismic reflections, similar to the ones observed in unit III (Figure 10c) and defining the bedded facies shown
in Figure 9b1 (green areas), characterize the accumulation, while a semitransparent facies with wavy to
sub-horizontal, parallel internal reflections of moderate amplitudes defines the surrounding areas (Figure 4).
5.3.5. Between the Horizons S and H2, and Above H2(SE Region)
5.3.5.1. Between the Horizons S-H2and Above H2
Half volume of material accumulated in the southeastern region between the horizons S and H2than in the
northeastern region between S and H1(Figure 9d1 compared to Figure 9c1). Material mean thickness is about
0.05 s TWT and small accumulations of ~0.09 s TWT thick are only observed near the Mauritius Fracture Zone.
Bedded and well-bedded seismic reflections characterize the material deposited between S and
H2(Figure 10d).
Above the horizon H2, twice as much material accumulated in the southeastern region than between S and
H2(Figure 9d2 compared to Figure 9d1). A progressive and regular decrease toward the Mauritius Fracture
Figure 10. Seismic profiles (a) FOR05, (b) FOR06, (c) FOR21-FOR20, (d) FOR15, and (e) FOR63 illustrating the seismic signature of the material composing, respectively, the accumulations b5, b1, b1, b2, and offshore b2. Inset: Location of the seismic lines presented here.
Zone is shown by the isopachs. Material thickness reaches 0.15 s TWT at the edifice base, up to 0.19 s TWT offshore the Eastern Plateau, to slightly decrease to 0.10 s TWT toward the distal region. Well-bedded seismic
reflections directly lie on the horizon H2(Figure 10d) and are clearly identified in the distal region. These
well-bedded reflections are overlain by a chaotic facies (Figure 10e), which was interpreted by Le Friant et al.
(2011) as a mass-wasting deposit, whose maximum thickness reaches ~0.09 s TWT in the central area. Another chaotic facies of about 0.02 s TWT thick, older than the aforementioned deposit, is observed directly
over H2(Figures 7 and 10d). This deposit is covered by disturbed seismic reflections.
Unfortunately, we were not able to trace the horizon H2to the southern region, preventing investigation of
the subzone s4(Figure 9b2).
5.3.5.2. Between the Horizons H2-H3and Above H3
Another prominent reflector is observed above the horizon H2and widely recognized in the southeastern
region, covering an area comparable to that of the horizon H2(Figures 6e, 7, and 10d and 10e). This strong
reflection, referred to as horizon H3, is particularly well observed in the distal region where it marks in places
the base of the mass-wasting deposit described by Le Friant et al. (2011) (Figure 10e). Thickness of material
deposited between the horizons H2and H3varies from approximately 0.10 s TWT close to the edifice base to
0.03 s TWT in the distal part (Figure 9e1). Above the horizon H3, material mostly concentrates in the central
part of the southeastern region, as shown by the contour lines in Figure 9e2. A maximum thickness of 0.10 s TWT is observed on the isopach map.
6. Discussion
The FOREVER seismic data set has provided a unique opportunity to image La Réunion volcaniclastic
apron in detail, highlighting the presence of prominent horizons at a local (H1, H2, and H3) and at a
regio-nal scale (V and S). Hereinafter, we discuss the significance of the horizons, along with changes in material
distribution during the time intervals defined by the horizons, with respect to the main building phases of
La Réunion volcanic complex.
6.1. Significance of the Horizons V and S
The horizon V wasfirst recognized by de Voogd et al. (1999) on the seismic reflection data gathered during
the REUSIS cruise. On all the profiles, they identified two major units between the sea bottom and the top of
the oceanic crust that can be distinguished by their seismic signature (Figure 8). They related the reflective
character of the lower unit, which lies directly on top of the oceanic crust, to oceanic sediment that predates
the volcanic edifice, while they interpreted the upper sequence as the volcaniclastic edifice, a term which
includes everything that was deposited regardless of the processes involved (lavaflows, mass wasting, and
sedimentation). The horizon V marks the boundary between these two units and was thus interpreted by
de Voogd et al. (1999) as a stratigraphic marker of the base of La Réunion volcanic edifice.
More recently, another interpretation of the horizon V has been proposed by Gailler and Lénat (2010). On the basis of morphological correlations between the volcanic constructions inferred from magnetic modeling and the topography of the horizon V given by de Voogd et al. (1999) from the REUSIS seismic data, the
authors interpreted the horizon V as the top of two buried, still coherent, parts of La Réunion volcanic edifice.
However, such interpretation exclusively relies on morphological correlation between their magnetic model and the depth-converted map of the horizon V shown by de Voogd et al. (1999). This map was produced using a constant seismic velocity of 4,000 m/s below the sea bottom. As pointed out by de Voogd et al.
(1999), the choice of a constant velocity for the“volcaniclastic edifice” may introduce artifacts if lateral
velo-city variations are present, a higher velovelo-city leading to a pull-up effect on the topography of the horizon.
Therefore, the presence of buried, coherent parts inside the edifice, as deduced from the magnetic modeling
of Gailler and Lénat (2010) may explain the topographic bulges observed in the depth-converted map of the horizon V shown by de Voogd et al. (1999), without making V the top of these coherent volcanic parts.
Identification of the horizon V on the FOREVER seismic lines (this contribution; see the correlation with the
horizon V of de Voogd et al. (1999) on Figure 8) enables to extend its location all around the volcanic edifice,
at great distance from the base (up to ~70 km in the northern region; Figure 6a). The horizon V therefore represents a stratigraphic marker of a major event that occurred at the scale of the surrounding basin. The cumulative isopach map we have constructed for the units deposited above the horizon V (Figure 9a)
clearly shows an increase in the thickness toward the island, attesting to an origin of the material from La Réunion. Furthermore, the horizon V corresponds to the top of the basal unit (I), which displays relatively
low-amplitude reflections. Unit I was already identified on the REUSIS seismic lines and imaged below the
edi-fice base, draping the oceanic basement (see Figure 8 in de Voogd et al., 1999). Due to its reflective character, it has been interpreted by de Voogd et al. (1999) as the oceanic sediment preceding La Réunion volcanism. A
similar interpretation for the basal units identified on the seismic profiles offshore Hawaii and the Canary
Islands, which display similar patterns, was given by Rees et al. (1993) and Urgeles et al. (1998), respectively.
It is also noteworthy that V displays a reverse polarity when compared to the sea bottom reflection,
support-ing a velocity or a density inversion (de Voogd et al., 1999; our data). All these observations are in agreement with the interpretation of the horizon V as a stratigraphic marker of the onset of La Réunion volcanism in the
surrounding basin. Hereafter, we discuss how the onset of the volcanism may produce a significant horizon.
Staudigel and Clague (2010) present a model for the growth of seamounts and volcanic islands on the
ocea-nic crust. At the beginning, the seamount grows on the seafloor through continuing eruptions of pillow lavas.
With decreasing depth, the pillow lavas become more vesicular and interlayered with pillow breccias, debris flows, and hyaloclastites. When the seamount summit reaches shallow depth, significant degassing of mag-matic volatiles takes place causing explosive activity. It is unlikely that the horizon V marks the very onset of La Réunion volcanism, since it is thought to consist in emission of densely packed and nonvesicular pillow lavas that will constitute the core of the seamount. V may be better explained by the onset of the submarine explosive activity, since material may extend far beyond the seamount core. Explosive pyroclastic activity at West Mata Volcano provided evidence that such activity can also affect basaltic systems without necessarily requiring extraordinary initial contents or accumulation of volatiles (Clague et al., 2011). The depth at which
submarine explosive activity may start is not precisely defined. Staudigel and Clague (2010) indicate a water
depth of ~700 m below sea level (mbsl), but numerous observations suggest that Strombolian basaltic erup-tions also occur at greater depths: between 500 and 1,750 mbsl along the Mid-Atlantic Ridge (Eissen et al., 2003), but also as deep as 2,200 mbsl at West Mata Seamount in the Lau Basin (Clague et al., 2011). Widespread distribution of pyroclastic deposits blanketing axial valleys have also been previously reported
at 3,800 m deep on the Gorda Ridge, in the Pacific Ocean (Clague et al., 2009), and at 4,000 m deep on the
Gakkel Ridge, in the Arctic Ocean (Sohn et al., 2008); these two ridges being volatile-poor mid-ocean ridge basalt systems.
In conclusion, we interpret the horizon V as a stratigraphic marker of the onset of the submarine explosive
activity, an early stage in the growth of La Réunion volcanic edifice. Such interpretation is slightly different
from the one of de Voogd et al. (1999), as V does not correspond to the base of the volcanic edifice sensu
stricto. In fact, neither of the two interpretations are contradictory. A careful look at the third stage of the model of the seamount growth proposed by Staudigel and Clague (2010) clearly shows that, both, the base of the seamount and the base of the unit resulting from the submarine volcanic explosive activity lie on top of
preexisting oceanic sediment and merge at the foot of the seamountflanks. Thus, beyond the edifice base,
the horizon V corresponds, at the same time, to the top of the preexisting oceanic sediment and to the onset of the submarine volcanic explosive activity.
The horizon S has also been identified all around the volcanic edifice on the FOREVER seismic lines, at great
distance from the base (Figure 6b). It is younger than V and thus indicates a major, intermediate phase in the growth of the volcanic complex. We will discuss in section 6.4.2 that it could mark the onset of the growth of the present Piton des Neiges.
6.2. Overall Morphology of the Active Volcanic Complex Through Time
Sea bottom morphology analysis performed by Le Friant et al. (2011) showed that the base of the volcanic
complex (defined as the slope transition between the volcanic complex and the surrounding seafloor) could
be approximated by a circle with a radius of ~100 km (dash circle in Figure 3a), which contrasts with its elon-gated subaerial form. In addition, the center of the circle is located at the central area of Piton des Neiges,
suggesting that this edifice was the main volcano on which evolved the entire complex of La Réunion. A first
order analysis of material distribution in the volcaniclastic apron of La Réunion through time strengthens this interpretation. Indeed, the material distribution above the horizons V and S (Figures 9a and 9b2) reveals a progressive and regular increase in the units thickness toward the central area of Piton des Neiges, at any time. The subcircular shape of the isopachs, together with this progressive and regular pattern, suggests
the existence of a single, major source of material supply centered on Piton des Neiges during the whole evo-lution of the volcanic complex. The sedimentary record does not support the existence of another volcano comparable in size and lying beside the Piton des Neiges as suggested for Les Alizés volcano (e.g., Gailler
& Lénat, 2010; Lénat et al., 2001; Oehler et al., 2004, 2008; Smietana, 2011). Such a configuration (see Figure
3 in Oehler et al., 2008) would have led to different isopach patterns displaying an elliptical shape or even
an“8” shape, consistent with two distinct material supply sources comparable in dimension. The lack of
evi-dence of Les Alizés volcano in the present-day morphology of the volcanic complex, as well as in our seismic data, leads us to ascribe a much smaller size for Les Alizés volcano comparable to that of Piton de la Fournaise.
6.3. Gradual Degradation/Dismantling Versus Catastrophic Flank Collapses
From interpretation of bathymetric and acoustic data available prior to 2006, Oehler et al. (2004, 2008)
concluded that La Réunion submarineflanks were built from accumulation of landslide deposits, mainly of
debris avalanche type. However, the data collected prior to 2006 solely covered parts of the submarineflanks,
the other ones being only constrained by few isolated profiles.
The FOREVER cruise, carried out in 2006, provided a complete coverage of La Réunion submarineflanks and
surrounding abyssal plain (Figure 2).
Joint analysis of the data (bathymetric and acoustic) enabled Le Friant et al. (2011) to characterize La Réunion
submarineflanks as rough and chaotic terrains. Offshore Piton de la Fournaise, these terrains extend onto the
abyssal plain: a speckled pattern—typical of debris avalanche deposits—is visible on the reflectivity map (see
Figure S2 in Le Friant et al., 2011) and a widespread chaotic unit is recognized in the seismic data beyond the
edifice base (Figure 10e). It is not the case offshore Piton des Neiges, indicating that the rough and chaotic
terrains ended at the base of the submarineflanks. These observations led Le Friant et al. (2011) to propose
two distinct behaviors for the volcanoes. The Piton des Neiges would be affected by slow deformation
pro-cesses such as sliding or spreading. The authors explained the chaotic texture of the submarineflanks as the
result of these slow deformation processes that continuously dismantled theflanks of Piton des Neiges,
lead-ing to the formation of numerous secondary slope instabilities. To the contrary, Piton de la Fournaise—
formed on a preexisting edifice—collapsed several times toward the sea, generating large debris avalanches
thatflowed down onto the abyssal plain.
Until recently, chaotic units observed in seismic data over the abyssal plain were interpreted as debris
avalanche deposits resulting from large, catastrophicflank collapses that affected the surrounding volcanic
islands (Deplus et al., 2001; Le Friant et al., 2003; Urgeles et al., 1997). The Integrated Ocean Drilling
Program Expedition 340 carried out offshore the Lesser Antilles provided for thefirst time evidence for the
composition and origin of such chaotic units offshore Montserrat and Martinique Islands. The seismically
chaotic deposits were successfully drilled and exclusively recovered seafloor sediment (including mud,
tephra layers, and turbidites), revealing a complete lack of volcanic debris avalanche deposits (Brunet
et al., 2015; Le Friant et al., 2015). Le Friant et al. (2015) interpreted these“seismically chaotic facies” deposits
as resulting from widespread deformation of pre-existing sediment on the abyssal plain, triggered by the
emplacement of debris avalanche deposits on the edifice flank. A closer look at the chaotic unit in the seismic
data offshore Piton de la Fournaise (Figure 10e) shows the presence of undisturbed to slightly deformed
seis-mic reflectors, alternating with a chaotic facies. These observations, along with the new Integrated Ocean
Drilling Programfindings of the Expedition 340, lead us to reinterpret this “chaotic” deposit as widespread,
deformed, pre-existing seafloor sediment resulting from the emplacement of the Piton de la Fournaise debris
avalanche deposits on the submarineflank, where hummocky terrains were previously observed (Le Friant
et al., 2011; Lénat et al., 1989; Oehler et al., 2004, 2008). Therefore, chaotic units observed in seismic data on the abyssal plain do not necessarily correspond to debris avalanche deposits as commonly and
previously thought. However, they may be regarded as evidence of largeflank-collapse events that affected
the surrounding volcanic islands.
The absence of widespread chaotic units offshore Piton des Neiges, beyond the edifice base, suggests that no
large debris avalanche depositsflowed down the submarine flanks of Piton des Neiges, despite the chaotic
texture of its submarineflanks. Seismic investigation in the volcaniclastic apron of La Réunion shed light on a
prevailing of gradual degradation/dismantling processes on large, catastrophicflank collapses, as previously
6.4. New Model of Evolution for La Réunion Volcanic Complex
Isopach mapping of material deposited above the horizon V (Figure 9a) reveals La Réunion volcanic edifice as
the main source of material from the onset of La Réunion volcanism. The minimal amount of material related to Mauritius Island above the horizon V indicates that the main building phases of La Réunion occurred after
the ones of Mauritius (i.e.,<7–8 Ma). Recognition of a discordance of the horizon V on the Mauritius flanks is
in agreement with this interpretation (de Voogd et al., 2009; our data).
6.4.1. From the Submarine Edifice to an Emergent Island (From V to S) 6.4.1.1. Construction of a Protoedifice
Direct observations of explosive submarine eruptions, and syneruptive transport and deposition of related products, are rare. To date, only the submarine eruptions of the NW-Rota-1 submarine volcano in the Mariana Arc (Walker et al., 2008) and the West Mata volcano in the Lau Basin (Clague et al., 2011) have been observed directly. In their contribution, Walker et al. (2008) reported on the nature, distribution, and dispersal of volcaniclastics during ongoing submarine eruptions at NW-Rota-1, from 2003 to 2006. The authors docu-mented two mechanisms of transport for the eruptive products: (1) gravitational collapses of the eruptive column, generating plumes at multiple depths and in all directions, transporting volcaniclastic material down
theflanks several kilometers away, and carrying fine ash layers up to tens of kilometers from the summit; and
(2) landsliding of recent ejecta accumulating near the active vents, becoming unstable and collapsing periodically. At West Mata Volcano, volcanic sand almost entirely composed the lower slopes of the volcano and mostly represented fall deposits from lava fountains and pyroclastic-rich plumes from nearby eruptions (Clague et al., 2011). Pillow breccia have also been reported near the plateaus and interpreted as resulting
from fragmentation of pillow lavasflowing down the steep slopes of the upper flanks.
We can assume that similar processes have affected La Réunion seamount during its submarine explosive activity, leading to the production and widespread dispersal of volcaniclastics in the surrounding environ-ment. Volcaniclastic deposits may have partly accumulated near the vents (bombs and lapilli), down the slopes (sand), or delivered in the distal environment (ash), landsliding and reworking contributing to further disperse these volcaniclastics toward the distal regions.
The study undertaken by Romagnoli and Jakobsson (2015) on the volcanic island of Surtsey in the
Vestmannaeyjar archipelago, underlined the importance of subaerial and submarine erosion—during and
after—the emergence of the volcanic island. This constant and rapid erosion at an island’s emergence was
also discussed by Washington (1909) at Graham Island in the Mediterranean Sea, which was eroded and leveled by wave action, before to completely disappear 6 months after its appearance. From examination
of an ODP drilling core at Site 953, Carey et al. (1998) also underlined a rapidflux of volcaniclastic material
to the marine environment during the emergence of Gran Canaria, concluding that high eruptive activity may have occurred during that time, both in the submarine and subaerial environments. We thus consider
that most of the material deposited between V and S (unit II) reflects the submarine explosive activity of
La Réunion seamount as well as the submarine and subaerial erosion and activity of the emergent island.
Observations to the north of the largest accumulation b1(Figure 9b1) led us to consider that the central area
of the emergent island was probably slightly located to the north from the current location of the summit of Piton des Neiges (black star in Figure 9). This interpretation is supported by a recent on-land study performed
by Berthod et al. (2016), which locates the magma chamber of an“initial Piton des Neiges”, 4 km north to the
current summit of Piton des Neiges. The presence of local accumulations to the south (b3), southwest (b4),
and west (b5) (Figure 9b1) suggests a size relatively important for the emergent island and the whole volcanic
edifice is named hereafter, proto-Piton des Neiges. Prevalence of bedded to well-bedded seismic reflections
between the horizons V and S indicates gradual degradation/dismantling and fallout deposition as continu-ing processes durcontinu-ing the submarine growth and the emergence of the proto-Piton des Neiges. Chaotic facies observed in the proximal region (Figure 9b1) suggests punctual occurrences of slumping and sliding processes due to oversteepening, for instance.
6.4.1.2. A Major Instability Affecting the Protoedifice?
The accumulation b2 corresponds to the second large accumulation identified between the horizons V
and S (Figure 9b1). The confined distribution of the material within b2, marked by the lobe shape of the
con-tour lines, clearly contrasts with the widespread extent of the accumulation b1. Another point of interest and
of particular significance is the coincidence between the location of (1) the highest thickness within the
undulated morphology of the horizon S, which is only observed in the southeastern region (Figures 7 and
10d). A relationship between these three features may exist and prove to be specific to the southeastern
region, since such a relationship is not observed for the accumulation b1(Figures 6b and 9b1). We have
investigated the seismic signature of the accumulation b2 to better understand and characterize its
origin. Bedded to well-bedded seismic reflections define the accumulation b2 in the distal environment
(cyan areas in Figure 9b1), which may mainly reflect deposition of material originating from gradual
degradation/dismantling and fallout processes. To the contrary, the area delimited by the subrounded contour lines in the proximal region (green areas in Figure 9b1) is characterized by a chaotic facies. Comparing with current interpretations (e.g., Le Friant et al., 2011), and based on similarities observed
with the present-day morphology of the eastern submarineflank, we interpret the wavy character of the
horizon S as reminiscent of buried sediment waves forming by deposition from turbidity currents over rough and chaotic preexisting terrains. Similitudes between the morphology of the horizon S and a
seismic reflection related to buried sediment waves offshore Borneo, in Indonesia, strongly supports our
interpretation (see Figure 12a in Posamentier & Kolla, 2003). From the seismic signature of the material
com-posing the accumulation b2, together with the lobe shape of the contour lines, we suspect the chaotic facies
recognized in the proximal area corresponds to a mass-wasting deposit resulting from a large instability that
affected the southeasternflank of the proto-Piton des Neiges (Figure 11a). This flank instability would have
partially formed the accumulation b2in the proximal region and favored subsequent development of
sedi-ment waves by turbidity currents. The wavy character of the horizon S could also be explained as resulting from compressive strains on the sediment at the front of the advancing mass-wasting deposit, as suggested by Oehler et al. (2008) to explain the presence of sediment waves around La Réunion. Both processes are in agreement with the occurrence of a large mass-wasting event.
An alternative interpretation of the accumulation b2would be to consider it as reflecting the activity of a
second volcanic vent, which would have been contemporaneous to the volcanic activity of the proto-Piton des Neiges. Direct observations of submarine explosive eruptions and well-documented eruptions of recently-formed volcanic islands showed that several vents can be active at the same time during the submarine volcanism stage (e.g., Clague et al., 2011; Schnur et al., 2017) or at the emergence of the island (e.g., Romagnoli & Jakobsson, 2015). A second volcanic vent could correspond to Les Alizés volcano, assum-ing a very small size for this volcano. However, the presence of a chaotic facies in the proximal part of the
accumulation b2, along with the lobe shape of the isopachs, are more in favor of a mass-wasting deposit.
We therefore prefer thefirst interpretation considering the accumulation b2as resulting from aflank
instabil-ity that affected the proto-Piton des Neiges.
6.4.2. From the Mature Island Stage to the Erosional Stage (From S to Present)
Above the horizon S, material deposited offshore accumulated all around the volcano. Isopach distribution of material (yellow area on Figure 9b2) underlines the existence of a single, major source of material supply
Figure 11. Model of evolution of La Réunion volcanic complex since the onset of the volcanism during the (a)first and (b) second building phases determined from our data. (1) Deposition along and beyond theflank. (2) Deposition through Salazie Canyon. The present-day shoreline of the island is shown in black and mass-wasting events represented by dark colors.