HAL Id: hal-00967972
https://hal.archives-ouvertes.fr/hal-00967972
Submitted on 31 Mar 2014HAL is a multi-disciplinary open access archive for the deposit and dissemination of sci-entific research documents, whether they are pub-lished or not. The documents may come from teaching and research institutions in France or abroad, or from public or private research centers.
L’archive ouverte pluridisciplinaire HAL, est destinée au dépôt et à la diffusion de documents scientifiques de niveau recherche, publiés ou non, émanant des établissements d’enseignement et de recherche français ou étrangers, des laboratoires publics ou privés.
Reciprocity in social networks - A case study in Tamil
Nadu, India
Subramanian Arumugam, Dominique Haughton, Balasubramanian Vasanthi,
Changan Zhang
To cite this version:
Subramanian Arumugam, Dominique Haughton, Balasubramanian Vasanthi, Changan Zhang. Reci-procity in social networks - A case study in Tamil Nadu, India. Case Studies in Business, Industry and Government Statistics, Société Française de Statistique, 2014, 5 (2), pp.126-131. �hal-00967972�
Reciprocity in social networks - A case study in Tamil
Nadu, India
Subramanian Arumugam
Kalasalingam University, India
Dominique Haughton
Bentley University, Université Paris I Panthéon-Sorbonne (SAMM) and Université Toulouse I, France
Balasubramanian Vasanthi
Kalasalingam University, India
Changan Zhang
Bentley University, USA
This case study takes us to Tamil Nadu (India) and discusses a Social Network Analysis (SNA) of a community of weavers in the village of Sankarapandiapuram. Subgroups and influential members are identified, and the analysis is placed in the context of the theory of social capital in economics. The presentation is self-contained and is accessible to readers with an introductory level of statistics.
Keywords: Social Networks Analysis (SNA), Social Capital, India, Tamil Nadu.
Introduction
Reciprocity refers to responding to a positive action with another positive action; it creates, maintains and strengthens various social bounds. It is the foundation of social order and is a major key to success.
This applies not only in social networking but also in all rounds of human activities. The potential for reciprocal actions by players increases the rate of contribution to the public good; reciprocity is a form of social obligation and is a motivation for returning favors from others (Fehr et al. 2000). Reciprocity has been studied and evaluated since the beginning of social network analysis in the 1930’s. A measure of reciprocity is a number which gives
the extent to which support is both given and received in a relationship.
Reciprocity and social capital
The investigation of social networks such as the ones in this story is important from the social capital point of view. As stated by Claridge (www.socialcapitalresearch.com), “social capital is about the value of social networks, bonding similar people and bridging between diverse people, with norms of reciprocity” (Dekker and Uslaner 2001; Uslaner 2001). Social capital in turn is of importance to economic development, an idea which has
- 127 -
Reciprocity in social networks - A case study In Tamil Nadu, India / Arumugam et al.spawned a considerable literature, dating in large part from the early 2000s.
In particular, economists have contended that social capital and network ties can correct institutional shortcomings (Dhaval Dave, personal communication, 2013). They can, for instance, compensate for a lack of formal lending or medical facilities in rural areas and also correct for information imbalances: for instance, new immigrants to the United States tend to cluster in certain areas with similar racial/ethnic groups to foster informational flows and informal transfers.
Measuring the strength of social capital is a challenge from an empirical point of view. Typically, economics research has relied on survey-based responses to questions on trust, membership in various groups, etc. (Dave 2013, personal communication). In this paper, we suggest that uni- and bi-directional flows of monetary help, advice and companionship are a substantial improvement in objectively capturing the level of social capital that is embedded in the community and that households can draw upon.
Network data
The population of our social network study is a small closed set of actors consisting of 100 well organized households in the small village ofSankarapandiapuram in Tamil Nadu, India. This village has just four streets named North Street, South Street, Kallakudi Street and Pallakudi Street (see Figures 1a, 1b and 1c). All the members of the various households under consideration belong to the same community called “Saliyar”, which is considered to be a poor community in the state of Tamil Nadu. The basic business of this community is weaving. During the past two or three decades, several members from this community have opted for higher studies and are employed in several posts such as engineers, doctors, teachers, but more than 80% of this community are engaged in weaving with either a hand or power loom and depend on their daily earning for their livelihood. Most members of the community would be considered to lie below the middle class category in India.
Most of the respondents in this study work in the surgical cotton industry, the main manufacturing product being bandage clothes, which are exported to several countries. All the households under consideration are closely located and interact among themselves almost on day-to-day basis.
We have collected data from a hundred households through a questionnaire and personal interview. The
network data include the name and age of the head of the household and his/her spouse, the educational qualifications of the head, the number of dependents in the family and their employment details.
Figure 1a. General location of the village of
Sankarapandiapuram in India
Figure 1b. Map of the village of Sankarapandiapuram in
India
Figure 1c. Satellite view of the village of
The 100 households are labeled with the numbers 1, 2, …, 100; for each household i we have data consisting of the list of households whom they approach for monetary help, advice and companionship for spending leisure time, both during crisis and normal periods. The data yield six directed graphs on the set of nodes {1,2,…,100}. Apart from the above data we also know the list of relatives and (mutual) friends for each household i, which give two undirected graphs on the same vertex set. Let D1(D2) be the directed graph representing the
network of monetary help during crisis (normal) periods.Let D3(D4) be the directed graph representing the
network of advisory help during crisis (normal) periods. Let D5(D6) be the directed graph representing the
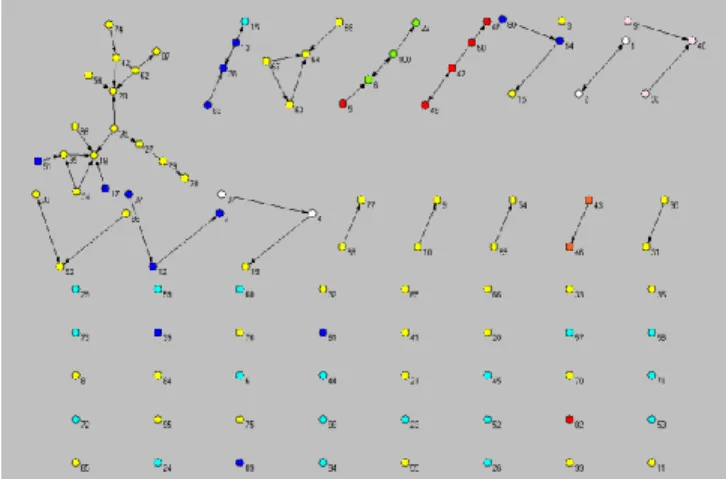
network of companionship during crisis (normal) periods. Figures 2a-b, 3a-b, 4a-b display the 6 networks. Different colors represent different extended family groups, with pale blue representing persons with no relatives in the village. A dominant group clearly emerges (colored yellow).
Reciprocity in the network
In networks D1 and D2 representing monetary help during
crisis and normal periods, on can find six and four reciprocal ties respectively; it is interesting to note that all these reciprocal ties are within relatives. In networks D3 and D4 representing advisory help during crisis and
normal periods, there are 12 and 12 reciprocal ties respectively and in both cases 10 of the reciprocal ties are within relatives. However, the reciprocity behavior is different in networks D5 and D6 representing
companionship. In network D5 there are 38 reciprocal
pairs and out of these, 21 are between relatives and 17 are between friends. In network D6 there are 46
reciprocal ties and out of these 25 are between relatives and 21 are between friends.
Thus respondents have mutual reciprocal interaction outside their circle of relatives only for companionship during leisure time. Table 1 lists the reciprocity measure for each network, equal to the proportion of links which are bi-directional.
Table 1. Reciprocity measures for each network.
Monetary Advice Companionship
Crisis Normal Crisis Normal Crisis Normal
D1 D2 D3 D4 D5 D6
.13 .10 .15 .14 .27 .33
It is clear that reciprocity is quite a bit higher in the companionship network. The difference in reciprocity in crisis and normal times is modest in general, except
possibly for the companionship network, where normal times seem to encourage reciprocity.
Figure 2a. Monetary help in crisis periods (network D1)
Figure 2b. Monetary help in normal periods (network D2)
In the monetary help networks, we observe that (42, 62) and (78, 79) are reciprocal pairs during crisis periods, but are not reciprocal during normal periods. In fact, 42 approaches 62 for monetary help only during crisis periods whereas 62 approaches 42 for monetary help both during crisis and normal periods. The same situation prevails for the pair 78, 79; here 79 approaches 78 for help only during crisis periods. There is another interesting similarity between the pairs (42, 62) and (78, 79). The respondents corresponding to each of these pairs are close relatives (father/son relationship in one case and brother/sister relationship in the other case).
In-degree and out-degree
In a directed network, the in-degree (id) of a vertex is defined to be the number of arrows directed to the vertex and the out-degree (od) of a vertex is the number of arrows which arise from the vertex. The maximum in-degrees in D1 and D2 are respectively 5 and 4; respondent
- 129 -
Reciprocity in social networks - A case study In Tamil Nadu, India / Arumugam et al.number 18 has maximum in-degree in both D1 and D2.
He is the owner of an industrial plant and is active in politics. He is also the village head and is naturally the most influential person in networks D1 and D2. We also
note that he is a member of the dominant extended family group.
Out of the 100 respondents, 65 have in-degree 0 in D1
and 68 have in-degree 0 in D2. This is perhaps not
surprising since most of the respondents under consideration lie just above the poverty line and hence are not in a position to provide monetary help to others, so that no one approaches them for monetary help. Also the maximum out-degree of a vertex both in D1 and in D2
is 3. Respondents 25 and 62, who are members of the dominant extended family group, have out-degree 3 in D1
and D2. This shows that exchange of monetary help is
very minimal in the network (see Figures 2a and 2b). On the other hand, 59 respondents have out-degree 0 in D1
and 63 respondents have out-degree 0 in D2; this shows
that a large proportion of the respondents seem to be able to cope with the limited income they earn. Perhaps this is typical of any small Indian village.
Respondent number 1 has maximum in-degree in D3 and
D4; he is educated and is a manager in a textile export
company; his wife is a tailor who produces garments intended for ladies and is an active member of the women’s self-help group in the village. Respondent number 11 has maximum in-degree in D5 and D6; he is an
astrologer.
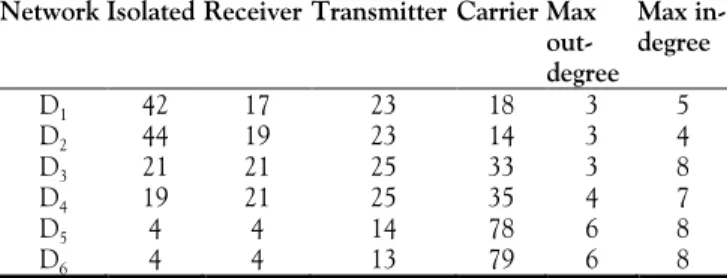
Let D=(V,A) be a directed graph. A vertex vV is called
(i) an isolated vertex if od(v) = id(v) =0 (ii) a transmitter if od(v)>0 and id(v)=0 (iii) a receiver if od(v)=0 and id(v)>0 (iv) a carrier if od(v)>0 and id(v)>0
Table 2. Distribution of the respondents across the various
categories
Network Isolated Receiver Transmitter Carrier Max out-degree Max in-degree D1 42 17 23 18 3 5 D2 44 19 23 14 3 4 D3 21 21 25 33 3 8 D4 19 21 25 35 4 7 D5 4 4 14 78 6 8 D6 4 4 13 79 6 8
The distribution of the 100 vertices in various categories is given in Table 2. It is interesting to note that transmitters (who tend to provide help/advice without expecting anything in return) display their unidirectional ties often, but not exclusively, within their family group (see for instance nodes 5, or 17 and 51 in Figures 2a/2b).
Figure 3a. Advisory help in crisis periods (network D3)
Figure 3b. Advisory help in normal periods (network D4)
Note that no respondent is isolated in all six networks. Respondent number 8 has in-degree 0 in all six networks and has out-degree 0 in all networks except in D5 and D6;
and in these networks the degree is 3. All three out-neighbors of this respondent in D5 and D6 are his
relatives. Thus no respondent approaches 8 for any type of help.
When we compare isolated vertices in networks D1 and
D2 representing monetary help, we observe that vertices 3
and 50 are isolated in the crisis network but not isolated in the normal network. Also respondents 4, 19, 34 and 37 are isolated in the normal monetary help network and are not isolated in the crisis network. Thus these respondents seek monetary help only during crisis and otherwise they are able to manage on their own.
Figure 4a. Companionship in leisure time in crisis periods
(network D5)
Figure 4b. Companionship in leisure time in normal periods
(network D6)
Connected Components
The number of nontrivial components in network D1
representing monetary help during crisis periods is 16. The number of vertices in the largest component is 16; vertices 18 and 28 play an important role in providing financial help for members of these components. Six components each with 2 vertices can be identified. The number of vertices in the largest component in network D2 is 13; here also 18 and 28 have significant
contributions. In the network of advisory help there are two large components with 31 and 22 vertices in D3 and
32 and 27 vertices in D4. The other non-trivial
components are relatively smaller. In the networks of leisure time companionship during crisis and normal period, there is a single giant component which contains 96 and 93 vertices, respectively, which indicates that the members of the community as a whole have reasonably good interaction with each other.
In the companionship network, it is interesting to note that the dominant extended family group is central and that other groups connect at its periphery. In that network, respondents 4, 37, 92 and 93 are isolated. We observe that for these respondents, isolation is a matter of personal choice. For example respondent 37 is an old woman living alone with monetary help from her sons who has no inclination for mingling with others. Similarly for other personal reasons the remaining three respondents have chosen to isolate themselves from the rest of society and do not entertain visitors.
Conclusion
This story has painted a picture of a community of weavers in a small Tamil Nadu village from the lens of social network analysis (SNA) and has identified subgroups and influential actors in the community. Several interesting questions arise from this study, for instance: which type of social structure might tend to lead to higher living standards for the community? Do linkages tend to differ significantly in crisis and normal times? Both these questions give rise to interesting and challenging statistical problems.
Other interesting follow-up work could model reciprocity in terms of household characteristics, identifying determinants of whether a household partakes in bilateral (or unilateral) ties or not. Following the lead from the gravity model of trade in macroeconomics, one could contemplate potential predictors such as the distance between the households and their relative economic status.
Finally it would be interesting to investigate the existence of any potential “out-of-village” nodes. Isolate households in the village could conceivably have stronger ties outside the village.
Acknowledgement
The authors wish to convey a great many thanks to Daval Dhave for very useful comments, which were incorporated in the revision of this paper, and to the Valente Center at Bentley University for support. The first author is thankful to the Department of Science and Technology, New Delhi, for its support through n-CARDMATH Project SR/S4/MS:427/07.
- 131 -
Reciprocity in social networks - A case study In Tamil Nadu, India / Arumugam et al.References
Dekker, P. and Eric M.U. 2001. Introduction. Pp. 1 - 8 in Social Capital and Participation in Everyday Life, edited by Eric M. Uslaner. London: Routledge.
Fehr, E. and Simon G. 2000. Fairness and Relation; The Economics of Reciprocity, Journal of Economic
Perspectives, 14(3), 159-181.
Uslaner, E.M. 2001. Volunteering and social capital: how trust and religion shape civic participation in the United States. Pp. 104 - 117 in Social Capital and Participation in Everyday Life, edited by Eric M. Uslaner. London: Routledge.