HAL Id: hal-01393323
https://hal.inria.fr/hal-01393323
Submitted on 7 Nov 2016
HAL is a multi-disciplinary open access
archive for the deposit and dissemination of
sci-entific research documents, whether they are
pub-lished or not. The documents may come from
teaching and research institutions in France or
abroad, or from public or private research centers.
L’archive ouverte pluridisciplinaire HAL, est
destinée au dépôt et à la diffusion de documents
scientifiques de niveau recherche, publiés ou non,
émanant des établissements d’enseignement et de
recherche français ou étrangers, des laboratoires
publics ou privés.
Uncertainty Quantification of Cochlear Implant
Insertion from CT Images
Thomas Demarcy, Clair Vandersteen, Charles Raffaelli, Dan Gnansia, Nicolas
Guevara, Nicholas Ayache, Hervé Delingette
To cite this version:
Thomas Demarcy, Clair Vandersteen, Charles Raffaelli, Dan Gnansia, Nicolas Guevara, et al..
Un-certainty Quantification of Cochlear Implant Insertion from CT Images. 5th International Workshop
on Clinical Image-Based Procedures - CLIP 2016, Held in Conjunction with MICCAI 2016, Oct 2016,
Athens, Greece. pp.27-35, �10.1007/978-3-319-46472-5_4�. �hal-01393323�
Uncertainty Quantification of Cochlear Implant
Insertion from CT images
Thomas Demarcy1,2, Clair Vandersteen1,3, Charles Raffaelli4, Dan Gnansia2,
Nicolas Guevara3, Nicholas Ayache1, and Herv´e Delingette1
1 Asclepios Research Team, Inria Sophia Antipolis-Mediterran´ee, France 2
Department of Cochlear Implant Scientific Research, Oticon Medical, France
3 Head and Neck University Institute (IUFC), Nice, France 4
ENT Imaging Department, Nice University Hospital (CHU), France
Abstract. Cochlear implants (CI) are used to treat severe hearing loss by surgically inserting an electrode array into the cochlea. Since cur-rent electrodes are designed with various insertion depth, ENT surgeons must choose the implant that will maximise the insertion depth without causing any trauma based on preoperative CT images. In this paper, we propose a novel framework for estimating the insertion depth and its un-certainty from segmented CT images based on a new parametric shape model. Our method relies on the posterior probability estimation of the model parameters using stochastic sampling and a careful evaluation of the model complexity compared to CT and µCT images. The results indicate that preoperative CT images can be used by ENT surgeons to safely select patient-specific cochlear implants.
Keywords: cochlear implant, uncertainty quantification, shape modeling
1
Introduction
A cochlear implant (CI) is a surgically implanted device used to treat severe to profound sensorineural hearing loss. The implantation procedure involves drilling through the mastoid to open one of the three cochlear ducts, the scala tympani (ST), and insert an electrode array to directly stimulate the auditory nerve, which induces the sensation of hearing. The post-operative hearing restoration is correlated with the preservation of innervated cochlear structure, such as the modiolus and the osseous spiral lamina, and the viability of hair cells [4].
Therefore for a successful CI insertion, it is crucial that the CI is fully in-serted in the ST without traumatizing the neighboring structures. This is a difficult task as deeply inserted electrodes are more likely to stimulate wide cochlear regions but also to damage sensitive internal structures. Current elec-trode designs include arrays with different lengths, diameters, flexibilities and shapes (straight and preformed). Based on the cochlear morphology selecting the patient-appropriate electrode is a difficult decision for the surgeon [3].
For routine CI surgery, a conventional CT is usually acquired for insertion planning and abnormality diagnosis. However, the anatomical information that
can be extracted is limited. Thus, important structures, such as the basilar mem-brane that separates the ST from other intracochlear cavities, are not visible. On the other hand, high resolution µCT images leads to high quality observation of the cochlear cavities but can only be acquired on cadaveric temporal bones.
Several authors have devised reconstruction methods of the cochlea from CT images by incorporating shape information extracted from µCT images. In par-ticular, Noble et al. [5] and Kjer et al. [2] created statistical shape models of the cochlea based on high-resolution segmented µCT images. Those shape models are created from a small number of µCT images (typically 10) and therefore may not represent well the generality of cochlear shapes that can bias the CT anatomical reconstruction. Baker et al. [1] used a parametric model based on 9 parameters to describe the cochlear as a spiral shell surface. This model was fit to CT images by assuming that the surface model matches high gradient voxels. In this paper, we aim at estimating to which extent a surgeon can choose a proper CI design for a specific patient based on CT imaging. More specifically, we consider 3 types of implant designs based on their positioning behavior (see Fig. 1f) and evaluate for each design the uncertainty in their maximal insertion depth. If this uncertainty is too large then there is a risk of damaging the ST during the insertion by making a wrong choice. For this uncertainty quantifica-tion, we take specific care of the bias-variance tradeoff induced by the choice of the geometric model. Indeed, considering an oversimplified model of the cochlea will typically lead to an underestimation of the uncertainty whereas an overpa-rameterized model would conversely lead to an overestimation of uncertainty.
Therefore, we introduce in this paper a new parametric model of the cochlea and estimate the posterior distribution of its parameters using Markov Chain Monte Carlo (MCMC) method with non informative priors. We devised likeli-hood functions that relate this parametric shape with the segmentation of 9 pairs of CT and µCT images. The risk of overparameterization is evaluated by mea-suring the entropy of those posterior probabilities leading to possible correlation between parameters. This generic approach leads to a principled estimation of the probability of CI insertion depths for each of the 9 CT and µCT cases.
2
Methods
2.1 Data
Healthy temporal bones from 9 different cadavers were scanned using CT and µCT scanners. Unlike CT images, which have a voxel size of 0.1875x0.1875 x0.25 mm3 (here resampled to 0.2x0.2x0.2 mm3) the resolution of µCT
im-ages (0.025 mm per voxel) is high enough to identify the basilar membrane that separates the ST from the scala vestibuli (SV) and the scala media. The scala media represents a negligible part of the cochlear anatomy, for simplicity pur-poses, both SV and scala media will be referred as the SV. Since intracochlear anatomy are not visible in CT images, only the cochlea was manually segmented by an head and neck imaging expert, while the ST and the SV were segmented
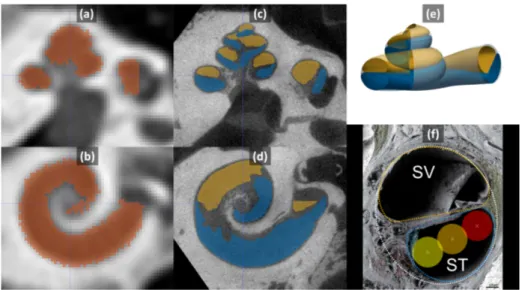
Fig. 1: Slices of CT (a,b) and µCT (c,d) with segmented cochlea (red), ST (blue) and SV (yellow). (e) Parametric model with the ST (blue), the SV (yellow) and the whole cochlea (translucent white). (f) Parametric cross-sections fitted to a microscopic images from [6]. The lateral wall (red), mid-scala (orange) and perimodiolar (yellow) positions of a 0.5 mm diameter electrode are represented.
in µCT images (see Fig. 1). All images were rigidly registered using a pyramidal block-matching algorithm and aligned in a cochlear coordinate system [7]. 2.2 Parametric Cochlear Shape Model
Since we have a very limited number of high resolution images of the cochlea, we cannot use statistical shape models to represent the generality of those shapes. Instead, we propose a novel parametric model M of the 3 spiraling surfaces: the whole cochlea, the scala tympani and scala vestibuli (see Fig. 1e). The cochlea corresponds to the surface enclosing the 2 scalae and we introduce a compact parameterization T = {τi} based on 22 parameters for describing the 3
sur-faces. This model extends in several ways the ones previously proposed in the literature [1] as to properly capture the complex longitudinal profile of the cen-terline and the specific shapes of the cross-sections detailed in clinical studies [8]. More precisely, in this novel model, the cochlea and two scalae can be seen as generalized cylinders, i.e cross-sections swept along a spiral curve. This center-line is parametrized in a cylindrical coordinate system by its radial r(θ) and longitudinal z(θ) functions of the angular coordinate θ within a given interval [0, θf]. The cross-sections of the ST and SV are modeled by a closed planar
curve on which a varying affinity transformation is applied along the centerline, parametrized by an angle of rotation α(θ) and two scaling parameters w(θ) and h(θ). In particular, the three modeled anatomical structures shared the same centerline, the tympanic and vestibular cross-sections are modeled with two half pseudo-cardioids within the same oriented plane while the cochlear cross-section
corresponds the minimal circumscribed ellipse of the union of the tympanic and vestibular cross-sections (see Fig. 1f). The center of the ellipse is on the center-line. Eventually the shapes are fully described by 7 one-dimensional functions of θ: r(θ), z(θ), α(θ), wST(θ), wSV(θ), hST(θ), hSV(θ), combinations of simple
functions (i.e polynomial, logarithmic, . . .) of θ. The cochlear parametric shape model is detailed in an electronic appendix associated with this paper.
2.3 Parameters Posterior Probability
Given a binary manual segmentation S of the cochlea from CT imaging, we want to estimate the posterior probability p(T |S) ∝ p(S|T ) p(T ) proportional to the product of the likelihood p(S|T ) and the prior p(T ).
Likelihood measures the discrepancy between the known segmentation S and the parametric model M(T ). The shape model can be rasterized, we obtain a binary filled image R(T ) which can be compared to the manual segmentation. Note that the rigid transformation is known after the alignment in cochlear coordinate system [7]. The log-likelihood was chosen to be proportional to the negative square Dice index s2(R(T ), S) between the rasterized parametric model and the
manually segmented cochlea, p(S|T ) ∝ exp(−s2
2(R(T ), S)/σ2). The square Dice
allows to further penalize the shape with low Dice index (e.g. less than 0.7) and σ was set to 0.1 after multiple tests as to provide sufficiently spread posterior distribution.
Prior is chosen to be as uninformative as possible while authorizing an efficient stochastic sampling. We chose an uniform prior for all 22 parameters within a carefully chosen range of values. From 5 manually segmented cochlear shapes from 5 µCT images (different from the 9 considered in this paper), we have extracted the 7 one-dimensional functions of θ modeling the centerline and the cross-sections using a Dijkstra algorithm combined with an active contour es-timation. θ was discretized and subsampled 1000 times. The 22 parameters were least-square fit on the subsampled centerline and cochlear points. This has provided us with an histogram of each parameter value from the 5 combined datasets, and eventually the parameter range for the prior was set to the average value plus or minus 3 standard deviations.
Posterior estimation. We use the Metropolis-Hastings Markov Chain Monte-Carlo method for estimating the posterior distribution of the 22 parameters. We choose Gaussian proposal distributions with standard deviations equal to 0.3% of the whole parameter range used in the prior distribution. Since the parameter range is finite, we use a bounce-back projection whenever the random walk leads a parameter to leave this range.
Posterior from µCT images. In µCT images, the scala tympani and vestibuli can be segmented separately as SST and SSV thus requiring a different likelihood
function. The 2 scalae generated by the model M(T ) are separately rasterized as RST(T ) and RSV(T ) and compared to the 2 manual segmentations using a
single multi-structure Dice index s3(RST(T ), RSV(T ), SST, SSV). This index is
computed as the weighted average of the 2 Dice indices associated with the 2 scalae. The likelihood function is then p(SST, SSV|T ) ∝ exp(−s23/σ2)
2.4 Controlling Model Complexity
We want to limit the extent of overestimation of uncertainty induced by our rich parametric model. Therefore, we look at the observability of each parameter through its marginalized posterior distribution p(τi|S) =
R R
τj6=τip(T |S) dτj.
In an ideal scenario, all model parameters should be observable thus indicating that we have not overparameterized the cochlear shape. Therefore we consider the information gain IG(τi) = −
R
τip(τi) log p(τi) dτi+
R
τip(τi|S) log p(τi|S) dτi
computed as difference of entropy between the prior (uniform) distribution and the marginal posterior distribution. The entropy is estimated by binning the distributions using 256 bins covering the range defined by the uniform prior. A low information gain indicates either that the parameter has no observed influence on the shape or that it is correlated with another set of parameters such that many combinations of them lead to the same shape. To test if we are in the former situation, we simply check if the parameter i decreases significantly the likelihood around the maximum a posteriori (MAP) by plotting the probability p(τi|S, T−iMAP).
2.5 Clinical Metrics
We consider three types of electrodes having the same constant diameter of 0.5 mm. Straight electrodes follow the lateral (outer) wall of the ST, whereas perimodiolar ones follow the modiolar (inner) wall of the ST and mid-scala electrodes are located in the geometric center of the cross-section (see Fig. 1f).
For a given parameter T and a certain type of electrode, it is relatively simple to compute its trajectory in the ST, by considering each cross-section of the parametric shape model and positioning the center of the CI relative to the inner and outer wall. Furthermore, the maximum insertion depth of a CI lMax(T ) can be computed by the arc length of the curve defined by the
locus of the electrode positions and by testing if the inscribed circle of the ST boundaries is larger than the electrode. We propose to estimate the posterior probability p(lMax|S) for each CI type by marginalizing over the set of cochlea
parameters : p(lMax|S) =R
T p(T |S) l
Max(T ) dT . Similarly, we can compute the
prior probability of insertion depth which is governed by the prior of the set of parameters : p(lMax(T )) =R
τip(T )l
Max(T ) dτ i.
3
Results
3.1 Model Complexity Evaluation
For each image, 20,000 iterations of the MCMC estimation were performed using a 3.6 GHz Intel Xeon processor machine. The computational time per iteration is less than 4 s for the CT images and less than 20 s for the µCT images. The MCMC mean acceptance rate is 0.38.
The Dice index between the samples corresponding to the maximum a pos-teriori probability (MAP) and the manual segmentations are summarized in
µCT & s3 CT & s2 mean 0.77 0.80 min 0.75 0.75 max 0.79 0.86 patient 1 0.78 0.82 (b) (a) (c)
Fig. 2: (a) Dice indices between the MAP and manual segmentation. (b) and (c) Shape models of the cochlea (light line) of the MAP of patient 1 with the segmented ST (blue) and SV (orange) on µCT images.
Fig. 2(a). Note that s3 indices are lower on µCT because it considers more
substructures (ST and SV) than s2 indices on CT (cochlea only). A careful
in-spection of the two structures in Fig 2b,c suggests that our parametric model has enough degree of freedom to account the complexity of the cochlear shape. The model even appears to regularize the incomplete manual segmentation without overfitting the noise. The mean surface error between the segmented µCT images and the maximum a posteriori models estimated from segmented CT images is less than 0.3 mm. This error depends on the complexity of the model, the rigid registration and the segmentations (independently performed for each modality) but still comparable with the score of 0.2 mm obtained with statistical shape models for cochlear substructures segmentations in CT [5].
On µCT scans, 78% of the cross-sections parameters have an information gain greater than 0.1, while the mean information gain over the 22 parameters is IG = 0.41. Furthermore, we checked that on µCT scans, for all parameters, any local variation leads to a significant decrease of likelihood p(τi|S, T−iMAP)
and thus showing an influence on the observed shape. This implies that some parameters might be correlated and that shapes may be described by different parameters combinations. Thus we may slightly overestimate the uncertainty (and minimize bias) which is preferable than underestimating it through an oversimplified model. Setting some of those parameters to a constant may be a too strong assumption given that only 9 patient data are considered and therefore we decided to keep the current set of 22 parameters.
On CT scans, 28% of the cross-sections parameters have an information gain greater than 0.1 and IG = 0.23. The information gain is smaller for CT images than µCT images, which is expected as far less details are visible. In particular, the two scalae are not distinguishable making their model parameters unidentifiable.
3.2 CT Uncertainty Evaluation
We evaluate the posterior probability of the maximal insertion depth p(lMax|S)
for each patient, modality and electrode design. Their cumulative distribution function (CDF) can be clinically interpreted, as it expresses the probability that the maximal insertion depth of a cochlea is less or equal than a given value.
5 10 15 20 25 30 35 40 45 50 0 0.1 0.2 0.3 0.4 0.5 0.6 0.7 0.8 0.9 1 lateral mid-scala perimodiolar µCT posterior CT posterior prior
maximal insertion depth (mm)
CDF 18 20 22 24 26 28 30 18 20 22 24 26 28 30 5% 10% 25%
µCT lateral insertion depth (mm)
CT l ateral ins ertion depth (mm) (b) (a)
Fig. 3: (a) CDF of the maximal insertion depth estimation for Patient 1. (b) Maximal insertion depth estimation discrepancy between CT and µCT for electrodes following lateral wall at different quantiles (5%, 10% and 25%). Note that the lateral position is the least favorable result in terms of discrepancy between modalities (see Table 1). Table 1: Statistics summaries of CDF of the maximum insertion depth for all patients and electrode designs (including standard deviation and average discrepancy).
standard deviation (mm) discrepancy between CT and µCT (mm) µCT posterior CT posterior prior lateral mid-scala perimodiolar
3.42 4.14 5.54 2.34 1.32 0.92
Therefore if an electrode has a length l, it also indicates the probability to traumatize the cochlea (if fully inserted). Hence maximal insertion depth corre-sponding to a CDF of 5%, can be understood as a 95% chance that the electrode actually fits in the ST. The CDF accounts for the uncertainty in the whole shape, including cochlear length or diameter. A cochlea with a longer or larger ST would naturally result in a CDF shifted to the right.
The mean standard deviation of the distributions across the patients and electrode designs (see Table 1) shows that uncertainty with CT images is greater than µCT images but still more informative than the prior. To evaluate the bias of maximal insertion depth estimated from CT images we measure the mean discrepancy between the estimation from µCT and CT images. Fig. 3b shows the estimation differences between modalities for the worse case, namely straight electrodes. We must stress that all maximal insertion depths are underestimated with CT images. The ST is usually larger than the SV at the first basal turn [8] and this information is not explicitly embedded in the prior. Since only little cross-section information can be inferred from CT images, we could hypothesize that the diameters of the ST are more likely to be underestimated with CT images, leading to underestimate insertion depth.
4
Conclusion
In this study, we have proposed a novel parametric model for detailed cochlea shape reconstruction. We evaluated its complexity in order to optimize the uncer-tainty quantification of intracochlear shapes from CT images. Based on anatom-ical considerations, our results introduce a measurements of the risk of trauma given a cochlear design and an insertion depth. Most of the CI have a linear elec-trode depth between 10 and 30 mm, corresponding to the range within which our results are the most revealing. For this data set, the maximal insertion depth spans a 4 mm range. One cochlea (Patient 4) presents a deeper maximal inser-tion depth than others, we observed that it had a high number of cochlear turns (3.08 compared to an average of 2.6) which was confirmed by a radiologist on µCT. This exemplifies the importance of providing a patient-specific estimation of the maximal insertion depth.
Our experiments show that under the best possible conditions (careful image segmentation, stochastic sampling of a detailed cochlear model), classical pre-operative CT images could be used by ENT surgeons to safely select a patient-specific CI. Indeed, the discrepancy is limited (maximum of 2.34 mm for the lateral position) and always lead to an underestimation of the maximal inser-tion depth from CT images which is more safe for the patient. In future work, more data will be considered to improve the correlation between CT and µCT predictions and to estimate more thoroughly the bias between both modalities in order to apply a correction.
References
1. Baker, G., Barnes, N.: Model-image registration of parametric shape models: fitting a shell to the cochlea. Insight J. (2005)
2. Kjer, H.M.: Modelling of the Human Inner Ear Anatomy and Variability for Cochlear Implant Applications. Ph.D. thesis (2015)
3. van der Marel, K.S., et al.: Diversity in cochlear morphology and its influence on cochlear implant electrode position. Ear Hear. 35(1), e9–20 (2014)
4. Nadol, J.B.: Patterns of neural degeneration in the human cochlea and auditory nerve: Implications for cochlear implantation. Otolaryngol. Head Neck Surg. 117(3), 220–228 (1997)
5. Noble, J.H., et al.: Automatic segmentation of intracochlear anatomy in conventional CT. IEEE Trans. Biomed. Eng. 58(9), 2625–32 (2011)
6. Rask-Andersen, H., et al.: Human cochlea: anatomical characteristics and their rel-evance for cochlear implantation. Anat. Rec. 295(11), 1791–811 (2012)
7. Verbist, BM et al.: Consensus panel on a cochlear coordinate system applicable in histologic, physiologic, and radiologic studies of the human cochlea. Otol. Neurotol. 31(5), 722–30 (2010)
8. Wysocki, J.: Dimensions of the human vestibular and tympanic scalae. Hear. Res. 135(1-2), 39–46 (1999)