TRENDS
Transcriptomics in ecotoxicology
Kristin Schirmer&Beat B. Fischer&Danielle J. Madureira&Smitha Pillai
Received: 8 February 2010 / Revised: 15 March 2010 / Accepted: 16 March 2010 / Published online: 6 April 2010 # The Author(s) 2010. This article is published with open access at Springerlink.com
Abstract The emergence of analytical tools for high-throughput screening of biomolecules has revolutionized the way in which toxicologists explore the impact of chemicals or other stressors on organisms. One of the most developed and routinely applied high-throughput analysis approaches is transcriptomics, also often referred to as gene expression profiling. The transcriptome represents all RNA molecules, including the messenger RNA (mRNA), which constitutes the building blocks for translating DNA into amino acids to form proteins. The entirety of mRNA is a mirror of the genes that are actively expressed in a cell or an organism at a given time. This in turn allows one to deduce how organisms respond to changes in the external environment. In this article we explore how transcriptomics is currently applied in ecotoxicology and highlight challenges and trends.
Keywords DNA microarrays . Sequencing .
Ecotoxicology . Mode of action . Phenotype anchoring . Risk assessment
Introduction
Ecotoxicology aims to identify effects that chemical pollutants, alone or in combination with other stressors,
elicit upon the environment. Integration across various levels of biological organization is required to achieve this aim. These levels comprise the molecular, cellular and organism levels to draw conclusions on impacts in populations, and additionally the consideration of species interactions for effects on communities and ecosystems (Fig. 1). On the basis of such fundamental knowledge, the overarching goal in ecotoxicology is to be able to predict, and thus diminish or prevent, detrimental effects on the environment.
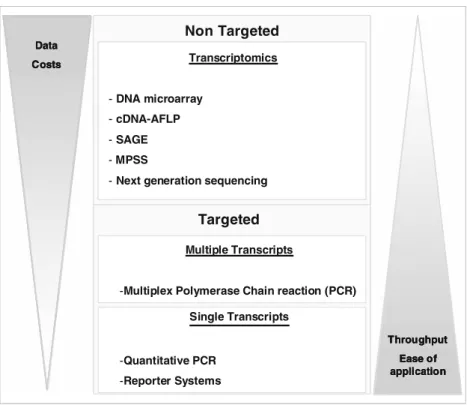
Because all primary interactions of chemicals with organisms take place at the level of the biomolecules of which the cells are comprised, it has been reasoned that understanding ecotoxicology on a molecular level is key to gaining the mechanistic knowledge and predictive power needed to face contemporary challenges [1]. Yet, under-standing causal links between the molecular and the ecosystem level is difficult, not only because it requires bridging of different scales in time and space (Fig. 1). It also depends on the availability of analytical tools that allow the concerted action of biomolecules in response to chemical stress to be studied in their complexity. To this end, technologies have been established in recent years that allow all DNA (i.e. the genome), RNA (i.e. the transcriptome), proteins (the proteome) and small molecule metabolites (the metabolome) of a cell or organism to be explored simultaneously. Thus, traditional targeted analysis of single biomolecules can now be replaced, supplemented or guided by non-targeted technologies that cover biomo-lecules in their entirety. In this article we focus on technologies that allow investigation of changes in the transcriptome, i.e. transcriptomic technologies, in ecotox-icology (Fig.2).
Transcriptomics builds on the knowledge of genomes. Although the genome is basically the same in every cell of K. Schirmer (*)
:
B. B. Fischer:
D. J. Madureira:
S. PillaiDepartment of Environmental Toxicology, Eawag, Swiss Federal Institute of Aquatic Science and Technology,
Überlandstrasse 133, 8600 Dübendorf, Switzerland e-mail: [email protected] K. Schirmer
:
D. J. MadureiraInstitute of Biogeochemistry and Pollutant Dynamics, ETH Zürich,
8092 Zurich, Switzerland DOI 10.1007/s00216-010-3662-3
an organism, different cells show different patterns of gene expression to serve various physiological functions but also to respond to external stimuli, such as chemical stressors. The term ‘gene expression’ refers to the synthesis, or transcription, of RNA from a gene; thus, the transcriptome constitutes a snapshot of all actively expressed genes at any given time. A major type of RNA is messenger RNA (mRNA), which includes the protein-coding part of the genome and is translated into proteins that fulfil specific biological functions.
Considering the different methods at hand to exploit the transcriptome (Fig. 2), Nuwaysir et al. [2] stated in 1999 that microarray technology is of unprecedented power in toxicological research. Indeed, it evolved as the currently most widely applied transcriptome analysis tool in human toxicology as well as ecotoxicology. Nevertheless, we argue that microarray analysis in ecotoxicology is not yet used to its full capabilities. First, its full power can only be realized if patterns of gene expression are linked to effects at higher levels of biological organization. Second, genome informa-tion so far remains limited mostly to commonly applied model organisms, including Danio rerio (zebrafish), Caenorhabditis elegans (nematode), Daphnia pulex (water flea) and Chlamydomonas reinhardtii (green alga). For this reason, alternatives to microarray analysis are occasionally applied in ecotoxicology (Fig.2). In the near future, a new generation of sequencing techniques will help overcome limited genome sequence availability; they will also greatly
supplement, and potentially even replace, microarray technology in the coming years.
With this background, we aim to provide an overview of current and emerging methods for transcriptome analysis in ecotoxicology and, predominantly on the basis of studies with DNA microarrays, explore how transcriptomics should be more fully exploited to advance mechanistic and predictive ecotoxicology.
Methods to analyse the transcriptome
DNA microarray technology has evolved from Southern blotting [3] and several excellent reviews are available that describe the principles and applications of DNA micro-arrays in (eco)toxicology [2, 4]. The first high-density microarrays were made by spotting large numbers of individual complementary DNA (cDNA) molecules, cDNA reverse transcribed from mRNA, as probes onto polylysi-nated glass slides in an arrayed pattern where the hybridized targets could be identified by the position of the probe [5]. Today, on-slide chemical synthesis of short nucleic acid (oligonucleotide) probes provides high flexi-bility for selection and stringent quality control. For this reason most microarray applications are now based on commercial platforms, which offer whole genome or specific subset (customized) arrays together with reagents and protocols for standardized use. The most common commercial platforms currently applied in ecotoxicology are listed in Table1.
The continuous technological improvements of DNA microarrays and the commercially available platforms provide the basis for wide application of the technology. Nevertheless, use of DNA microarrays in ecotoxicology is often still limited to comparatively few model organisms because of a lack of available sequence data for the many non-model organisms important for risk assessment. Cross-species hybridization with microarrays of homologous species has been performed for several organisms [6], but these experiments with heterologous microarrays have their limitations. On the other hand, several other high-throughput gene expression analysis techniques which are not dependent on previous genomic sequence information are available. They are based on cDNA fragment analysis either by separation with gel electrophoreses or by sequencing.
Expressed sequence tag (EST) sequencing is a frequently used approach to analyse the total transcript of an organism. Even though it is not suitable for routine analysis of multiple samples, it often serves as the basis for oligonu-cleotide design to build custom-made DNA microarrays.
cDNA–amplified fragment length polymorphism (cDNA-AFLP) involves fragmentation of double-stranded Biomolecule Cell Organism Community Space Ti m e Population Ecosystem Biomolecule Cell Organism Community Space Ti m e Population Ecosystem Chemical
Fig. 1 Ecotoxicology relies upon the integration of knowledge across different levels of biological organization. Any impact of a chemical on an organism is initiated at the level of the cell, where a chemical elicits a small-scale biomolecular response within a short period of time. Thousands of molecules (e.g. genes, proteins) may be involved in such a response, calling for integrative technologies that allow one to measure the biomolecular response in its entirety. The responses on the cellular level will translate to higher-effect levels on a larger time and spatial scale if they are not compensated by cellular protective mechanisms
cDNA with two restriction enzymes, polymerase chain reaction amplification of the fragments and separation on a polyacrylamide gel [7]. The method is highly sensitive, allowing the detection of low-abundance mRNAs, and direct comparison of band intensities between samples enables differently expressed genes to be identified [8]. Thus, cDNA-AFLP has been used to investigate the genetic response of various organisms to toxic chemicals, such as in the mushroom Suillus luteus treated with high zinc concentrations [9] or the mustard plant Brassica juncea
exposed to cadmium stress [10]. Still, the requirement for isolating, cloning and sequencing bands to identify indi-vidual transcripts is the major limitation of this method.
Serial analysis of gene expression avoids band isolation to identify mRNAs by linking small sequence tags (10–14 bp) from a unique position of each cDNA together, clone them and analyse them by sequencing [11]. Specific sequence tags for individual transcripts can then be identified and quanti-fied. With this technique 37,152 tags were sequenced from four libraries of the grass shrimp Palaemonetes pugio Non Targeted Targeted Data Costs Throughput Ease of application Transcriptomics -DNA microarray -cDNA-AFLP -SAGE -MPSS
-Next generation sequencing
Multiple Transcripts
-Multiplex Polymerase Chain reaction (PCR) Single Transcripts -Quantitative PCR -Reporter Systems Non Targeted Non Targeted Targeted Targeted Data Costs Throughput Ease of application Data Costs Throughput Ease of application Transcriptomics -DNA microarray -cDNA-AFLP -SAGE -MPSS
-Next generation sequencing Transcriptomics
-DNA microarray -cDNA-AFLP -SAGE -MPSS
-Next generation sequencing
Multiple Transcripts
-Multiplex Polymerase Chain reaction (PCR) Single Transcripts
-Quantitative PCR -Reporter Systems
Fig. 2 Transcript or gene expression (messenger RNA) analysis can be done in two distinct ways. In the targeted approaches, transcripts are quantified on the basis of prior knowledge of relevant gene sequences by polymerase chain reaction (PCR)-based methods or with reporter systems. These techniques are easy to apply and can be run on many samples (high sample throughput), yet yield information on only a few genes. In contrast, non-targeted approaches do not require a prior selection of genes and provide information for a large or the entire set of transcripts in each sample. The amount of data obtained
and the costs involved are a bottleneck to applying transcriptomics for high sample throughput. Transcriptomics can guide the selection of targets and the targeted approaches support the verification of transcriptome data, in particular with regard to transcript regulation in response to chemical concentration and time where many samples are required to achieve the necessary resolution. Abbreviations: cDNA-AFLP complementary DNA–amplified fragment length poly-morphism, SAGE serial analysis of gene expression, MPSS massive parallel signature sequencing
Affymetrix Whole genome; standard and customized; 25-mer probes; probe redundancy (20 probes to each gene); mismatch control probes; 5 µg total RNA; one single sample per chip; commercially available since 1994
Agilent Whole genome; standard and customized; 60-mer probes; in situ synthesis; 5 µg total RNA; different array formats (244,000, 2×105,000, 4×44,000, 4×180,000, 8×15,000); commercially available since 1997
NimbleGen (Roche) Whole genome; standard and customized; 60-mer probes; digital microarray manufacturing– less expensive; 15 µg total RNA; different array formats (385,000, 4×72,000, 12×135,000); commercially available since 2002 Table 1 Most commonly used
exposed to three chemical stressors, resulting in 13,754 unique and 117 differentially expressed tags [12].
Massive parallel signature sequencing is another tag-based method. Transcripts are analysed by attaching individual cDNA molecules on a microbead, amplification and identification by a series of restriction digests and ligations of specific encoded adaptors to get a signature sequence of 16–20 bases [13]. Since, during sequencing, microbeads are immobilized in a flow cell mounted on a confocal fluorescence microscope, individual transcripts can be quantified by simply counting the microbeads with identical signature sequence. However, massive parallel signature sequencing as well as serial analysis of gene expression require a relatively cumbersome set-up and additional sequence information is required to identify the corresponding transcript.
Next-generation sequencing refers to new sequencing techniques which overcome most of the limitations of the methods described above. Whole transcriptome shotgun sequencing by next-generation sequencing, designated as RNA-Seq, provides millions of sequence reads from complex mixtures of cDNAs, enabling the assembly of full transcripts. The digital nature of the countable reads makes it highly quantitative over a wide range of expression levels with detection limits down to few transcripts per cell [14]. Furthermore, sequencing eliminates the requirement for any previous knowledge about transcripts, including length, sequence or splicing sites, and no cloning of cDNAs is required.
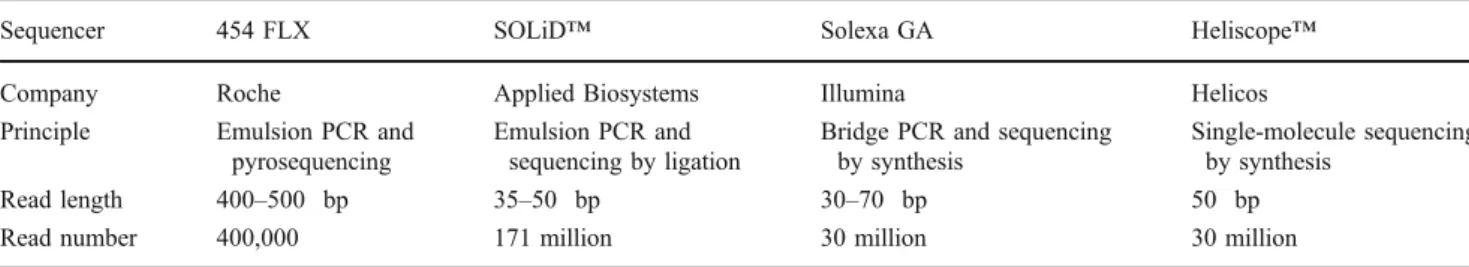
Several high-throughput DNA sequencing techniques are commercially available which are based on different technologies (Table 2) (for details, see recent reviews, including [15]). Even though all next-generation sequencing methods enable one to directly sequence complex mixtures of DNA samples and result in gigabases of sequence information, they differ in read numbers, length and sequence accuracy. The Roche 454 FLX pyrosequencer was the first commercially available and is still the most frequently used system. It has the advantage of providing the longest reads, simplifying the assembly of whole transcripts without a reference genome, even though new algorithms improved the assembly of shorter sequences as produced by
other methods (Table 2). Thus, pyrosequencing is a very powerful method to create new EST libraries from non-model organisms, which can then be further used for de novo DNA microarray design [16]. To do so, new bioinformatic tools to design microarrays from unannotated EST sequences, either produced by deep sequencing or available from public databases, have been established [17]. The combination of massive parallel sequencing and DNA microarray technology could be very powerful in ecotox-icology to analyse the genetic response of locally relevant organisms exposed to specific pollutants. For example, with a normalized cDNA library of the largemouth bass Micropterus salmoides gained by 454 sequencing, Garcia-Reyero et al. [18] created cDNA microarrays with 16,350 annotated transcripts which were used to analyse the response in livers and gonads of male fishes exposed to 17β-oestradiol.
With its quantitative nature, RNA-Seq can also be directly applied for gene expression analysis. Especially the Solexa, SOLiD and Heliscope techniques with their high read numbers allow a high coverage analysis of the transcriptome. However, the short read lengths usually require a reference genome for identification of differently expressed transcripts, restricting this method to previously sequenced model organisms [19]. Still, RNA-Seq is a highly accurate and reproducible method for analysing gene expression and technical developments might soon make RNA-Seq a standard method to analyse gene expression even in non-model organisms frequently applied in ecotoxicology.
Transcriptome analysis in the context of ecotoxicology
Transcriptome analyses can generate an immense amount of data that needs to be analysed accurately and interpreted in a meaningful way. The first step is a statistical analysis which helps to identify the significantly regulated genes. The second step is to put the differentially expressed genes into a biological context. To aid this step, different bioinformatic tools were developed with the intention to simplify comparison of gene expression profiles between different experiments and to standardize the representation
Table 2 Comparison of currently available next-generation sequencing techniques
Sequencer 454 FLX SOLiD™ Solexa GA Heliscope™
Company Roche Applied Biosystems Illumina Helicos
Principle Emulsion PCR and pyrosequencing
Emulsion PCR and sequencing by ligation
Bridge PCR and sequencing by synthesis
Single-molecule sequencing by synthesis
Read length 400–500 bp 35–50 bp 30–70 bp 50 bp
Read number 400,000 171 million 30 million 30 million
of genes and gene products across species and databases. One major challenge now is to translate molecular changes caused by chemical pollutants in the cell to the organism and up to the ecosystem level (Fig. 1). Some of the ways forward to more fully exploit transcriptome information are discussed in more detail below.
Expression signatures may be derived from gene expression patterns specifically elicited by chemicals or groups of chemicals. Yang et al. [20] established compound-specific gene expression signatures for 11 toxicants upon exposure to zebrafish embryos. They showed that the gene expression patterns were related but different enough to be classified as toxicant-specific profiles. Also, in a blind test they were able to predict most of the toxicants unequivocally by their gene expres-sion signatures. Expresexpres-sion signatures or fingerprintings provide information on the specific molecular responses. However, they still fall short of associating these responses with phenotypic changes which are deemed harmful for the organism. Moreover, for successful implementation of expression signatures into ecotoxicological risk assessment, the generation and maintenance of an easily accessible and standardized database are essential [21].
Another application of expression signatures is the monitoring of transcriptome changes in a community upon exposure to a toxicant [22]. This can be done by next-generation sequencing as was shown in studies where the transcriptomes of marine microbial communities were analysed [23, 24]. The authors determined the metatran-scriptome (tranmetatran-scriptome of the entire community) and observed highly expressed sequence clusters as well as changes in expression of transcripts between time points. This approach has immense potential in ecotoxicology to explore both the structure and the function of communities; however, it is still severely limited by a lack of annotated gene families and by cost.
Molecular modes of action (MOAs) of chemicals or other stressors can be derived if alterations in gene expression, which by themselves are often used as indicators of adverse effects, are combined with analyses such as Gene Ontology, a major bioinformatic initiative (http://www.geneontology.org/). Gene Ontology provides tools to process the transcriptome data into structured ontologies that describe the gene products in terms of their associated biological processes, cellular components and molecular functions. Most environmental pollutants have MOAs that affect several molecular networks and it is necessary to distinguish between the specific and general transcriptomic responses to the toxicant.
Voelker et al. [25] determined the differentially expressed genes in zebrafish embryos on exposure to 3,4-dichloroaniline and from this deduced the molecular MOA of the chemical. They showed that the gene response is
indicative of a regulatory network based on a nuclear receptor and/or activation of kinases. A similar transcrip-tomic approach allowed Poynton et al. [26] to identify distinct gene profiles for copper, cadmium and zinc at sublethal concentrations and to uncover their MOA in Daphnia magna. The authors determined that the metals exert their effects as follows: (1) copper decreases the expression of β-1,3-glucan binding proteins which are involved in the immune response, (2) cadmium induces an oxidative stress and (3) zinc acts by downregulating the expression of homologues of chitinase and cuticle proteins, which are required for moulting.
Although the MOA approach is dependent on a library of defined responses, knowledge of MOAs allows one to identify and to understand pathways that underlie physiological processes. In this way, the transcriptome data can be taken a step further towards linkage to higher-level phenotypes.
Phenotype anchoring is defined as the linking of the molecular responses, including those at the transcript, protein and metabolite levels, to changes of the phenotype observed at the organism and population levels. Transcriptome data aid in the prediction of perturbations of signalling pathways and cellular functions and these perturbations need in turn to be linked to more integrated processes, such as development and reproduction. Indeed, the studies described below were able to attribute changes in organisms and populations to functional pathways which were classified on the basis of transcriptional changes using Gene Ontology.
Connon et al. [27], in a study with D. magna exposed to cadmium, showed that measured gene responses can be linked to the impact of cadmium on somatic growth, development and population growth. The authors classified the responding genes into the major processes of metabo-lism, transcription/translation and other cellular processes and linked them to phenotypic changes such as in moulting, reproduction and growth. For instance, they demonstrated a link between the downregulation of chitin-binding proteins and metallopeptidases and the breakdown of the chitin exoskeleton, which in turn explained the size difference in control and exposed daphnids. A similar approach of classifying the molecular changes into functional groups was followed in a study by Heckmann et al. [28], where they established the MOA of ibuprofen in D. magna and linked the impact of the chemical on the organism’s health, both at the individual and at the population level. The responses could be classified into several processes, such as eicosanoid metabolism, peroxisome proliferator activated receptor signalling and oogenesis, which could then be integrated with other observed phenotypic changes, such as impaired reproduction.
Roh et al. [29], in their study on ecotoxicity of silver nanoparticles in C. elegans, integrated transcriptome analysis with end points at the organism and population levels. The
microarray profile of gene expression after exposure to silver nanoparticles provided an overview of the worms’ molecular responses, which were linked to ecotoxicological indicators such as survival, growth and reproduction of C. elegans (both wild type and mutant strains). One linkage that the authors suggested was that of superoxide dismutase (sod-3) expression and reproduction. An upregulation in sod-3 gene expression indicated an oxidative stress and increased production of reactive oxygen species which seemed to affect the reproduction of the organism.
Phenotype anchoring studies in ecotoxicology as of now have mostly built on the transcriptome to directly connect it to the organism or population phenotype. One has to take into consideration, however, that not all transcriptome changes necessarily lead to an effect, deleterious or beneficial, in the organism. Further analysis of the gene products, i.e. proteins and metabolites, which directly influence the phenotype, is a step closer to cement the link between the different levels. An example of such a linking approach is a study by Bundy et al. [30]. The authors analysed not just the transcriptome but also the metabolome of Lumbricus rubellus, a non-model organism, after exposure to sublethal levels of copper. Assimilation of the responses at different levels supports a holistic understanding of the action of a toxicant. Such an understanding can be further exploited to generate hypotheses and realize them in the ecological risk assessment framework.
Hypotheses for risk assessment can be derived from integrating the above-described approaches as illustrated by Villeneuve et al. [31]. These authors developed a graphical biological systems model on endocrine-disrupting chemicals in the small fish fathead minnow. The model was designed with the integration of information from numerous review articles and primary sources and it depicts important genes, proteins and known interactions associated with the repro-ductive functions under control of the teleost brain–pituitary– gonadal axis. The utility of the model was tested by determining the transcriptome of the fish upon the exposure to fadrozole, an aromatase inhibitor. The prediction of responses based on the MOA was consistent with the microarray results obtained. Though the approach has certain limitations, namely, that it cannot integrate secondary effects such as interactions between pathways, feedback mecha-nisms and structural changes in biomolecules, it is a feasible way forward for the use of transcriptomics for chemical risk assessment in ecotoxicology.
Conclusions
Technologies to analyse entire transcriptomes are now available and are improving quickly to address contemporary issues in ecotoxicology. They are about to revolutionize our
understanding of molecular interactions of chemicals or other stressors with biomolecules in cells, thus shedding light on the foundation of any short- or long-term toxicological or compensating effect. Together with the rapid evolution of sequence information, transcriptomics is becoming more widely accessible also to organisms of ecological relevance that have not (yet) reached the status of a model organism in ecotoxicology. Along these lines, the conservation of many important biological pathways across species should rigorously be exploited to advance more quickly the predic-tion of MOAs and higher-level phenotypes. Emphasis needs to be placed on identifying functions of sequenced, but not yet annotated genes. Functional genomic approaches, where selected genes can be purposely enhanced or knocked down in their expression, are particularly useful to identify gene functions pertaining to organism responses. Indeed, if we succeed in integrating the newly available mechanistic information with ecologically relevant phenotypes, we will be much better able to predict environmental risks.
Acknowledgement DJM is financially supported by the Alliance on Systems Biology by the German Helmholtz Association.
Open Access This article is distributed under the terms of the Crea-tive Commons Attribution Noncommercial License which permits any noncommercial use, distribution, and reproduction in any medium, provided the original author(s) and source are credited.
References
1. Eggen RIL, Behra R, Burkhardt-Holm P, Escher BI, Schweigert N (2004) Environ Sci Technol 38:58A–64A
2. Nuwaysir EF, Bittner M, Trent J, Barrett JC, Afshari CA (1999) Mol Carcinog 24:153–159
3. Southern EM (2000) Trends Biochem Sci 25:585–588 4. Lettieri T (2006) Environ Health Perspect 114:4–9
5. Schena M, Shalon D, Davis RW, Brown PO (1995) Science 270 (5235):467–470
6. Kassahn KS (2008) J Fish Biol 72:2407–2434
7. Vuylsteke M, Peleman JD, van Eijk MJ (2007) Natl Protoc 2:1399–1413
8. Breyne P, Dreesen R, Cannoot B, Rombaut D, Vandepoele K, Rombauts S, Vanderhaeghen R, Inze D, Zabeau M (2003) Mol Genet Genomics 269:173–179
9. Muller LA, Craciun AR, Ruytinx J, Lambaerts M, Verbruggen N, Vangronsveld J, Colpaert JV (2007) Mycorrhiza 17:571–580 10. Fusco N, Micheletto L, Dal Corso G, Borgato L, Furini A (2005) J
Exp Bot 56:3017–3027
11. Velculescu VE, Zhang L, Vogelstein B, Kinzler KW (1995) Science 270(5235):484–487
12. Griffitt RJ, Greig TW, Chandler GT, Quattro JM (2007) Environ Toxicol Chem 26:2413–2419
13. Brenner S, Johnson M, Bridgham J, Golda G, Lloyd DH, Johnson D, Luo S, McCurdy S, Foy M, Ewan M, Roth R, George D, Eletr S, Albrecht G, Vermaas E, Williams SR, Moon K, Burcham T, Pallas M, DuBridge RB, Kirchner J, Fearon K, Mao J, Corcoran K (2000) Nat Biotechnol 18:630–634
14. Mortazavi A, Williams BA, Mccue K, Schaeffer L, Wold B (2008) Nat Methods 5:621–628
15. Mardis ER (2008) Annu Rev Genomics Hum Genet 9:387–402 16. Bellin D, Ferrarini A, Chimento A, Kaiser O, Levenkova N,
Bouffard P, Delledonne M (2009) BMC Genomics. doi:10.1186/ 1471-2164-10-555
17. Pariset L, Chillemi G, Bongiorni S, Spica VR, Volentini A (2009) New Biotech 25:272–279
18. Garcia-Reyero N, Griffitt RJ, Liu L, Kroll KJ, Farmerie WG, Barber DS, Denslow ND (2008) J Fish Biol 72:2354–2376 19. Marguerat S, Bähler J (2010) Cell Mol Life Sci 67:569–579 20. Yang L, Kemadjou JR, Zinsmeister C, Bauer M, Legradi J, Muller
F, Pankratz M, Jakel J, Strahle U (2007) Genome Biol 8:R227 21. Van Aggelen G, Ankley GT, Baldwin WS, Bearden DW, Benson
WH, Chipman JK, Collette TW, Craft JA, Denslow ND, Embry MR, Falciani F, George SG, Helbing CC, Hoekstra PF, Iguchi T, Kagami Y, Katsiadaki I, Kille P, Liu L, Lord PG, McIntyre T, O'Neill A, Osachoff H, Perkins EJ, Santos EM, Skirrow RC, Snape JR, Tyler CR, Versteeg D, Viant MR, Volz DC, Williams TD, Yu L (2010) Environ Health Perspect 118:1–5
22. Hering JG (2009) Environ Chem 6:290–293
23. Frias-Lopez J, Shi Y, Tyson GW, Coleman ML, Schuster SC, Chisholm SW, Delong EF (2008) Proc Natl Acad Sci USA 105:3805–3810
24. Gilbert JA, Field D, Huang Y, Edwards R, Li W, Gilna P, Joint I (2008) PLoS ONE. doi:10.1371/journal.pone.0003042
25. Voelker D, Vess C, Tillmann M, Nagel R, Otto GW, Geisler R, Schirmer K, Scholz S (2007) Aquat Toxicol 81:355–364 26. Poynton HC, Varshavsky JR, Chang B, Cavigiolio G, Chan S,
Holman PS, Loguinov AV, Bauer DJ, Komachi K, Theil EC, Perkins EJ, Hughes O, Vulpe CD (2007) Environ Sci Technol 41:1044–1050 27. Connon R, Hooper HL, Sibly RM, Lim FL, Heckmann LH, Moore DJ, Watanabe H, Soetaert A, Cook K, Maund SJ, Hutchinson TH, Moggs J, De Coen W, Iguchi T, Callaghan A (2008) Environ Sci Technol 42:2181–2188
28. Heckmann LH, Sibly RM, Connon R, Hooper HL, Hutchinson TH, Maund SJ, Hill CJ, Bouetard A, Callaghan A (2008) Genome Biol. doi:10.1186/gb-2008-9-2-r40
29. Roh JY, Sim SJ, Yi J, Park K, Chung KH, Ryu DY, Choi J (2009) Environ Sci Technol 43:3933–3940
30. Bundy JG, Sidhu JK, Rana F, Spurgeon DJ, Svendsen C, Wren JF, Sturzenbaum SR, Morgan AJ, Kille P (2008) BMC Biol. doi:10.1186/1741-7007-6-25
31. Villeneuve DL, Larkin P, Knoebl I, Miracle AL, Kahl MD, Jensen KM, Makynen EA, Durhan EJ, Carter BJ, Denslow ND, Ankley GT (2007) Environ Sci Technol 41:321–330