ORIGINAL
Laboratory investigation on measuring suspended sediment
by portable laser diffractometer (LISST) focusing
on particle shape
David Felix&Ismail Albayrak&Robert M. Boes
Received: 1 April 2013 / Accepted: 8 October 2013 / Published online: 25 October 2013 # Springer-Verlag Berlin Heidelberg 2013
Abstract This paper deals with a laboratory investigation on measuring suspended sediment volume and mass concentra-tion (SSC) and particle size distribuconcentra-tion (PSD) by a portable submersible laser diffractometer (LISST-100X ) focusing on effects of particle shape and inversion modes on the results. Experiments were carried out in a mixing tank using suspen-sions of glass beads, fine quartz sand, feldspar and mica powder particles of spherical, rounded, angular and flaky shapes respectively, at various SSCs. SSCs and PSDs mea-sured by LISST were compared to SSCs from gravimetric analysis and to PSDs obtained from image analysis of dry particles and from a non-portable laser diffractometer. Experiments using spherical and rounded particles showed that LISST with the corresponding inversion modes, i.e. spherical and‘random shaped’, provides PSD and SSC values similar to reference methods. For angular and flaky particles, however, SSCs were found to be overestimated by factors of 1.5 and 8 respectively. Measurements in a mixture of 70% feldspar and 30% mica powders showed that the SSC overes-timation factor for mixed particle-type suspensions can be predicted as the weighted sum of the SSC factors of the components and their mixing ratio. For known highly non-spherical particle types, LISST SSCs can be corrected by a gravimetrically determined or predicted overestimation factor. Moreover, correction of overestimated contributions of lower size bins, the range of measureable SSC and time averaging of LISST measurements are addressed. Further investigations are necessary to assess effects of non-spherical particles and mixtures of various particle types on LISST SSC and PSD estimates.
Introduction
Monitoring of suspended sediment mass concentration (SSC) and particle size distribution (PSD) is important for improved understanding and management of sediment-related processes in natural aquatic systems such as rivers, lakes, estuaries and seas, and at hydraulic schemes for hydropower, irrigation or flood protection. An overview of methods for measuring suspended sediment is given by Wren et al. (2000). Pumped or manual bottle sampling is a discontinuous technique with poor temporal resolution. Samples have to be transported to a laboratory, where SSC is determined by weighing of oven-dried residues (gravimetric analysis) and PSD by sieving, hydrometer or pipette analysis (Konert and Vandenberghe
1997), image analysis or laser diffraction (LD). Such sampling is costly, not practical and insufficient to capture the dynamic processes of sediment mobilization, transport, deposition and re-suspension in field conditions. Hence, practical systems for continuous measurements, preferably in real time, are required.
Among the techniques employed for such measurements, turbidimeters are the most common with the drawback of a particle size-dependent calibration leading to significant errors in SSC estimates in environments where PSD considerably varies in time and is not well correlated with SSC. Similarly, acoustic systems using one frequency are also affected by particle size. Multi-frequency acoustic devices to determine SSC and PSD are under development (e.g. Thorne et al.2007; Skripalle et al.2012). Since 1995, portable and submersible LD devices, from which both SSC and PSD estimates can be obtained, are available for field studies (known as‘laser in-situ scattering and transmissiometry’, LISST). Such devices are mainly used in marine research (e.g. Bowers and Braithwaite
2012; Fettweis et al.2012). Since a few years, their use has been extended to suspended sediment measurements in the context of turbine wear (e.g. Boes2009, Agrawal et al.2012)
D. Felix (*)
:
I. Albayrak:
R. M. BoesLaboratory of Hydraulics, Hydrology and Glaciology (VAW), ETH Zurich, Swiss Federal Institute of Technology, Wolfgang-Pauli-Str. 27, 8093 Zurich, Switzerland
and reservoir sedimentation (e.g. Haun et al.2013). LISST has the advantages of yielding particle volume concentration (PVC), which is converted to SSC using particle density, theoretically without effect of particle size, and PSDs with high temporal resolution (approx. 1 Hz).
LD has been used for decades and is widely accepted in industry and research for particle size analysis in laborato-ries. In the technique of LD, measured data on scattering and transmission are inverted to obtain PSD and PVC by an algorithm (kernel matrix), which is usually based on the assumption that particles have spherical shape (Mie solu-tion to Maxwell equasolu-tions). More recently, an addisolu-tional inversion mode for so-called random shaped particles was developed by Agrawal et al. (2008) and added to the LISST software for data analysis. Agrawal et al. (2008) stated that the term‘random’ refers to particles with no preferred axes, and clarified that elongated and platy particles were not considered. Although the latter particle types exist in natu-ral environments, no specific inversion mode is available yet to the knowledge of the present authors. The literature review given in Agrawal et al. (2008) indicates a lack of experimental investigations on effects of highly non-spherical particle shapes on PSD and especially on SSC estimates from LD.
In the study reported here, effects of particle shape, inversion modes and mixture of particle types on LISST SSC and PSD estimates and on the SSC-measuring range are addressed by an experimental investigation using a LISST-100X . A series of experiments with suspensions made of water and four types of mineral particles varying in shape (glass beads, fine quartz sand, feldspar and mica powder) was carried out in a mixing tank. This laboratory investiga-tion was an initial part of a research project on suspended sediment monitoring in the context of hydro-abrasive wear at turbines in hydropower plants (Felix et al. 2012, 2013) initiated by the Laboratory of Hydraulics, Hydrology and Glaciology (VAW) of the Swiss Federal Institute of Technology, ETH Zurich in collaboration with Hochschule Luzern, Competence Centre for Fluid Mechanics and Hydro Machines.
Materials and methods Mineral particles
The mineral particles used in this laboratory investigation were selected with reference to a case study site in the Swiss Alps, where suspended sediment consists of mainly quartz, feldspar and mica particles, i.e. the main components of granite rock. In the upper reaches of mountain streams, espe-cially from glaciated catchment areas, suspended mineral particles have typically angular shape, as opposed to
downstream sites where particles tend to be more rounded due to fluvial transport. The basic particle shape depends on mineral properties, such as the characteristic layer structure of mica that generates platy particles.
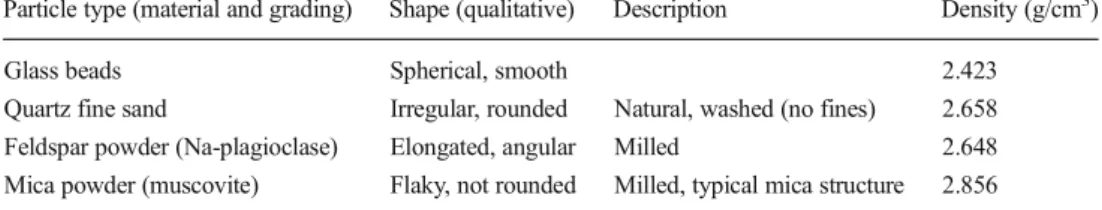
This paper covers investigations using four types of particles listed in Table 1 and shown in Fig. 1. The particles were purchased from commercial applications. Glass beads were chosen as a reference due to their ideal shape. Since the water at the study site comes from a highly glaciated catchment area and has a temperature of less than 5 °C throughout the year, no organic particles were studied. The density of the selected particle types was measured using a gas expansion pycnometer. Particle shapes are seen from Fig. 1. All four types of particles have whitish color.
Definitions of particle sizes and shape
When considering non-spherical particles, the parameteriza-tion of particle size and shape in three-dimensional space is not evident. An approach described by Nichols (2009) is adopted here. A particle is characterized firstly by the three dimensions of an enveloping cuboid and secondly by the degree of rounding of its primary shape. The longest, the intermediate and the shortest diameter of a particle are denoted by a , b and c respectively, where c is measured perpendicular to the longest diameter and b is measured perpendicular to a and c . The aspect ratios b /a and c /b (ranging between 0 and 1) indicate the basic particle shape, which can be cubic (equant), platy (discoid, flaky), blade- or rod-like. The volume-equivalent sphere diameter des serves as a simple and comparable parameter for the size of non-spherical particles.
Additionally, the Sauter mean diameter (SMD), defined as 6 times the volume divided by the surface area of an ensemble of particles, is used when the specific area of graded, espe-cially non-spherical particles is relevant. For non-graded spheres SMD corresponds to the sphere diameter.
Instrumentation and experimental setup
A portable submersible LD device, a LISST-100X , Type C (from Sequoia Scientific, Inc., Bellevue, WA) was used. Its optical path length was reduced from 50 mm to 5 mm by insertion of a 90% path-reduction module (glass cylinder) to extend the range of measurable SSC. The principles of LD, the construction of LISST instruments, and the mathematical approach used in the data treatment and analysis are described in Agrawal and Pottsmith (2000). In the present study the two inversion modes available with LISST are referred to as IMS for spherical and IMR for ‘random shaped’ particles. The nominal range of measurable particle sizes of this device is 2.5 to 500μm for IMS, and 1.9 to 381 μm for IMR (Sequoia
2011). LISST yields PVCs in 32 log-spaced size bins. Cumulative PSD is calculated from the contribution of each size bin. SSC is obtained by multiplying the sum of the PVCs with the particle density, which has to be either known a priori or measured by another device.
Measurements were carried out on suspensions pre-pared in a mixing tank shown in Fig.2as used previously by, for example, Abgottspon (2011) and Costa et al. (2012). The tank (2.12 m long and 1.13 m wide) is equipped with a central stirrer running at about 300 rev-olutions per minute, resulting in highly turbulent flow conditions to prevent particles from settling. This relative-ly big tank allowed accommodating a set of instruments. The LISST was mounted horizontally at 60% of the water depth above the tank invert, with the laser beam approx. 0.2 m off the wall. A pump line, connected to the tank for simultaneous testing of in-line turbidimeters, contributed to mixing in the tank.
Experimental procedure
Five series of measurements were carried out at increasing SSCs. While in four series single types of particles as listed in Table1were used, 70% feldspar and 30% mica powders were mixed for the last series (mixing ratio according to mass). From many possibilities of mixed particle-type experiments, a mixture of feldspar and mica was chosen with regard to the study site, where mainly angular particles (quartz and feld-spar) and up to 30% by mass of platy particles (mica) are expected (Abgottspon2011).
Suspensions were prepared with clear drinking water and mineral particles (no dispersant agent added). As a preparation of each series, the tank was filled to a water depth of h =0.5 m (Fig.2), corresponding to a volume of 1.2 m3. In each series, SSC was increased stepwise until the SSC-measuring range of the LISST was exceeded. SSC was increased to the next level by adding a portion of particles with weights calculated to
Table 1 Properties of mineral
particles Particle type (material and grading) Shape (qualitative) Description Density (g/cm3) Glass beads Spherical, smooth 2.423 Quartz fine sand Irregular, rounded Natural, washed (no fines) 2.658 Feldspar powder (Na-plagioclase) Elongated, angular Milled 2.648 Mica powder (muscovite) Flaky, not rounded Milled, typical mica structure 2.856
Fig. 1 Particles used in the experiments: a glass beads, b quartz fine sand, c feldspar powder and d mica powder (SEM images a courtesy of Hochschule Luzern, b–d ETH Zurich)
reach the next nominal SSC level. Nominal SSC is the total weight of added particles divided by the volume of suspension in the tank. At the beginning of each test series, the so-called background scatter in the water (with no added particles) was recorded by LISST. This allows also checking whether the path reduction module has been installed properly (no air between the receiving window and the module).
At each nominal SSC, after a mixing time of at least 10 minutes, a LISST measurement consisting of 100 single mea-surements was performed in real-time mode using the LISST SOP (v5) software. The measuring frequency in this mode was between 0.4 and 0.6 Hz, corresponding to a measuring duration of approx. 3 to 4 minutes at each nominal concentra-tion level. From the raw data of each single measurement, PVCs were processed with both IMS and IMR using the recorded background scatter of the respective test series. SSCs were calculated from the PVCs using the densities listed in Table1.
SSC reference measurements
In order to have a reference for LISST SSCs, two suspension samples per nominal SSC in each test series were taken from the tank at the level of the LISST’s laser beam. SSCs of these samples were calculated based on the weight of the samples before and after evaporating the water in an oven (primary method for SSC). The sample volume was normally 0.1 l, and was increased to 0.5 l at low SSCs to achieve sufficient
precision in weighing of residues for all samples. Since dried residues contained not only particles but also minerals that had been dissolved in the drinking water, the dissolved solids concentration was deducted from the total mass concentration. The concentration of dissolved solids in the drinking water was measured at the beginning of each series and was found to be approx. 0.15 g/l. SSCs from the bottle samples were averaged for each nominal concentration level. In the follow-ing, these are referred to as‘reference SSCs’.
PSD reference measurements
For comparison with LISST PSD estimates, PSDs for each particle type were obtained from both the analyses of scanning electron microscope (SEM) images and a non-portable LD device. The samples for the reference PSD measurements were taken from the dry particle material prior to the LISST measurements.
Image analysis
Information on PSD and particle shape of the four particle types was obtained from geometric measurements on micro-scope images shown with scaling bars in Fig. 1. The two dimensions of particles visible in the plane of the image, i.e. usually a and b , were measured for each particle type for approx. 100 selected particles. For mica, with some upright-standing flakes visible in the image (Fig.1d), the flake thick-ness c was measured and correlated with a . The correlation between c and a was used to estimate the flake thickness when it was not visible in the image. For the other particle types, c was estimated from the image assuming a typical shape. For mica and feldspar powders containing particles with a <5μm, which could not be individually counted, the fraction of finer particles was estimated (<10%). From the listed a , b and c values, the volume and surface area of each particle were calculated assuming spheres, ellipsoids or cu-boids, depending on the particle type. The sorted volume values were used to obtain distributions of the particle sizes a , b , c and des according to the mass fraction, similar to classical sieve curves. The total volume and surface area of the measured particles served to estimate SMD. In this study, image analysis is used as primary method for particle size and shape.
Non-portable laser diffractometer
Additional PSD measurements were performed with a LA-950 from Horiba, which was available for this study at the Geotechnical Institute of ETH Zurich. This device is a non-portable laboratory LD with a nominal size-measuring range of 0.01μm to 3 mm. In addition to forward scattering at small angles, it measures and evaluates side- and backward
Fig. 2 Mixing tank with LISST device: a vertical section and b plan view (modified from Felix et al.2012)
scattering as well, which allows assessing particle sizes below the wavelength (sub-micron range). Calculation of PSDs is based on the assumption of spherical particles. The PSDs were measured in suspensions of adequate concentrations in a small stirring chamber (SSC was not measured).
Results
Particle size and shape based on image analysis
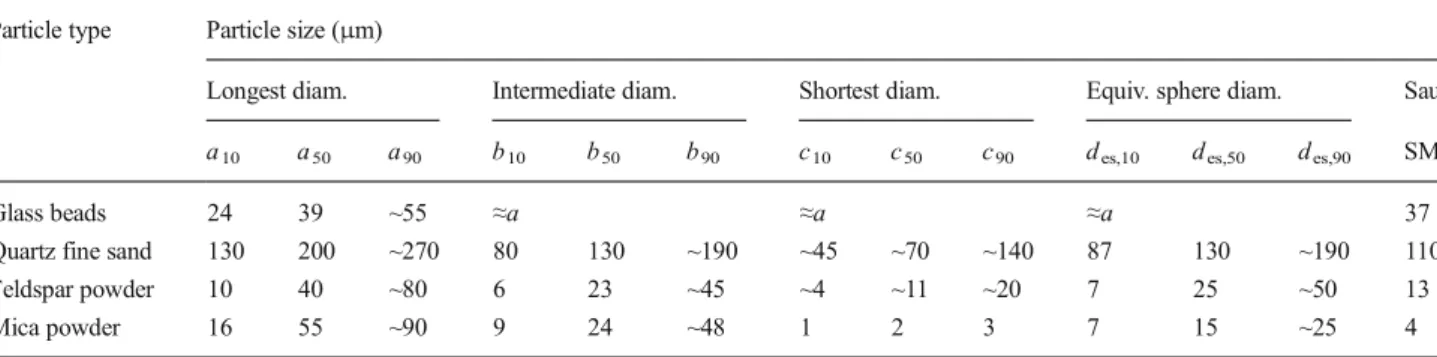
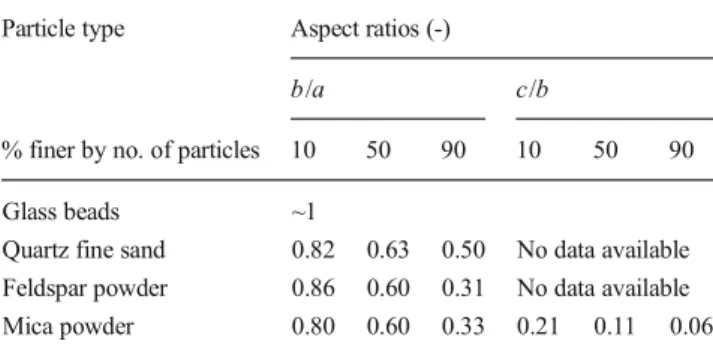
The particle sizes obtained from image analysis are summa-rized in Table2using the definitions given above. To describe sizes of graded particles, a subscript serves to denote the percentage of finer particles (by mass). In addition, the aspect ratios b /a and c /b , which give quantitative information on the basic particle shapes, are presented in Table3. Qualitative information on the degree of rounding is found in Table1. Feldspar and mica powders include more elongated particles compared to quartz fine sand (low b /a values at 90% fractile). Whereas the particle shapes of glass beads, quartz fine sand and feldspar powder are approx. independent of particle size (self-similarity), the shape of mica particles varies strongly with size. Since the flake thickness c of mica is almost constant at about 2μm, the aspect ratio c/b decreases with increasing particle size (b and a ).
Effects of particle shapes and LISST inversion modes on SSC estimates
SSCs obtained using IMS and IMR are shown as a function of reference SSCs in Fig. 3 for each particle type. Each point represents one LISST measurement at a nominal SSC, i.e. the time average of 100 single measurements. The effect of inver-sion mode is quite small with all four investigated particle types. For glass beads, SSC obtained by IMS was found to be generally closer to reference SSC than by IMR, as expected for this particle shape. For the highly non-spherical particles (feldspar and mica), IMR yields slightly smaller SSC esti-mates than IMS, closer to reference SSCs.
For quartz fine sand and glass beads, LISST SSCs are in good agreement with reference SSCs (generally close to 1:1 lines). For feldspar powder, however, LISST overestimates SSC by a factor of 1.53 and for mica by a factor of about 8. Note that for quartz fine sand LISST measurements were possible beyond the range plotted in Fig. 3b. The SSC-measuring range of the LISST is treated below in the section ‘Upper limit of measureable SSC’.
Effects of particle shapes and LISST inversion modes on PSD estimates
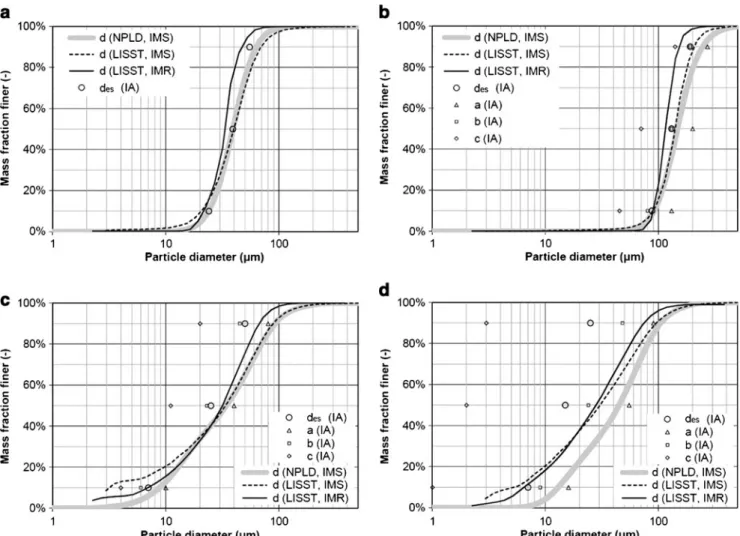
Figure4shows the PSDs obtained from LISST using IMS and IMR, as well as PSDs obtained from the non-portable LD and information on particle sizes from image analysis (Table2) for the four particle types. LISST PSDs are the results of the measurements taken at a nominal SSC of 1 g/l, i.e. the aver-ages of 100 single measurements each. Selected results from LISST measurements shown in Fig. 4 and the so-called spreading, σ=(d84/d16)0.5, which describes the ‘width’ of a PSD, are given in Table4for each particle type.
As expected for glass beads, the PSD obtained from LISST with IMS (broken line in Fig.4a) matches well with the PSD from non-portable LD (grey line), and the median particle size d50from LISST with IMS (40μm, Table4) corresponds well to the value obtained from image analysis (39μm, Table2). Using IMR instead of IMS produces smaller sizes at the coarse fractions within the PSD.
For quartz fine sand, PSDs from LISST IMS and non-portable LD are similar again, and using IMR instead of IMS has a similar effect as observed with glass beads. The intermediate and the equivalent sphere diameter at 50% by mass obtained from image analysis (b50≈ des,50= 130μm, Table2) are within the d50values from LISST IMR and IMS (116 and 141μm respectively, Table4).
For feldspar powder, the PSD obtained with LISST IMS is well in line with that from non-portable LD, except for finer particles, where LISST shows more fine particles to-wards the lower end of its size-measuring range. With IMR the deviation at fine particles is less pronounced. Although
Table 2 Particle sizes obtained from image analysis Particle type Particle size (μm)
Longest diam. Intermediate diam. Shortest diam. Equiv. sphere diam. Sauter a10 a50 a90 b10 b50 b90 c10 c50 c90 des,10 des,50 des,90 SMD
Glass beads 24 39 ~55 ≈a ≈a ≈a 37
Quartz fine sand 130 200 ~270 80 130 ~190 ~45 ~70 ~140 87 130 ~190 110 Feldspar powder 10 40 ~80 6 23 ~45 ~4 ~11 ~20 7 25 ~50 13 Mica powder 16 55 ~90 9 24 ~48 1 2 3 7 15 ~25 4
the measurement with non-portable LD indicates that the feldspar powder contains no particles smaller than the lower
limit of the size-measuring range of the LISST (approx. 2 μm), the LISST PSDs using both IMS and IMR do not set in at 0% at the lower limit of the size-measuring range. This means that, in the LISST measurements of feldspar powder, a considerable proportion of PVC is detected in the lowest size bin. Similar to glass beads and fine quartz sand, IMR yields smaller sizes in the coarse fractions within the PSD compared to those obtained with IMS or non-portable LD. The d50 values of the feldspar particles (with angular and elongated shapes) obtained from LISST IMR and IMS (32 and 34μm respectively, Table4) are greater than the corre-sponding intermediate and equivalent sphere diameters ob-tained from image analysis (b50≈23 μm, des,50=25 μm, Table2).
Table 3 Quantification of basic particle shapes based on image analysis Particle type Aspect ratios (-)
b/a c/b
% finer by no. of particles 10 50 90 10 50 90 Glass beads ~1
Quartz fine sand 0.82 0.63 0.50 No data available Feldspar powder 0.86 0.60 0.31 No data available Mica powder 0.80 0.60 0.33 0.21 0.11 0.06
Fig. 3 SSCs obtained from LISST using both inversion modes compared to reference SSCs: a glass beads, b quartz fine sand, c feldspar powder and d mica powder
For mica powder, LISST yields with both inversion modes smaller particle sizes than the non-portable LD. The particle size d50with IMR (28μm) is slightly greater than the interme-diate diameter of the mica flakes (b50≈24 μm) and considerably greater than the equivalent sphere diameter (des,50=15 μm), which were obtained from image analysis. IMR yields less fine and coarse particles within PSDs compared to IMS, i.e. the
spreading of the PSD obtained by IMR is smaller, which is qualitatively similar to the results for feldspar powder.
Effects of SSC on LISST PSD estimates
Ideally, PSD should not depend on SSC for a given particle type. However, in the experiments shifts in PSDs were observed with increasing SSC, especially with SSC approaching the upper limit of the SSC-measuring range of LISST. The PSDs using IMR for a range of SSC are shown in Fig.5for the four particle types. For glass beads and quartz fine sand, the PSDs up to a few g/l are quite constant with increasing SSC and slightly deviate to finer sizes at higher SSCs such as 10 or 20 g/l. The proportion of fine particles within the measured PSDs of mica and feldspar powders increases with increasing SSC. For feldspar powder the proportion of PVC obtained in the lowest size bin increases at higher SSC (growing offset at the fine end of PSDs in Fig.5c). This effect is also visible in Fig.6in which the contributions of the size bins to total PVC are shown. Similarly, SSC overesti-mation slightly increasing with SSC is seen at the individual
Fig. 4 PSDs obtained from LISST (using both inversion modes, at nominal SSC=1 g/l) and from the non-portable LD device (NPLD) in comparison to particle sizes from image analysis (IA): a glass beads, b quartz fine sand, c feldspar powder and d mica powder
Table 4 Particle sizes and spreading obtained from LISST (at nominal SSC=1 g/l)
Particle type Particle size (μm) Spreadingσ of PSDs (-) IMS IMR
d10 d50 d90 d10 d50 d90 IMS IMR
Glass beads 20 40 69 22 33 47 1.59 1.33 Quartz fine sand 89 141 208 89 116 154 1.37 1.22 Feldspar powder 3 34 89 7 32 67 3.23 2.40 Mica powder 5 30 95 6 28 75 3.15 2.65
IMR points in Fig.3c. On the contrary, for mica powder there are no offsets at the fine end of the measured PSDs.
Mixed particle-type effects on SSC and PSD
Figure7shows IMR SSCs of feldspar and mica suspensions (as in Fig.3c and d) and of a suspension made of 70% feldspar and 30% mica as a function of reference SSC with linear fits
(calibration curves) and equations (SSC overestimation fac-tors). LISST overestimates SSC of this mixture by a factor of
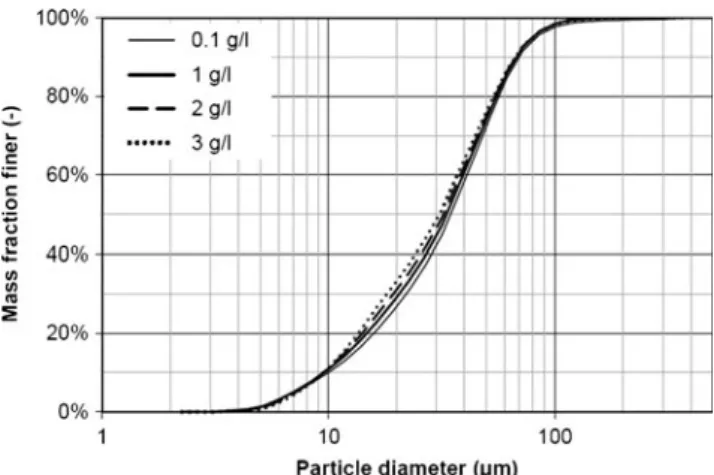
Fig. 5 PSDs obtained from LISST using IMR at increasing SSCs: a glass beads, b quartz fine sand, c feldspar powder and d mica powder
Fig. 6 Contribution of each of the 32 size bins to total PVC measured in feldspar powder suspension at increasing SSC using IMR
Fig. 7 LISST SSCs of feldspar and mica powders and a 7:3 mixture of these components as a function of reference SSC using IMR, in compar-ison to the predicted curve for the mixture
3.33. Assuming that the SSC overestimation factor for a mixed particle-type suspension can be calculated as the weighted sum of the SSC overestimation factors of the com-ponents and their mass fractions, the predicted calibration curve for the mixture was plotted, too. The slope of this curve, i.e. the predicted overestimation factor, is 70% × 1.53 + 30% × 8.22 = 3.54, which is in a good agreement with the experi-mentally determined value of 3.33, justifying the assumption of linear superposition.
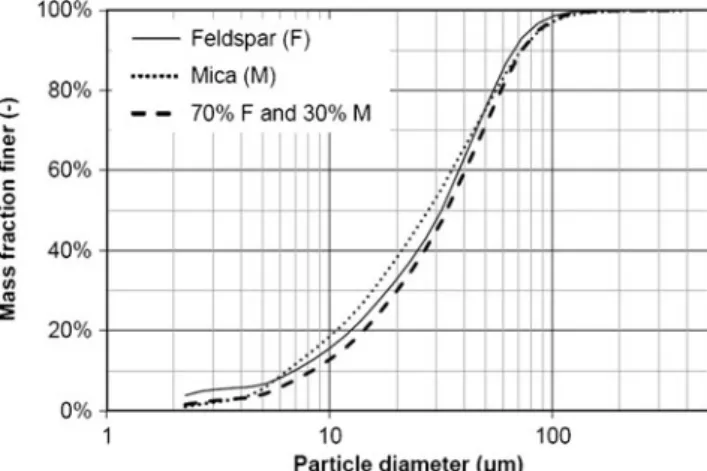
Figure 8 shows the PSDs for the mixture and its two components individually (Fig.4c and d). Again, the curves are the averages of 100 single measurements taken at a nom-inal SSC of 1 g/l, processed with IMR. By coincidence, the LISST PSDs of the feldspar and mica particles are similar even though their particle sizes and shapes are different ac-cording to image analysis. For the mixture, no considerable shift in PSD was observed.
Upper limit of measureable SSC
The nominal range of SSC that can be measured with LISST according to the instrument manufacturer (Sequoia 2008) is plotted in Fig.9(shaded area) as a function of SMD. The upper limit of the nominal SSC-measuring range scales linearly with SMD and is based on the recommended value of optical trans-missionτ≥0.3 and a particle density of 2.65 g/cm3(Sequoia
2008). Below this limit, measurements may still be possible, but reportedly with less accuracy due to multiple scattering.
Withτ decreasing below 0.3, some or eventually all of the single measurements performed at one nominal SSC result in zero values for PVCs when the data are processed using the LISST software. In other words, data in some or all rows of the raw data file may be non-invertible as SSC reaches or exceeds the upper limit of measurable SSC. In the present study, the ratio k of the number of invertible to the total number of single measurements at each nominal SCC was calculated. The highest reference SSC with k =1 and the reference SSC of
the next higher nominal SSC level (with k <1) are plotted in Fig.9for each particle type, as a function of SMD obtained from image analysis (Table2). The values of k andτ are also indicated in the figure. The latter were obtained from LISST and averaged over the invertible measurements. The inversion of all single measurements (k =1) at each nominal SSC was possible down toτ values between 0.12 and 0.27. As the SSC was increased stepwise in the experiments, the highest SSCs with k =1 are not exactly known; nevertheless, it is known that the upper limit of the SSC-measuring range lies between each pair of points (withτ<0.3). Note that the information shown in Fig. 9 refers to a LISST-100X with a 90% path reduction module inserted (without path reduction module, the upper limit of measurable SSC would be 10 times lower).
Fluctuations of SSC and PSD
SSC and PSD data obtained from measurements at each nom-inal SSC level exhibit temporal variations (fluctuations). Figure10shows two examples of SSC time series (extract of 2 minutes) measured in suspensions of quartz fine sand or
Fig. 8 LISST PSDs of feldspar and mica powders, and a 7:3 mixture of these components (using IMR at nominal SSC=1 g/l)
Fig. 9 SSC range that can be measured by LISST as a function of SMD: experimental results (with rate of invertible measurements k and optical transmissionτ) in comparison to nominal range (shaded area)
Fig. 10 Normalized time series of LISST SSC for feldspar powder and quartz fine sand at nominal SSC=1 g/l
feldspar powder, both at nominal SSC=1 g/l using IMR. The instantaneous SSC values of each series are normalized by their time averages. SSC fluctuations for quartz fine sand are greater than for feldspar powder.
Table5summarizes the coefficients of variation (CV) of LISST SSCs, i.e. the standard deviation of 100 single mea-surements divided by their time average, for the four particle types with increasing SSCs. The CV is a measure of relative deviations of instantaneous SSC from its mean value and allows a comparison across measurements at various SSCs. It was found that the CVs of quartz fine sand are about 3 to 6 times higher than those of the other particle types. Moreover, for quartz fine sand the CV decreases with increasing SSC while for the other particle types less dependence on SSC was observed.
Characteristic ranges of PSDs obtained from LISST again using IMR for quartz fine sand or feldspar powder at nominal SSC=1 g/l are shown in Fig.11. For both particle types the time-averaged PSD (thick lines) are plotted together with the 5% and 95% fractiles (thinner lines). The fractile values were obtained by taking the 5th and the 95th value out of 100 sorted values in the respective size classes. Absolute PSD fluctua-tions (inμm) are greater with coarser particles. The relative fluctuation of, for example, d50 is similar for both particle types.
Discussion
Accuracy and experimental errors
For the relatively fine particles (feldspar and mica powders, as well as glass beads), the determined reference SSCs were not more than 10% below nominal SSCs, indicating a satisfactory mixing in the tank. For coarser particles (quartz fine sand), however, SSCs of individual bottle samples fluctuated consid-erably and average reference SSCs per concentration level were generally some 40% below nominal SSCs due to incomplete mixing. Besides incomplete mixing, deviations between
reference and nominal SSCs can be attributed partly to instan-taneous local SSC variations and partly to imperfections when taking or treating the samples. The SSC data points in Fig.3
indicate that the experimental setup and procedure allowed getting systematic results, although the SSC data show some scatter around the average for each particle type. An indepen-dent second measurement performed with quartz fine sand at reference SSC of 0.5 g/l showed a good reproducibility (5% deviation among repeated reference SSC measurements and less than 1% deviation among repeated time-averaged LISST SSCs).
Reference PSDs were not determined from the samples taken from the mixing tank but from the dry material prior to the experiments, which potentially lead to non-representative sampling. With respect to image analysis, coarser fractions within PSDs are subject to uncertainty de-pending on the selected investigation area and due to the small number of coarser particles. PSDs from non-portable LD are, as LISST, subject to effects of particle shape and should thus not be considered as results of a primary method for the non-spherical particle types but rather as an additional independent measurement from an LD device with a wider size-measuring range. For future laboratory investigations, analyses of a high number of microscope images based on automatic object detection and/or using certified particles are recommended to increase the accuracy of reference PSDs.
The effect of incomplete mixing in the tank is not relevant with regard to SSC since the SSC prevailing in the tank at the instrument’s level was taken as reference. With regard to PSDs, however, incomplete mixing occurring especially at high SSC and with coarser particles may cause deviations from reference PSDs because the samples were not directly taken from the tank in which coarser particles may settle or preferentially stay below the instrument’s level (vertical SSC gradient). Effects of potential flocculation were neglected, since it was assumed that the particle densities correspond to the solid densities of the minerals.
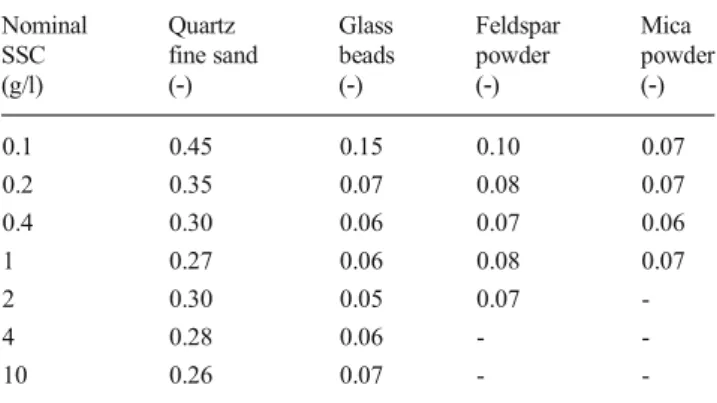
Table 5 Coefficients of variation (CVs) of LISST SSCs Nominal SSC Quartz fine sand Glass beads Feldspar powder Mica powder (g/l) (‐) (‐) (‐) (‐) 0.1 0.45 0.15 0.10 0.07 0.2 0.35 0.07 0.08 0.07 0.4 0.30 0.06 0.07 0.06 1 0.27 0.06 0.08 0.07 2 0.30 0.05 0.07 -4 0.28 0.06 - -10 0.26 0.07 -
-Fig. 11 Fluctuations of LISST PSDs for feldspar powder (F) and quartz fine sand (Q) at nominal SSC=1 g/l
Particle shape and inversion mode
The biases on LISST measurements due to particle shape are discussed first with respect to SSC and secondly with respect to PSD. It was found that non-spherical particles cause stron-ger biases on SSC than on PSD.
For glass beads and quartz fine sand with spherical and rounded shapes, and with d50in the size range of coarse silt to fine sand, the LISST yields SSC estimates with reasonable accuracy (Fig.3a, b). Note that this is based on the factory calibration (instrument-specific volume conversion constant). With respect to SSC, the selection of inversion mode plays a minor role for these particle shapes. However, the measure-ments in suspensions of feldspar and mica powders showed that LISST considerably overestimates SSCs (Fig.3c, d). The elongated and partly very angular or flaky shapes of these particles (Fig. 1c, d) differ considerably from those of the natural sediment grains depicted in Agrawal et al. (2008) and used in the development of IMR. Using IMR instead of IMS only slightly reduces the overestimation of SSCs for strongly non-spherical particles (Fig.3c, d).
The considerable SSC overestimation measured with mica and feldspar powders can be explained by the deviation be-tween the particle sizes d obtained from LISST and the equivalent sphere diameters des from image analysis. For mica, the ratio of the median diameters obtained by the two methods is d50/des,50= 28/15 = 1.87 (using IMR). A factor of 1.87 in particle diameter causes a change in volume and thus SSC of 1.873= 6.5. Considering the ratio of particle diameters obtained by the two methods not only for the median diame-ters but also for the whole PSD, an SSC overestimation of 9.6 was calculated (based on diameter ratios in steps of 10% by weight). For feldspar powder an SSC overestimation of 1.8 was calculated with the same procedure. The measured SSC overestimations by a factor of 8 for mica and by a factor of 1.53 for feldspar powders are thus not surprising and are mainly attributed to non-spherical particle shapes. Further investigations on this aspect are recommended, considering also the light scattering of angular particles.
LISST measurements in glass beads suspension, for which IMS is applicable by definition, yield PSD similar to those obtained from image analysis and non-portable LD (Fig.4a) as expected. For quartz fine sand, at which IMR is applicable, IMR yields particle sizes that are comparable to intermediate (b-axis) and volume-equivalent sphere diame-ters from image analysis (Fig. 4b). From the LISST PSDs using both inversion modes and the analysis of only one microscope image, it cannot be concluded whether IMR is an improvement over IMS with respect to PSD for this particle type. For feldspar and mica powder, i.e. highly non-spherical particles, the use of IMR reduces the spread-ing of PSDs and the overestimation at small particle sizes, which is discussed in the next section.
Overestimation at small particle sizes
In feldspar powder suspension, especially at SSC approaching the upper limit of measureable SSC, the LISST yielded rela-tively high PVCs at the lower end of its size-measuring range, i.e. in the lower size bins (Figs.5cand6). Previous studies (Agrawal and Pottsmith2000; Agrawal et al.2008; Andrews et al.2011) report that LISST may overestimate PVCs mainly in lower size bins contributing to the overestimation of SSC. This can be due to one or several of the following reasons: (1) presence of fine out-of-range particles, (2) multiple scattering at low optical transmission, (3) effects of refractive index and (4) effects of particle shape.
With respect to out-of-range particles , i.e. particles smaller or larger than the nominal sizes measurable with a given LD model, Agrawal and Pottsmith (2000) describe that such particles may affect LISST results since part of the scattering they cause is recorded at the most inner or most outer rings (‘leakage’ of out-of-range particles into the measuring range). The size-measuring range of a LD device is related to the range of angles at which scattering can be recorded. Andrews et al. (2011) describe that fine out-of-range particles have a stronger effect on LISST measurements than coarse out-of-range particles. As mentioned in the Results section above, there were no out-of-range particles based on the PSDs from the non-portable LD device with a measuring range down to 0.01μm (grey lines in Fig.4). The relatively high PVCs at lower size bins obtained by LISST in feldspar powder sus-pension are thus unrealistic and are not explained by fine out-of-range particles.
With respect to multiple scattering , Agrawal and Pottsmith (2000) reported that PSD may be biased to small sizes at optical transmission τ<0.3 (high turbidity). In the present study, in feldspar powder suspension at nominal SSCs of 0.1, 1, 2 and 3 g/l (see Fig. 5c), the corresponding optical transmissionsτ were 0.93, 0.50, 0.24 and 0.12 respectively. Multiple scattering may thus be an issue at higher SSCs. However, since unrealistically high PVCs in lower size bins were also obtained at τ>0.3, these cannot be attributed to solely multiple scattering.
As far as the refractive index is concerned, Andrews et al. (2011) reported a reduction of unrealistically high PVCs in lower size bins as a result of an alternative inversion procedure with a different refractive index. The refractive indices of glass, quartz and feldspar in water are quite similar; for mica it may vary according to the orientation of the particle. As the optical properties of the particles were not measured and custom inversion procedures were not treated in this study, effects of refractive indices cannot be addressed in detail but are considered to be unimportant except for mica. Since the highest overestimation of PVCs at small particle sizes was observed for feldspar powder, it is concluded that this effect is not to be explained by refractive index.
With respect to particle shape , Agrawal et al. (2008) showed that relatively high PVCs obtained in lower size bins can be associated with particle shape. By developing IMR, unrealistic contributions of lower size bins were reduced in comparison to IMS. Based on the measurements in this study, however, it is concluded that a non-negligible overestimation at lower size bins remains with feldspar powder suspension when using IMR. It appears that this effect is mainly associ-ated with very angular particle shape and, possibly, to a smaller extent with multiple scattering.
Omitting contributions of three lowest size bins
Since PVCs measured in the lower size bins in feldspar powder suspension are not realistic, a simple correction method was applied to the data. Expecting a unimodal PSD in Fig.6, it was decided to discard the PVCs of the three lowest size bins (1.9 to 3.1μm) in the calculation of SSC and PSD. In other words, the ‘raising tail’ at the fine end of the non-cumulative size distri-bution (Fig.6) is omitted. Figure12shows the effect of this correction on LISST SSCs for feldspar powder. These are reduced, but do not reach reference SSCs. With the correction the SSC overestimation depends less on SSC (better linear fit in Fig.12compared to Fig.7) and is reduced from 1.53 to 1.38. When the three lowest size bins are omitted, the corresponding PSDs in Fig.13are almost not affected by increasing SSC, in contrast to those before the correction shown in Fig.5c. Further experiments including angular particles are recommended to investigate the causes of unrealistically high PVCs at lower size
bins and PSD variations due to increasing SSC in order to find and validate correction methods with higher accuracy.
Particle shape-dependent SSC correction factors
LISST raw data are recorded on detector rings in a plane and are related to the average projected area of particles. For the calculation of PVC, information on the ratio of average projected area to particle volume is required. Such information comes from the selection of the inversion mode (according to particle shape) and the device-specific volume conversion constant—e.g. for mica flakes the ratio of average projected area to particle volume differs strongly from that of spheres.
The experiments showed that LISST IMR does not provide PVCs and SSCs with good accuracy for highly non-spherical particles. SCCs can be corrected using the overestimation factor, i.e. the slope of the calibration curve for a known particle type. For a known suspension made with particles of different shapes and known overestimation factors for the involved particle types, SSC can be corrected by the weighed sum of these factors and the mass fraction of the components, as found in one example (see Results section,‘Mixed particle-type effects on SSC and PSD’). Further investigations are suggested to support the generalization of this approach. The prediction of the overestimation factor in the example is improved when unrealistic contributions of the three lowest size bins, which occurred with feldspar powder, are omitted (cf. above; Fig.12): then, the predicted overestimation factor is 70% × 1.38 + 30% × 8.22 = 3.43, which is closer to the experimentally determined slope (3.33) than before.
The magnitudes of the correction factors found in this study for feldspar or mica powders should not be taken as fixed values since there are many different types and sub-types of minerals and particle shapes differing from those investigated in this study. In field studies, flaky or very angular particles usually make up just a fraction of the particle mix and there-fore it is suggested to determine a time-averaged SSC
Fig. 12 Effect on LISST SSC estimate if contributions of three lowest size bins are omitted (feldspar powder)
Fig. 13 LISST PSDs at increasing SSC without contributions of three lowest size bins (feldspar powder)
correction factor specifically for such a particle mixture pre-vailing at a measuring location. This can be done by a com-parison of LISST and reference SSCs obtained from laborato-ry analysis of manually or automatically taken bottled samples at corresponding times. In addition, microscope images of the particles prevailing at the study site may be useful to charac-terize the geometrical properties of the particles.
Range of measureable SSC
The SSC-measuring range of the LISST determined in this study is in good agreement with the nominal range given by the manufacturer as a function of SMD (Sequoia 2008), although optical transmissions slightly below τ=0.3 were measured at the nominal upper limit of the SSC-measuring range. For many LISST applications the upper limit of mea-surable SSC is important. In order to estimate it realistically, SMD has to be used for graded particles rather than d50, as recommended by Sequoia (2008). This is particularly impor-tant for elongated and platy particles, for which SMD is usually considerably smaller than d50. If higher SSCs are to be measured, a further reduction of the optical path length can be considered, or an in-line LISST device with a mixing chamber in which pumped samples are diluted with clear water at a known mixing ratio (Agrawal et al. 2011). The lower limit of measurable SSC (detection limit), however, was not relevant in the context of this study.
Time averaging
As seen from Table5, the CV values of LISST SSCs for glass beads, feldspar or mica powders are considerably smaller than those for fine quartz sand. This difference in the CVs can be attributed (1) to the interaction between the particles and the turbulent flow and (2) to the measurement method. Particle size has an influence on the particle behavior in the flow field because smaller particles (powder) mostly follow the local flow like a passive tracer, whereas larger particles (fine sand) show different behavior resulting in a less homogenous distribution. With respect to the measurement method, it has to be consid-ered that the number of particles in the relatively small mea-surement volume (thickness of the laser beam over an optical path length of 5 mm) decreases strongly with increasing parti-cle size: at identical SSC the number of fine sand partiparti-cles (e.g. 150μm) is about 1,000 times lower than the number of silt particles (e.g. 15μm), leading to phenomena well known in the statistical description of small populations. Therefore, time averaging of repeated single LISST measurements is particu-larly important for coarser particles, especially at low concen-trations. The measuring frequency and the period over which measurements are averaged have to be selected in accordance to the time scale of the process, the PSD and SSC of the expected particles, as well as the desired accuracy.
Conclusions
The results convincingly demonstrate that the LISST yields reasonable PSD estimates in the range of coarse silt to fine sand. With respect to SSC, the factory calibration of the instrument was found to be satisfactory for spherical and rounded particles using IMS and IMR respectively. However, when IMR is used with very angular, elongated or flaky particles, PSDs are biased, for feldspar mainly at lower size bins, and SSCs are considerably overestimated. For high-ly non-spherical particles, SSC estimates can be corrected by the overestimation factor of a given particle type. For suspen-sions containing various particle types, the SSC estimate can be corrected by the weighted sum of the overestimation fac-tors of the components and their mass fractions. If these are not known, then gravimetrical analyses of samples with a specific particle mix are required for calibration of SSC. In addition to applying factors on SSC, SSC and PSD can be corrected by omitting overestimated contributions of lower size bins if applicable.
With an optical path length of 5 mm, SSCs can be mea-sured up to a few g/l in a suspension of angular silt particles and up to approx. 25 g/l for rounded fine sand. Measurement accuracy can be improved by time averaging over a higher number of individually inverted single measurements, espe-cially for coarser particles at low SSC.
The intermediate diameter b was found to be similar to des for all particle types except for mica, which has a flake thickness that is an order of magnitude smaller than the length or width of the particles. Further investigations are necessary to assess effects of non-spherical particles and mixtures of various types of particles on LISST SSC and PSD estimates. Prior to field deployments, testing and calibrating of mea-suring devices under controlled laboratory conditions with respect to the specific application are important and strongly recommended. Compared to other available instruments for continuous real-time in-situ suspended sediment monitoring, LISST offers the great advantage of providing not only SCC but also PSD data at high temporal resolution, and the pro-vided SSC estimates are not, or less, affected by particle size changing in time.
Acknowledgements The authors gratefully acknowledge the financial support for this study by swisselectric research, the Swiss Federal Office of Energy and Gommerkraftwerke (the operator of the case study hydro-power plant). We thank Prof. Dr. T. Staubli, A. Abgottspon, Prof. Dr. P. Gruber, and M. Duss from Hochschule Luzern, Competence Centre Fluid Mechanics and Hydro Machines, for their valuable contributions to the laboratory investigations. Further thanks go to the Geotechnical Labora-tory and the Institute for Building Materials of ETH Zurich for the measurements of particle density and PSDs with non-portable LD, as well as the scanning electron microscope images of the particles. The efforts from Sequoia Scientific’s team for promoting knowledge ex-change in the domain of in-situ suspended sediment monitoring and contributions to measure other than smooth spherical particles by LD
are acknowledged. We thank Sequoia Scientific and the local partners for organizing the conference‘Particles in Europe’ held in October 2012 in Barcelona, where parts of this paper were presented. The constructive comments of three reviewers of this paper are acknowledged.
References
Abgottspon A (2011) Messung abrasiver Partikel in Wasserkraftanlagen. MSc Thesis, Hochschule Luzern, Switzerland
Agrawal YC, Pottsmith HC (2000) Instruments for particle size and settling velocity observations in sediment transport. Mar Geol 168: 89–114. doi:10.1016/S0025-3227(00)00044-X
Agrawal YC, Whitmire A, Mikkelsen OA, Pottsmith HC (2008) Light scattering by random shaped particles and consequences on mea-suring suspended sediments by laser diffraction. J Geophys Res 113, C04023. doi:10.1029/2007JC004403
Agrawal YC, Mikkelsen OA, Pottsmith HC (2011) Sediment monitoring technology for turbine erosion and reservoir siltation applications. In: Proc Hydro 2011 Conf, Aqua-Media Int Ltd, Prague, Czech Republic Agrawal YC, Mikkelsen OA, Pottsmith HC, Slade WH (2012) Turbine abrasion: one year’s experience in real-time sediment monitoring at Hidroagoyan HPP, Ecuador. In: Proc Hydro 2012 Conf, Aqua-Media Int Ltd, Bilbao, Spain
Andrews SW, Nover DM, Reuter JE, Schladow SG (2011) Limitations of laser diffraction for measuring fine particles in oligotropic systems: pitfalls and potential solutions. Water Resour Res 47, W05523. doi:
10.1029/2010WR009837
Boes RM (2009) Real-time monitoring of suspended sediment concen-tration and particle size distribution in the headwater way of a high-head hydropower plant. In: Proc 33rd IAHR Congr, Vancouver, Canada, pp 4037–4044
Bowers DG, Braithwaite KM (2012) Evidence that satellites sense the cross-sectional area of suspended particles in shelf seas and estuaries better than their mass. Geo-Mar Lett 32(2):165–171. doi:10.1007/ s00367-011-0259-6
Costa LI, Storti G, Lüscher B, Gruber P, Staubli T (2012) Influence of solid particle parameters on the sound speed and attenuation of pulses in ADM. J Hydrol Eng 17(10):1084–1092. doi:10.1061/ (ASCE)HE.1943-5584.0000555
Felix D, Albayrak I, Abgottspon A, Boes RM, Gruber P (2012) Suspended sediment and Pelton turbine wear monitoring:
experimental investigation of various optical and acoustic devices and beginning of the case study at HPP Fieschertal. In: Proc 17th Int Seminar Hydropower Plants, Vienna, Austria, pp 483–494
Felix D, Albayrak I, Boes RM (2013) Monitoring of suspended sediment - laboratory tests and case study in the Swiss Alps. In: Fukuoka S, Nakagawa H, Sumi T, Zhang H (eds) Advances in river sediment research. Taylor & Francis Group, London, pp 1757–1766
Fettweis M, Baeye M, Lee BJ, Chen P, Yu JCS (2012) Hydro-meteorological influences and multimodal suspended particle size distributions in the Belgian nearshore area (southern North Sea). Geo-Mar Lett 32(2):123–137. doi: 10.1007/s00367-011-0266-7
Haun S, Kjærås H, Løvfall S, Olsen NRB (2013) Three-dimensional measurements and numerical modelling of suspended sediments in a hydropower reservoir. J Hydrol 479:180–188. doi:10.1016/j. jhydrol.2012.11.060
Konert M, Vandenberghe J (1997) Comparison of laser grain size analysis with pipette and sieve analysis: a solution for the underestimation of the clay fraction. Sedimentology 44:523–535. doi: 10.1046/j.1365-3091.1997.d01-38.x
Nichols G (2009) Sedimentology and stratigraphy, 2nd edn. Wiley-Blackwell, Chichester
Sequoia (2008) LISST concentration limits. Article dated 29 August 2008, accessed 27 September 2013. Sequoia Scientific, Inc, Bellevue, WA, http://www.sequoiasci.com/article/lisst-concentration-limits/
Sequoia (2011) LISST bin sizes for inversions based on randomly shaped grains. Article dated 18 March 2011, accessed 27 September 2013. Sequoia Scientific, Inc, Bellevue, WA,http://www.sequoiasci.com/ article/lisst-bin-sizes-for-inversions-based-on-randomly-shaped-grains/
Skripalle J, Hies T, Liu Y, Nguyen HH (2012) Application of multi-frequency acoustics to estimate concentration of suspended sedi-ments from Jurong Lake, Singapore. In: Proc 17th Int Seminar Hydropower Plants, Vienna, Austria, pp 725–736
Thorne PD, Agrawal YC, Cacchione DA (2007) A comparison of near-bed acoustic backscatter and laser diffraction measurements of suspended sediments. IEEE J Oceanic Eng 32(1):225–235. doi:10. 1109/JOE.2007.890978
Wren D, Barkdoll B, Kuhnle R, Derrow R (2000) Field techniques for suspended-sediment measurement. J Hydraul Eng 126(2):97–104. doi:10.1061/(ASCE)0733-9429(2000)126:2(97)