HAL Id: hal-00910036
https://hal.univ-cotedazur.fr/hal-00910036
Submitted on 27 Aug 2015HAL is a multi-disciplinary open access archive for the deposit and dissemination of sci-entific research documents, whether they are pub-lished or not. The documents may come from teaching and research institutions in France or abroad, or from public or private research centers.
L’archive ouverte pluridisciplinaire HAL, est destinée au dépôt et à la diffusion de documents scientifiques de niveau recherche, publiés ou non, émanant des établissements d’enseignement et de recherche français ou étrangers, des laboratoires publics ou privés.
boiling
Nadine Kosseifi, Pascal Henry Biwole, Christian Mathis, Germain Rousseaux,
Séverine A.E. Boyer, Harunori Yoshikawa, Thierry Coupez
To cite this version:
Nadine Kosseifi, Pascal Henry Biwole, Christian Mathis, Germain Rousseaux, Séverine A.E. Boyer, et al.. Application of two-color LIF thermometry to nucleate boiling. Journal of Materials Science and Engineering A & B, 2013, 3 (5), pp.281-290. �hal-00910036�
Journal of Materials Science and Engineering B 3 (5) (2013) 281-290
Application of Two-Color LIF Thermometry to Nucleate
Boiling
Nadine Kosseifi1, Pascal Henry Biwole2, Christian Mathis2, Germain Rousseaux3, Séverine Agnès Éliette Boyer4,
Harunori Nakagawa Yoshikawa5 and Thierry Coupez1
1. Center for Material Forming CEMEF, Mines ParisTech, UMR CNRS 7635, Sophia Antipolis 06904, France
2 Laboratory J.A. Dieudonné, University of Nice, Sophia Antipolis, UMR CNRS 6621, P arc Valrose, 06108 Nice, France
3 Axis HydEE, University of Poitiers, Department of Aerodynamics ISAE, ENSMA, UPR CNRS 3346, Institute P Prime, Futuroscope 86962, France
4 Physics and Mechanics of Materials Departement, University of Poitiers, ISAE-ENSMA-UPR CNRS 3346, Institut P Prime, Futuroscope 86961, France
5 Waves and complex Media Laboratory, University of Havre, UMR CNRS 6294, Havre76058, France
Received: January 31, 2013 / Accepted: February 27, 2013 / Published: May 25, 2013.
Abstract: The laser-induced fluorescence (LIF) thermometry is applied to measure the temperature field surrounding a single vapor
bubble growing at an artificial nucleation site. In order to correct measurement errors due to the non-uniformity of the incident laser intensity, the two-color LIF thermometry technique is used in this nucleate boiling experiment. This technique is based on the use of two fluorescent dyes: the temperature sensitive dye Rhodamine B and the temperature insensitive dye Sulforhodamine-101. The concentration of the dyes is optimized by analyzing the behavior of fluorescence intensities. The mapping between the two images is determined through a geometrical calibration procedure. This technique presents a success in correcting the non uniformities due to the reflection of the light at the bubble surface and to the temperature gradient. The obtained temperature fields show that the two-color LIF is a promising technique in the investigation of nucleate boiling.
Key words: Two-color LIF thermometry, stereoscopic camera calibration, nucleate boiling.
Nomenclature
Vα: Pixel values of camera α
Vβ: Pixel values of camera β
cdye, 1 and cdye, 2: Concentrations of the first and second dye
Vα, 0, Vβ,0: Sensor offset values
I0: Incident laser intensity
u = (v, w): Pixel intensity measured at pixel
coordinates
f: Dimensionless focal length [Rij]: Rotation matrix [Ti]: Translation vector (
v
%
,w
%
): Pinhole projection U: Coordinate transformation M: Mapping from uβto uαCorresponding author: Nadine Kosseifi, postdoctoral
researcher in applied mathematics, research fields: two color LIF thermometry, numerical simulation, boiling and quenching. E-mail: [email protected].
Greek letters
θ: Temperature
θe: Temperature of ethanol
θw: Temperature of the wall
θsat: The saturation temperature
λ: Wavelength
1. Introduction
Comprehension of the vapor bubble behavior on a heated surface is primordial to understand the heat transfer during the boiling near the surface. The behavior of a growing bubble has been studied by different numerical methods [1-4]. To validate and improve these simulations, experimental data on both flow and thermal field around the bubble are
DAVID PUBLISHING
required [4, 5].
The laser-induced fluorescence (LIF) thermometry has been applied to several engineering problems, such as combustion studies [6] and heating and cooling system [7, 8]. This technique consists in temperature dependence of emission intensity of fluorescent dye molecules. These molecules are excited by a narrow spectrum of light and emit another spectrum of light with longer wavelengths due to the Stokes shift. The emission of the light source is separated by optical filters; the emission intensity distribution is imaged over an interest area by a digital camera. The sensor pixel values V reflects the temperature field.
First experimental LIF protocols used one single dye [9]. But during the recent years, different LIF techniques have been developed. Lavieille [10] presented a method where one single sensitive dye (Rhodamine B) is used with two or three separated color bands. When using one single dye with three spectral color bands, the advantage of this method is that the ratios of the emission of each band determine the temperature while correcting the effects of fluorescent re-absorption [11]; however this method is not suitable for evaporating problem [12]. Sakakibara [13] and Kim [14] described another LIF method, known as two-dyes LIF where two fluorescent dyes (temperature sensitive and temperature insensitive) are
used with two synchronized cameras (camera α and
camera β). When using this technique, the
measurement errors due to the non-uniformity of the incident laser intensity are eliminated.
During boiling, a steep temperature gradient exists near the heating wall. This thermal gradient is accompanied by an optical index variation. The incident laser light is then nonuniform near the wall. Furthermore, the reflection of the light at vapor bubble surface also contributes to non-uniformity. Therefore, the use of two dyes is essential to avoid the measurement errors due to theses non-uniformities and to get an accurate measurement of the temperature field in nucleate boiling problem. The two-color LIF
thermometry technique has been applied to the thermal transport at microscale [15], to the thermal plume [16] and to the plane impinging jet [17] but not to the nucleate boiling problem.
In the present work, a methodology to measure the temperature field around a vapor bubble by the two-color LIF thermometry is performed. This optical technique offers a non-intrusive temperature measurement with high spatial resolution, different from the pointwise measurement of thermocouples [18]. A brief review of the principle of two-color LIF thermometry is presented in Section 2. In Section 3, the experimental apparatus is introduced. It includes a heating system, a thermal control system and an optical system. The camera calibration procedure and the image mapping are then presented in Sections 4 and 5, respectively. After explaining the choice of the dyes’ concentration and the temperature calibration in section 6, a measurement of temperature field surrounding a vapor bubble is presented and discussed. Conclusions with perspectives are given in the last section.
2. Principle of Two Color LIF Thermometry
The two color LIF technique consists in using two dyes, one temperature sensitive and the other insensitive. Two cameras are used, α and β, equipped with optical filters with different ranges of wavelength. The pixel values Vα and Vβ corresponding to a physical point (x, y) of cameras α and β, respectively, are given by:
( )
( )
)
(
1 ,1 2 ,2 0( , ) α,0 α a θ c a θ c I x y V V = dye + dye + (1)( )
( )
(
1 ,1 2 ,2)
0( , ) β,0 β b θ c b θ c I x y V V = dye + dye + (2)where, cdye, 1 and cdye, 2 are the concentrations of the
first and second dyes, respectively. The constants Vα, 0
and Vβ, 0 are the sensor offset values. The coefficients
a1, a2, b1 and b2 are functions of the temperature θ and
of the optical configuration of the experimental setup. They are independent from the incident laser intensity I0. Taking the ratio of Vα and Vβ after subtracting the
Application of Two-Color LIF Thermometry to Nucleate Boiling 283 obtained:
( )
( )
( )
( )
( )
2 , 2 1 , 1 2 , 2 1 , 1 0 , 0 , dye dye dye dye c b c b c a c a V V V V F θ θ θ θ θ β β α α + + = − − = (3)Once thisF-function is known, the temperature field can be given by:
⎟ ⎟ ⎠ ⎞ ⎜ ⎜ ⎝ ⎛ − − = − 0 , 0 , 1 β β α α θ V V V V F (4)
A wide library of dyes exists in the literature. Natrajan & Christensen [15] reported success in combining Rhodamine B as a temperature sensitive dye with Sulforhodamine-101 as a temperature insensitive dye. In the present work, the same dyes are selected, Rhodamine B (RhB, Dye content 99%; VWR-France) and Sulforhodamine-101 (SR101, Dye content 95%; Sigma-Aldrich-USA), to measure the temperature in nucleate boiling problem. Since these experimental investigations are performed at a relatively high temperature (60-80 °C), the application of the two-color LIF thermometry technique is quite challenging because the dye fluorescence intensity must be visible at these temperatures.
3. Setup
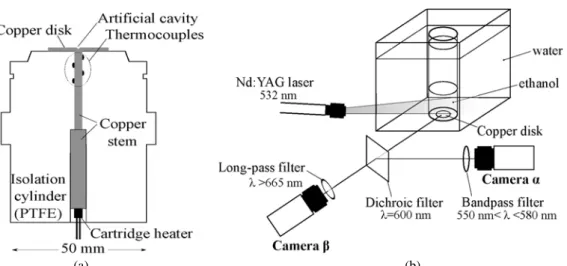
A heating system similar to those developed by Siedel, et al. [19] and Kowaleski, et al. [20] was especially designed to generate isolated vapor bubbles. The designs of the optical cell, the longitudinal section of the heating element and the general view of the device are presented in Figs. 1a and 1b. Heat generated by a cartridge heater (6 mm in diameter and 48 mm in length) is transmitted to a horizontal circular copper disk through a copper stem. The copper disk is 20 mm in diameter and 0.2 mm in thickness. The temperature is monitored with four K-type thermocouples (chromel-alumel, Tc Direct-France) at distances, 17 mm, 12 mm, 7 mm and 2 mm from the disk (Fig. 1a). The temperature of the heater is controlled with the use of a PID. The bubbles are nucleated at an artificial cavity made at the center of the copper disk. The cavity has a mouth diameter of 0.2 mm.
The whole heating system is integrated to a vertically installed cylindrical glass container with the copper disk facing up. The container has an inner diameter of 50 mm and is filled partially by a test liquid (Fig. 1b). Ethanol (96% Vol; VWR-France) is chosen as the test liquid because of its low boiling
temperature (θ = 78.4 °C) at atmospheric pressure.
Typical ethanol volume of 100 mL is considered. The container is immersed in an outer square tank 170 ×
170 × 210 mm3 which is filled by water circulating
from and to a thermostatic bath. This tank serves to condition the ambient temperature and correct optical distortion due to the curvature of the cylindrical
container. The temperature of ethanol, θe, and the
temperature of water, θw, are monitored by K-type
thermocouples. Fluctuation in these temperatures during an experiment is typically 0.1 °C. The difference θe − θw is typically -0.3 °C without heating the copper disk and is around 1 °C when heating it.
The illumination source is a double cavity Nd:YAG laser from Litron Laser with a pulse energy about 100 mJ per pulse during 8 ns and a wavelength of 532 nm. The dyes are excited by a 0.5 mm-thick vertical laser sheet that passes exactly over the artificial cavity (Fig. 1b). In the current paper, the mean thermal field is obtained over a small area near the bubble. The fluorescence of each dye is separated by a dichroic
filter with a transition wavelength λ = 600 nm, size
(50 × 50 × 2) mm3. The fluorescence signal of each
dye is captured by two identical CCD cameras (Image Pro X from Lavision) recording images at 14 Hz.
These cameras, cameraα and camera β , are both
equipped with filters (size of 50 mm diameter). A band-pass filter of 550 nm < λ < 580 mm is fixed on
camera α to observe the emission of RhB and a
long-pass filter of λ > 665 nm is fixed on camera β to observe the emission of SR101. All filters are
provided by Chroma Technology Corp, USA. The
focal length of the lens is 200 mm, a shorter
focal length can not be used because of the equipment size.
(a) (b)
Fig. 1 Details of the developed experimental setup. (a) Longitudinal section of the heating element and (b) device configuration.
4. Camera Calibration
In the two-color LIF thermometry, the pixel intensity measured at pixel coordinates uα = (vα, wα)
on a cameraα ’s image is divided by the pixel
intensity at uβ = (vβ, wβ) on a camera β’s image (Eq. (3)). This division is performed for all pairs of uα and
uβ that point to the same physical point. The mapping
from uβ to uα (or, inverse) should be known accurately. This mapping is determined through a geometrical camera calibration procedure, which gives intrinsic and extrinsic parameters of both cameras.
The calibration is performed with the camera Calibration Toolbox for Matlab [21], which does not require a full 3D calibration object but a 2D planar checkerboard, moved on several locations. The adopted estimations for planar homographies and for maximum likelihood are those in Ref. [22]. The closed-form estimation of camera intrinsic parameters uses explicitly the orthogonality of vanishing points. Tangential distortion coefficients are also taken into account by following the camera model in Ref. [23]. The outputs of the calibration include: dimensionless focal lengths f1 and f2 measured in the horizontal and
vertical sizes of a sensor element, respectively; the skew coefficients k1, k2 and k5 represent the image
radial distortion and k3, k4 represent the tangential one;
the rotation matrix ⎥Rij⎥ and translation vector [Ti]
give the transformation from a real world coordinate system to a 3D camera’s coordinate system. In our application, the plane Z = 0 is considered coincident with the plane of the laser sheet. The calibration target is a checkerboard patterns with squares of 2 mm.
The spatial resolution is 0.026 mm/pix for camera
α’s image and 0.024 mm/pix for camera β’s image.
By comparing the image of camera α to the mapped
image of camera β, the accuracy of the mapping is
estimated to 0.05 mm.
5. Image Mapping
For a given real world coordinates (X, Y, 0) on the laser sheet, the coordinates (x, y, z) in a camera’s reference frame [23] are:
) 5 ( 0 3 2 1 33 32 31 23 22 21 13 12 11 ⎥ ⎥ ⎥ ⎦ ⎤ ⎢ ⎢ ⎢ ⎣ ⎡ + ⎥ ⎥ ⎥ ⎦ ⎤ ⎢ ⎢ ⎢ ⎣ ⎡ ⎥ ⎥ ⎥ ⎦ ⎤ ⎢ ⎢ ⎢ ⎣ ⎡ = ⎥ ⎥ ⎥ ⎦ ⎤ ⎢ ⎢ ⎢ ⎣ ⎡ T T T Y X R R R R R R R R R z y x
The pinhole projection (~v,w~) of this point on the camera’s image plane reads:
11 12 1 31 32 3
R X
R Y
T
x
v
z
R X
R Y
T
+
+
= =
+
+
%
(6) 21 22 2 31 32 3R X
R Y
T
y
w
z
R X
R Y
T
+
+
= =
+
+
%
(7)Application of Two-Color LIF Thermometry to Nucleate Boiling
285
coordinates, which are expected to be the pixel coordinates of (v, w) on a captured image, are then given by:
(
)
(
)
2 4 6 1 1 2 5 2 2 3 4 0 1 2 2 v f v k r k r k r k vw k r v v ⎡ = ⎣ + + + ⎤ + + + ⎦+ % % % % % % % % (8)(
)
(
)
2 4 6 2 1 2 5 2 2 3 4 0 1 2 2 w f w k r k r k r k r w k vw w ⎡ = ⎣ + + + ⎤ + + + ⎦+ % % % % % % % % (9)where, (v0,w0)are the coordinates of the principal point and ~r = ~v2+w~2.
For each camera, applications of Eqs. (5)-(9) define a coordinate transformation U: u = U(X, Y) from real world coordinates to pixel coordinates. The mapping
Mfrom uβ to uα is determined by combining U and
its inverse U-1. The inverse transformation U−1is
found as follows:
(1) The coordinates ~ uv( ) and w~ u( ) are obtained by inverting Eqs. (8)-(9);
(2) The real world coordinates are obtained by substituting v~ and w~ in Eqs. (6)-(7).
Applying the obtained U-1 to cameraβ , the real
world coordinates corresponds to (X, Y)U-1(Uβ). The
pixel coordinates uαviewing the same point is given
by uα = U(X, Y). Hence, uαand uβare related by the
relationship uα = U(U-1(uβ)). The mapping M is
obtained by computing uα for all the pixel points uβ
belonging to the image region of interest.
6. Concentration Optimization and
Temperature Calibration
The coefficients of the concentrations in Eq. (3) depend on the parameters of the optical system. In order to decide an optimal combination of the two concentrations cRhB and cSR101, respectively, an analyze
of the cameras output voltages responses as a function of the dyes’ concentrations is achieved.
Fig. 2 presents averaged intensities Vαand Vβ for different values of cRhB. The solution does not contain
SR101. The averaging is performed over an area of (230 × 630) pix2
above the copper disk. The intensity Vα increases linearly with the concentration unti cRhB =
0.5 mg/L. A decrease seen for cRhB > 1 mg/L might be
explained by the absorption of the emitted light over
the optical path in the solution. The intensity Vβ is
much lower than Vα, as expected (Fig. 2).
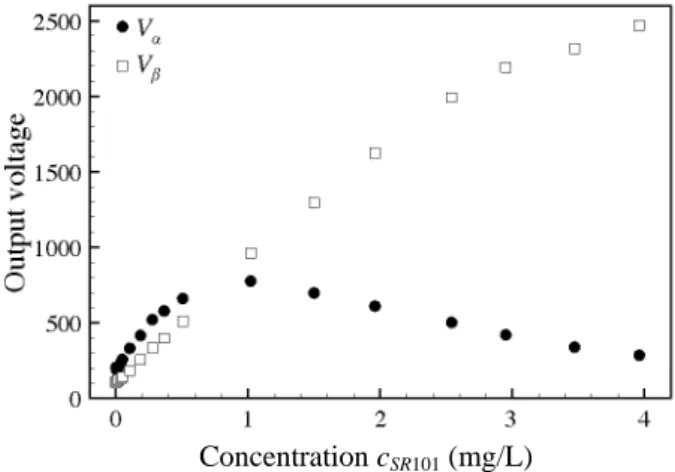
Fig. 3 presents results of a similar experiment obtained by varying cSR101and without adding any RhB to the solution. At low concentrations, both intensities are of the same order of magnitude and behave linearly until cSR101 = 0.5 mg/L. Distinction of these intensities
becomes significant for cSR101 > 1 mg/L.
A simple application of the two-color LIF
thermometry requires linear behavior to Vα and Vβ.
Therefore, both concentrations should be lower than 0.4 mg/L. Moreover to get accurate results, the measured intensities should be larger than the level of the noise produced by the cameras’ sensors. Our
Fig. 2 camera pixel intensities Vα and Vβ for different concentrations of RhB in ethanol at θe = 40 °C.
Fig. 3 Camera pixel intensities Vα and Vβ for different concentrations of SR101 in ethanol at θe = 40 °C.
Concentration cSR101 (mg/L) Concentration cRhB (mg/L)
cameras’ sensors have the same offset Vα = Vβ= 101
with a Gaussian noise centered around 30. In the
purpose to maximize the sensitivity of theF-function
to the temperature (∂F/∂θ) and to respect the above
requirements, these concentrations cRhB = 0.1 mg/L and
and cSR101 = 0.1 mg/L have been considered in the
following work.
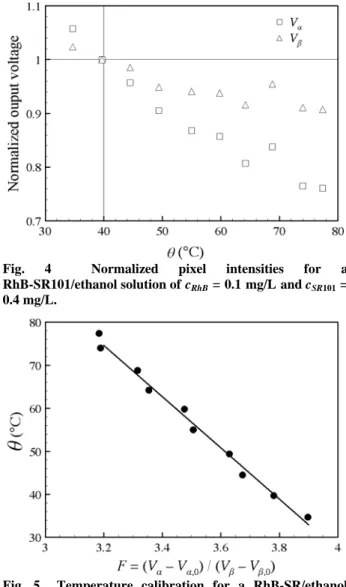
The intensities Vα and Vβ observed for these
concentrations are shown in Fig. 4 for a temperature range 30 °C < θ < 74 °C, in intervals of 5 °C. The values of the intensities are normalized by their values
at 40 °C (1,415 and 423 for cameras α and β,
respectively). It can be noted that both dyes remain visible at the ethanol boiling temperature (θsat = 78.4 °C). Thus both dyes are well suited to be used in
nucleate boiling investigation. The intensity Vα
decreases by 0.7%/°C, while Vβ decreases with a
smaller rate 0.2%/°C. By comparing Figs. 2 and 3, one can notice that the observed fluorescence of RhB is higher than that of SR101. As it can be observed in Fig. 2, the RhB emission is not effectively blocked by
the filters of camera β. For these reasons the output
voltage Vβ is significantly influenced by the RhB
emission and the decrease in the intensity of camera β, presented in Fig. 4, is then due to the contribution of the
RhB fluorescence to Vβ. Measurement error due to the
sensor noise, associated to camera β and camera α at
θe = 40 °C, are estimated as 30/423 and 30/1415, i.e.,
7% and 2%, respectively.
Fig. 5 shows the result of the temperature calibration for this solution, where Vα, 0 and Vβ, 0
represent the offsets values (Eq. (3)). For computing θ from a given value of F, this linear relation is adopted:
θ = -59.5F + 265.0 (°C) (10) The sensitivity of theF-function to the temperature is -0.5%/°C. The standard deviation of the temperature data from the calibration (Eq. (10)) is 1.4 °C. Once this calibration is made the re-absorption of the RhB emissions along the imaging path will be taken into account by the system itself.
7. Results and Discussion
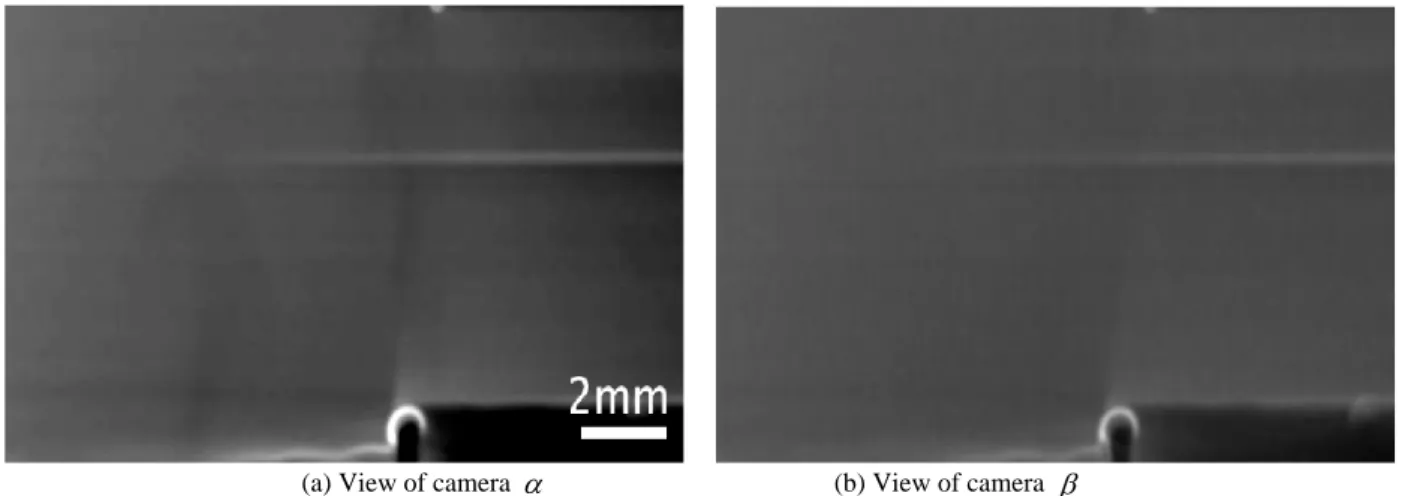
Fig. 6 shows images of a vapor bubble. The view of
camera β has already been mapped onto the image
plane of cameraα . The bubble has a diameter of
around 1 mm and grows at the artificial nucleation site in ethanol of θe = 40 °C (i.e., the subcooling Δθsub = θe
− θsat = 17.2 °C). In Fig. 6a, hot plumes rising from
the disk surface and from the bubble are seen as darker zones, while these hot plumes are not distinguished in Fig. 6b. In both images, a dark band at the right of the bubble (bubble’s shadow) and a luminous contour above the bubble can be noticed as presented in Fig. 7. Since the laser sheet enters the
Fig. 4 Normalized pixel intensities for a RhB-SR101/ethanol solution of cRhB = 0.1 mg/L and cSR101 =
0.4 mg/L.
Fig. 5 Temperature calibration for a RhB-SR/ethanol solution of cRhB = 0.1 mg/L and cSR101 = 0.4 mg/L. The
Application of Two-Color LIF Thermometry to Nucleate Boiling
287
(a) View of camera α (b) View of camera β
Fig. 6 A vapor bubble growing on an artificial nucleation site in ethanol at θe = 61.2 °C.
Fig. 7 Close up on the bubble vicinity of Fig. 6a.
measurement area from the left to the right (Fig. 1b), then the bubble’s shadow appears in both Figs. 6a and 6b. The luminous contour above the bubble is due to the laser reflection at the bubble surface.
Furthermore, horizontal luminous and dark lines, results of optical imperfection of the setup are also seen in both images. Roughness on the inner and outer tanks’ lateral walls can produce such inhomogeneity.
Local fluctuation of θe and θw could also lead to
non-uniform lighting. These non-uniformities are inevitable or difficult to remove in boiling experiments.
The use of a single-color LIF thermometry may give erroneous thermal field and the use of the two color LIF thermometry technique is recommended.
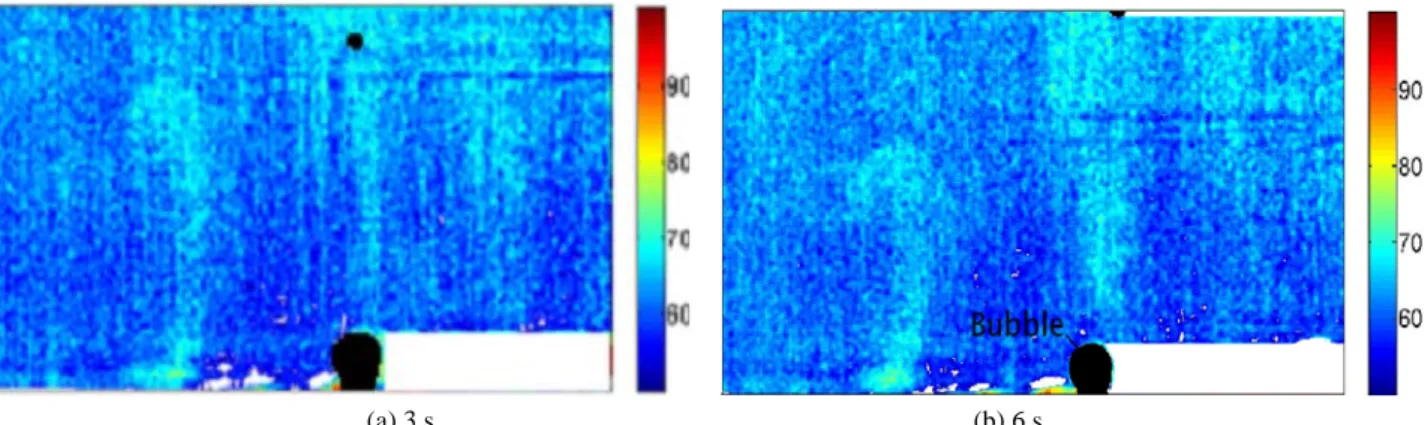
Fig. 8 shows a temperature field at different time steps, it was determined by calculating and converting the F-function. The conversion was achieved by the temperature calibration (Eq. (10)). The ethanol
spinodal limit is 164 °C [24], to better illustrate the temperature field the zones with unphysical temperatures (either lower than 50 °C or higher than
100 °C) are uncolored. At the right of the bubble
(shadow zone), the temperature is not determined due to the low intensities of the dyes. Other uncolored zones are found above the copper disk along the wavy luminous curve seen in Fig. 7. These uncolored zones can be due to the insufficient accuracy of the mapping. In fact, the error of our mapping (0.05 mm) is equivalent to half the thickness of the wavy curve. In order to eliminate lighting non-uniformity of such a meso scale, more accuracy mapping would be required.
Except those small zones, the temperature field is successfully obtained over the whole interest area. The bulk liquid temperature is around 60 °C and it is in good agreement with the thermocouples’ measurements. The hot plumes are seen as higher temperature zones of 70-73 °C. The luminous contour above the bubble due to the reflection of the light at the bubble surface is successfully corrected. The success in correcting these non-uniformities and in measuring the temperature underlines the significance of the two-color LIF thermometry in boiling experiments.
8. Summary and Perspectives
(a) 3 s (b) 6 s
Fig. 8 Temperature field in the vicinity of a vapour bubble growing on an artificial nucleation site in ethanol of θe = 6.12 °C,
(a) 3 s and (b) 6 s.
thermometry to nucleate boiling investigation is presented. The camera calibration procedure with an accurate image mapping between the two cameras is required for calculating the F-function (Eq. (3)). Two dyes are used, the Rhodamine B and the Sulforhodamine-101, respectively. The optimization of both dyes’ concentrations is discussed by observing
the fluorescence intensity in ethanol at θe = 40 °C
within a wide range of concentration up to 4 mg/L (Figs. 2 and 3). The temperature calibration (Eq. (10)) for a solution of 0.1 mg/L of Rhodamine B and 0.4 mg/L of Sulforhodamine-101 shows a sensitivity of
-0.5%/°C for the F -function. This sensitivity is
comparable with the sensitivity obtained by Natrajan & Christensen [15] over the temperature range 10 °C < θ < 44 °C (-1.5%/°C).
The temperature field around a vapor bubble in nucleate boiling is successfully obtained with corrections to inevitable inhomogeneous lighting associated with the temperature gradient and the reflection at the bubble surface. This result suggests that the two color LIF thermometry is a promising method for measuring the thermal field in boiling.
To improve the temperature correction, an accurate two-camera image mapping is necessary. This improvement can be performed by increasing the optical magnification. The temperature sensitivity of
the F-function can be also improved by optimizing
the configuration of optical elements and the dyes’
concentrations. The thickness of the laser sheet
is of the same order as the bubble radius,
therefore on going work consists in increasing the bubble size.
At the current stage, the application of two color LIF technique should not be limited to the case studied herein. In an additional future work, this new experimental investigation should be used to validate the numerical approach, based on finite element method (FEM) and computational fluid dynamic (CFD) [25, 26]. This new experimentation would be also used to optimize the heat transfer due to boiling in industrial quenching process [4]. A great advantage should be realized by synchronizing the two-color laser-induced fluorescent thermometry (LIF) with the particle image velocimetry (PIV) [27, 28], to acquire a two-dimensional map of both the temperature and the velocity fields during nucleate boiling.
Acknowledgments
The authors present their acknowledgments to the companies involved in the THOST (Thermal Optimisation System) project managed by Science Computer and Consultants (SCC). The authors are also sincerely grateful to Lionel Freire and Francis Fournier for the help provided during the experimental work and to the student Victor Fronzi for his contribution in the experimental investigations.
Application of Two-Color LIF Thermometry to Nucleate Boiling
289
References
[1] A.J. Robinson, R.L. Judd, Bubble growth in a uniform and spatially distributed temperature field, International Journal of Heat and Mass Transfer 44 (2001) 2699-2710. [2] Y. Chen, M. Groll, Dynamics and shape of bubbles on
heating surfaces: A simulation study, International Journal of Heat and Mass Transfer 49 (2006) 1115-1128. [3] Y. Fujita, Q. Bai, Numerical simulation of the growth of
an isolated bubble in nucleate boiling, in: 11th International Heat Transfer Conference, 1998, pp. 422-437.
[4] N. Kosseifi, Numerical Simulation of Boiling for Industrial Quenching Processes, Ph.D., Thesis, Ecole Nationale Supérieure des Mines de Paris, CEMEF, France, 2012.
[5] T.A. Kowalewski, J. Pakleza, R. Trzcinski, A. Zachara, Experimental analysis of vapour bubble growing on a heated surface, Archives of Thermodynamics 25 (2004) 1-12.
[6] N. Omenetto, P. Benetti, G. Rossi, Flame temperature measurements by means of atomic fluorescence spectrometry, Spectrochimica Acta Part B: Atomic Spectroscopy 27 (1972) 453-461.
[7] L. Shi, X. Mao, A.J. Jaworski. Application of planar laser-induced fluorescence measurement techniques to study the heat transfer characteristics of parallel-plate heat exchangers in thermoacoustic devices, Measurement Science and Technology 21 (2010) 115405-115421. [8] F. Guillard, R. Fritzon, J. Revstedt, C. Tragårdh, M.
Aldén, L. Fuchs, Mixing in a confined turbulent impinging jet using planar laser-induced fluorescence, Experiments in Fluids 25 (1998) 143-150.
[9] D. Ross, M. Gaitan, L.E. Locascio, Temperature measurement in microfluidic systems using a temperature-dependent fluorescent dye, Anal Chem. 73 (2001) 4117-4123.
[10] P. Lavieille, A. Delconte, D. Blondel, M. Lebouché, F. Lemoine, Non-intrusive temperature measurements using three color laser induced fluorescence, Experiments in Fluids 36 (2004) 706-716.
[11] A. Petracci, R. Delfos, J. Westerweel, Combined piv/lif measurements in a rayleigh-bnard convection cell, in: 13th International Symposium on Applications of Laser Techniques to Fluid Mechanics, Lisbon 2006, paper 1221, http://ltces.dem.ist.utl.pt/lxlaser/lxlaser2006/downloads/p apers/18_3.pdf
[12] P. Lavieille, F. Lemoine, G. Lavergne, M. Lebouché,
Evaporating and combusting droplet temperature measurements using two-color laser-induced fluorescence, Experiments in Fluids 31 (2001) 45-55.
[13] J. Sakakibara, R.J. Adrian, Whole field measurement of temperature in water using two-color laser induced fluorescence, Experiments in Fluids 26 (1999) 7-15. [14] H.J. Kim, K.D. Kihm, J.S. Allen, Examination of
ratiometric laser induced fluorescence thermometry for microscale spatial measurement resolution, Heat and Mass Transfer 46 (2003) 3967-3974.
[15] V.K. Natrajan, K.T. Christensen, Two-color laser-induced fluorescent thermometry for microfluidic systems, Measurement Science and Technology 20 (2009) 015401-015412.
[16] J. Coppeta C. Rogers, Dual emission laser induced fluorescence for direct planar scalar behavior measurements, Experiments in Fluids 25 (1998) 1-15. [17] K. Hishida, J. Sakakibara, Combined planar laser-induced
fluorescenceparticle image velocimetry technique for velocity and temperature fields, Experiments in Fluids 29 (2001) 129-140.
[18] W. Gabler, R. Honig, R. Lachner, F. Mayinger, G. Kappler, Spectroscopic techniques for ram-combustors, in: Proceeding of 2nd Space Course, Munich, 1993, pp. 1-60.
[19] S. Siedel, S. Cioulachtjian, J. Bonjour, Experimental analysis of bubble growth, departure and interactions during pool boiling on artificial nucleation sites, Experimental Thermal and Fluid Science 32 (2008) 1504-1511.
[20] T.A. Kowalewski, J. Pakleza, A. Cybulski, Particle image velocimetry for vapour bubble growth analysis, In Proc. 8th International Conference Laser Anemometry Advanced and Applications, Rome, 1999, pp. 243-250. [21] J.Y. Bouguet, Camera calibration toolbox for matlab,
Home Page, http://www.vision.caltech.edu/bouguetj/calib doc/, (accessed 2010).
[22] Z. Zhang, Flexible camera calibration by viewing a plane from unknown orientations, in: Proc. International Conference on Computer Vision, Corfu, Greece, 1999. [23] J. Heikkila, O. Silvén, A four-step camera calibration
procedure with implicit image correction, in: Proc. IEEE Computer Society Conference on Computer Vision and Pattern Recognition, San Juan, Puerto Rico, 1997, pp. 1106-1112.
[24] V.P. Carey, Liquid-Vapor Phase-Change Phenomena, Taylor & Francis, Bristol, PA. 1992, pp. 158-163. [25] E. Hachem, H. Digonnet, N. Kosseifi, E. Massoni, T.
Coupez, Enriched finite element spaces for transient conduction heat transfer, Applied Mathematics and Computation 217 (2010) 3929-3943.
[26] N. Kosseifi, E. Hachem, L. Silva, S.A.E. Boyer, E. Massoni, T. Coupez, Numerical simulation of boiling during the quenching process, 10 ème colloque national en calcul des structures, http://hal.archives ouvertes.fr/hal-00592676/fr/, Giens, France. (accessed 2011).
[27] T.R. Meyer, G.J. Fiechtner, S.P. Gogineni, J.C. Rolon,
C.D. Carter, J.R. Gord, Simultaneous plif/piv investigation of vortex-induced annular extinction in h2-air counter flow diffusion flames, Experiments in Fluids 36 (2004) 259-267.
[28] B.J. Balakumar, G.C. Orlicz, C.D. Tomkins, K.P. Prestridge, Simultaneous particle-image velocimetryplanar laserinduced fluorescence measurements of Richtmyer-Meshkov instability growth in a gas curtain with and without reshock, Physics of Fluids 20 (2008) 124103-124116.