HAL Id: hal-01475755
https://hal.archives-ouvertes.fr/hal-01475755
Submitted on 24 Feb 2017
HAL is a multi-disciplinary open access
archive for the deposit and dissemination of
sci-entific research documents, whether they are
pub-lished or not. The documents may come from
teaching and research institutions in France or
L’archive ouverte pluridisciplinaire HAL, est
destinée au dépôt et à la diffusion de documents
scientifiques de niveau recherche, publiés ou non,
émanant des établissements d’enseignement et de
recherche français ou étrangers, des laboratoires
DPW-6: Drag Analyses and Increments Using Different
Geometries of the Common Research Model Airliner
David Hue, Quentin Chanzy, Sam Landier
To cite this version:
David Hue, Quentin Chanzy, Sam Landier. DPW-6: Drag Analyses and Increments Using Different
Geometries of the Common Research Model Airliner. Journal of Aircraft, American Institute of
Aeronautics and Astronautics, 2017, �10.2514/1.C034139�. �hal-01475755�
DPW-6: Drag Analyses and Increments
Using Different Geometries of the CRM Airliner
David Hue1, Quentin Chanzy2, Sâm Landier3
ONERA, the French Aerospace Lab, 92190 Meudon, France
This article describes the CFD studies carried out at ONERA in the framework of the 6th AIAA Drag Prediction Workshop. Different configurations of the well-known Common Research Model have been used to perform drag analyses and increment assessments. The structured Overset grids provided by Boeing to the DPW community have been pre-processed with the in-house software Cassiopee: CGNS conversion, cell blanking and overlapping issues have been handled before running these grids with the RANS solver elsA and the far-field code ffd72. Contrary to the original CRM configuration used in DPW-5, the wing shape is now based on wind tunnel aero-elastic measurements: through a grid convergence process, a 4 count drag increment between new and former Wing-Body geometries has been quantified, which is very consistent with the results published by Hue in 2014. Then, a CRM configuration including a through flow Nacelle-Pylon installation has been computed: the corresponding drag increment of about 22 counts is in very close agreement with the NASA experimental data. Finally, horizontal and vertical tails have been added to the Wing-Body-Nacelle-Pylon geometry so that the aerodynamic performance of such a complete cruise configuration can be assessed. Numerical considerations involving the SA-QCR2000 turbulence model are highlighted.
Nomenclature
Alpha = angle of attack
AR = aspect ratio
b = wing span c = wing chord
CDf = friction drag coefficient
CDff = far-field drag coefficient
CDi = lift-induced drag coefficient
CDnf = near-field drag coefficient
CDp = pressure drag coefficient
CDsp = spurious drag coefficient
CDv = viscous drag coefficient
CDvp = viscous pressure drag coefficient
CDw = wave drag coefficient
Cf = skin friction coefficient
CL = lift coefficient
CM = pitching moment coefficient
Cp = pressure coefficient
h = grid factor
Ma = Mach number
Re = Reynolds number
Sref = reference surface area
u, v, w = x, y, z velocity components
Y+ = normalized first cell height
η = fraction of wing span
∞ = subscript for freestream state value
I.
Introduction
NITIATED in the early 2000s, the Drag Prediction Workshop (DPW) [1] series is aimed at assessing the existing Computational Fluid Dynamics (CFD) codes and modeling techniques used for aircraft aerodynamic performance prediction.
In 2016, the Applied Aerodynamics Department of ONERA participated in the 6th edition of DPW as it did in DPW-2, DPW-4 [2], and DPW-5 [3]. For this workshop, the geometry of the Common Research Model (CRM) [4], which was the reference airliner configuration of DPW-4 and DPW-5, has been modified to ensure that the numerical wing shape matches the aero-elastic twist and bending values which were measured in wind tunnels. This has been done for the design point (lift coefficient of 0.5), which corresponds to the studies presented by Rivers [5] and Hue [6], but also for angles of attack from 2.50 to 4.00 degrees, resulting in different wing geometries. Besides, in order to evaluate the CFD accuracy for a Through Flow Nacelle (TFN) and Pylon drag increment, an additional CRM geometry has been proposed: the so-called Wing-Body-Nacelle-Pylon configuration. Furthermore, in this article, to go further in the idea of making the CRM closer to a real airplane, the horizontal and vertical tails presented in [7] have been added so that the performance of such a complete cruise configuration can be estimated.
The paper is organized as follows: first, the different CRM geometries mentioned above will be presented with more details. Then, the structured Overset grids which have been used for the computations as well as the necessary blanking and overlapping processes will be described. The Navier-Stokes solver and the far-field drag code involved in this study will be briefly introduced. The use of the SA-QCR2000 turbulence model [8] will be addressed. Afterward, the results including grid convergences at design point, angle of attack sweep, drag increments, local and far-field analyses, will be shown for the more and more complex Wing-Body (WB), Wing-Body-Nacelle-Pylon (WBNP), and complete configurations.
II.
CRM Geometries and Grids
A. CRM Geometries
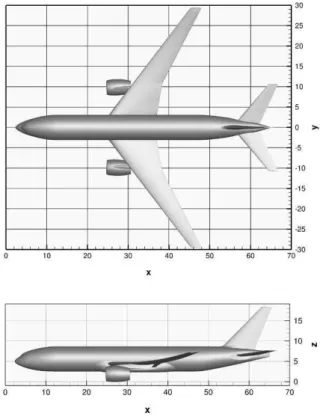
In the framework of DPW-6, the Wing-Body configuration of the CRM is first considered. Main subject of the DPW series since DPW-4, this open geometry was designed by an AIAA Technical Working Group [4]. It exhibits the following characteristics: conventional low wing configuration, design Mach number of 0.85, fuselage representative of a wide body commercial aircraft. This configuration can be completed by a Nacelle-Pylon installation (TFN): it corresponds to the Wing-Body-Nacelle-Pylon configuration which is the special interest of the recent workshop. Furthermore, in this article, another geometry will be considered: it includes the common Horizontal Tail Plane (HTP) used in DPW-4 but also a Vertical Tail Plane (VTP). The latter has been designed by ONERA in 2014 and then presented in [7]. Indeed, the CRM has been chosen to be a reference model for the ONERA-S1 wind tunnel: in this context, a VTP geometry was needed. The corresponding CAD file is available on the NASA website dedicated to CRM issues [9]. The complete configuration is shown in Fig. 1.
Fig. 1 CRM complete configuration.
The reference geometry is defined by mean-aerodynamic chord c = 7.00532 m, reference surface area Sref = 383.68956 m2 (full-model), semispan b/2 = 29.38145 m, aspect ratio AR = 9.0, and moment center Xref = 33.67786 m, Yref = 0.0 m, and Zref = 4.51993 m.
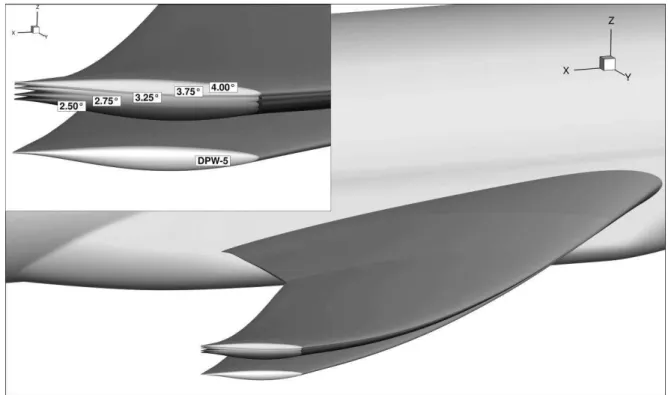
As mentioned in the introduction, the CRM wing geometry has been modified since the last workshop. The original DPW-5 wing geometry did not match the experimental shape neither in twist nor in bending. A step to achieve a better comparison has been proposed by Rivers [5] and Hue [6]: the initial DPW-5 grids have been deformed to match the twist value at design point measured by NASA in the National Transonic Facility (NTF). For DPW-6, the twist and bending data obtained during a CRM campaign in the European Transonic Wind tunnel (ETW) have been used to generate wing geometries corresponding to different angles of attack from 2.50 to 4.00 deg as shown in Fig. 2. The impact of such geometry modifications will be addressed in Part IV.
Fig. 2 CRM wing shapes at different angles of attack.
B. Boeing Overset Grids
To perform the necessary RANS computations, the meshes named "Overset grids Boeing Serrano.REV00" [1] have been used. These structured Overset grids were supplied by the DPW Committee, they exhibit different refinement levels for both WB and WBNP configurations. In Table 1 are presented the characteristics of the grids that are used in this article for purposes of increment evaluation via grid convergence studies. In these grids, the wing geometry is the one corresponding to an experimental angle of attack of 2.75 deg and a lift coefficient of 0.5 and is therefore referenced as 2p75. For the WB configuration, additional medium grids describe the appropriate wing geometries for four increasing angles of attack (2p50, 3p25, 3p75, 4p00).
Table 1 Overset grids Boeing Serrano.REV00 2p75 Wing-Body
2p75
Wing-Body-Nacelle-Pylon 2p75
n° Level millions of points (N) Average Y+ millions of points (N) Average Y+
1 Tiny 7.4 0.78 - -
2 Coarse 14.4 0.59 23.0 0.60
3 Medium 24.7 0.51 39.5 0.50
4 Fine 39.1 0.44 62.6 0.42
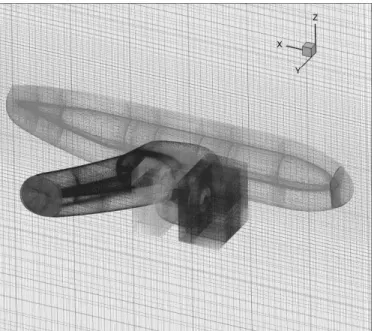
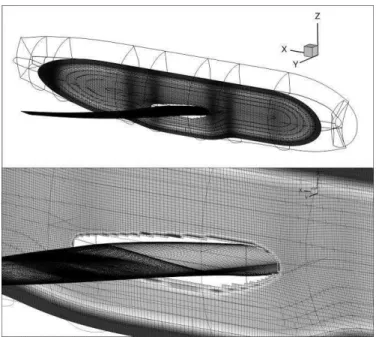
These Overset meshes are O-type grids created by extrusion of the surface discretization (see Fig. 3) while the computational domain is described by three Cartesian boxes of decreasing refinement levels. Through this generation process, a precise control on grid quality, such as grid spacing, stretching ratio and grid orthogonality near configuration surfaces, is achieved. Moreover, several cell layers of same height ensure an accurate skin gradient computation. The mesh extent is greater than 500 mean-aerodynamic chords.
Considering the WB configuration, the grid sizes range from 7.4 to 58.2 million points, corresponding to a grid-size-ratio of about 8. This is very low compared to the grid-grid-size-ratio of the DPW-5 common grid family [10] which was greater than 200. At that time, the coarsest grids were really much coarser (tiny grid below one million of elements). As a consequence, it will be shown that this DPW-6 grid family induces very limited variations in the grid convergence process.
Fig. 3 Illustration of Boeing Overset grid topology (WBNP3).
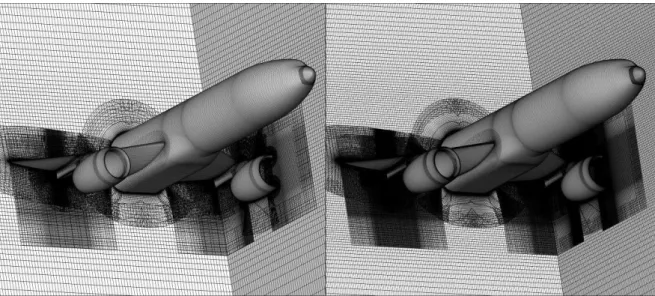
Fig. 4 and Fig. 5 show the grid refinement evolution between coarse and extra fine levels for the WBNP configuration. As it can be observed, the coarse grid exhibits a refinement level which would not have been considered as really coarse only a few years ago. Fig. 5 exhibits the through flow Nacelle-Pylon surface discretization for the coarsest and finest grids used in this article.
Fig. 4 Illustration of grid refinement levels; WBNP2 and WBNP5.
Fig. 5 Nacelle-Pylon surface discretization; WBNP2 and WBNP5.
Before running these Overset grids from Boeing with the elsA solver, a necessary and challenging pre-processing has been handled. Indeed, even if ONERA has a significant experience in term of Overset computations, the approach of Boeing is different: when ONERA teams would use about 5 Overset bases for the addition of a through flow Nacelle-Pylon installation, Boeing proposes 17 bases. As a consequence, the so-called Overset grids Boeing Serrano are composed of 8 bases for the WB configuration and 25 for the WBNP. For the latter, the Overset management which includes blanking and overlapping reduction processes is not straightforward.
Along the whole process, the in-house software Cassiopee [11] has been extensively used. Detail about the role of this software in the Overset pre-processing at ONERA can be found in [7]. For this study, the first step has been a plot3d to CGNS conversion. It included the implementation of connectivities and boundary conditions (wall, symmetry, overlap, farfield). An important issue is that the blanking variable (indicating if a grid cell is blanked or computed or interpolated) provided by Boeing has not been considered for the computations presented in this paper. The ONERA software has been used to build a new blanking variable field. The objective was to evaluate these in-house tools for the pre-processing of such complex Overset configurations. Consequently, the grids that have been
actually computed in this work are not rigorously the same as the ones calculated by Boeing, especially in the overlapping areas. Considering the WBNP configuration as an example, the blanking step (which consists in removing all cells that are inside physical bodies) has been realized using the latest Cassiopee blanking function named blankCellsTri with only 6 blanking bodies. They are unstructured surfaces obtained via an offset from the element skin as it is illustrated in Fig. 6 which shows the fuselage grid cells blanked by the wing blanking body. Then an overlapping reduction process, which allows priorities between bases to be defined, has been performed. In this study, it has been only applied to the three boxes filling the computational domain from the aircraft to the farfield. As a consequence, the cells of coarser boxes overlapping cells of finer boxes have been removed. The Overset pre-processing which has been handled based on Cassiopee can be considered as very satisfactory since it has allowed Overset interpolation computations without any orphan cell both for WB and WBNP configurations and for all the grid refinement levels (note that the tiny WBNP1 has not been tested).
Fig. 6 Illustration of the blanking process.
C. ONERA Overset Grids
In addition to the grids of the WB and WBNP configurations presented above, the ONERA grids of the horizontal and vertical tails shown in [7] have been used. They have been realized with the software Pointwise [12] which allows satisfactory 3D grids to be generated from a surface discretization defined by the user (automatic extrusion).
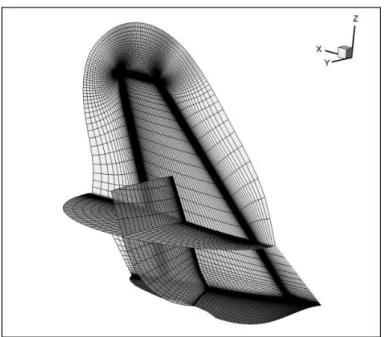
The HTP and VTP meshes are also basic O-type grids. The HTP mesh is made of about 1.8 million cells. It is shown in Fig. 7. In terms of topology and aspect, the VTP grid shape is equivalent. Nevertheless, the refinement level is lower for the VTP. It only includes 0.8 million elements. This is due to the fact that fewer aerodynamic interactions are expected in this area. Fig. 8 shows the complete mesh of the vertical tail. For sake of clarity, the cut at mid-chord is blanked after mid-span.
Fig. 7 HTP surface discretization and 3D mesh slices.
Fig. 8 VTP surface discretization and 3D mesh slices.
III.
Solver and Far-Field Post-Processing
D. elsA Solver
Structured RANS computations were performed with elsA [13].This software uses a cell-centered finite-volume discretization on structured point-matched and Overset grids. In this study, time integration is carried out by a backward-Euler scheme with implicit LU-SSOR relaxation. Spatial discretization is realized using a 2nd order central Jameson scheme [14] with artificial viscosity. Multigrid techniques (one level) are used to accelerate convergence. Turbulence effects are simulated by the one-equation Spalart-Allmaras model [15]. Only when specified, the SA-QCR2000 [8], nonlinear version of the model which does not use the traditional Boussinesq relation, has been employed. The Overset interpolations are classically performed over two cell layers around holes and overlap conditions and a double-wall algorithm is used to ensure accurate interpolations when surfaces are described by several grids.
In order to reach a satisfactory level of convergence, the computations were continued at least until the fluxes were stable enough to observe a lift coefficient variation inferior to +/- 0.001 and a drag coefficient variation inferior to 0.5 drag count over the last thousand of iterations (1 drag count = 4
10− ). This is illustrated in Fig. 9 which exhibits the numerical convergence obtained with the medium grid WB3 as an example. It can be noticed that the friction drag component shows as expected a much faster convergence than the pressure drag.
The elsA simulations are executed on a Silicon Graphics cluster (SGI ICE 8200) composed of 5,120 cores representing a power of 57.9 teraflops. The computations carried out for this work have been performed in parallel mode, using from 48 to 256 cores.
Fig. 9 WB; Ma = 0.85, Re = 5 x 10⁶, CL = 0.5; numerical convergence for the medium grid WB3.
E. ONERA – ffd72 Post-Processing Code
The far-field method consists in integrating values in the flow domain whereas the classical near-field approach uses skin integrations only. The formulations and methods relative to the far-field theory have been presented in former publications [2,16,17]. In this study, all the far-field analyses are carried out with the drag extraction software ffd72.
The code is based on the formulations given in the references mentioned above. It was developed to provide a physical drag breakdown into viscous, wave, and lift-induced drag components and therefore to eliminate spurious drag by difference with the near-field drag coefficient. The code ffd72 is used at the end of the CFD process. It is a post-processing tool working on the numerical solutions provided by the solver.
The different drag coefficients which are used in this article are defined here:
f p nf
CD
CD
CD
=
+
(1) i w v ffCD
CD
CD
CD
=
+
+
(2)The spurious drag CDsp is defined as drag generated through entropy or stagnation enthalpy variations along streamlines outside physical viscous layers and shocks, and not resulting from vortex decay. It is generally produced in regions of strong pressure gradients via the addition of artificial dissipation. The viscous pressure drag CDvp is also defined. It is the part of the viscous drag which is not due to the friction drag (displacement effect, flow separation…):
f vp v
CD
CD
CD
=
+
(4)The far-field formulation allows for the following near-field/far-field drag balance:
sp i w v f p
CD
CD
CD
CD
CD
CD
+
=
+
+
+
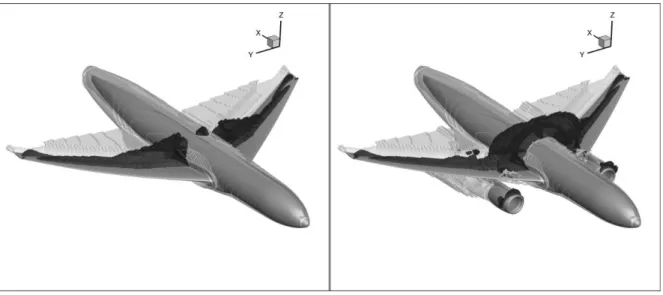
(5)Fig. 10 shows some of the capabilities of the far-field code ffd72. It gives the integration volumes of the viscous drag (about the plane surface and wake) and of the wave drag (in black) for both Wing-Body and Wing-Body-Nacelle-Pylon configurations at design point.
Fig. 10 WB and WBNP; Ma = 0.85, Re = 5 x 10⁶, CL = 0.5; illustration of ffd72 capabilities.
IV.
The Wing-Body Configuration
In this section, only the Wing-Body configuration is considered. First, the results of a grid convergence study are presented and compared to DPW-5 data so that the drag increment due to wing twist and bending modifications can be quantified. Then, an angle of attack sweep study is proposed. The results obtained with the model SA-QCR2000 are discussed both in first and second sub-sections. All the drag coefficients are given in drag counts (d.c.).
A. Drag Increment due to Wing Shape Modification
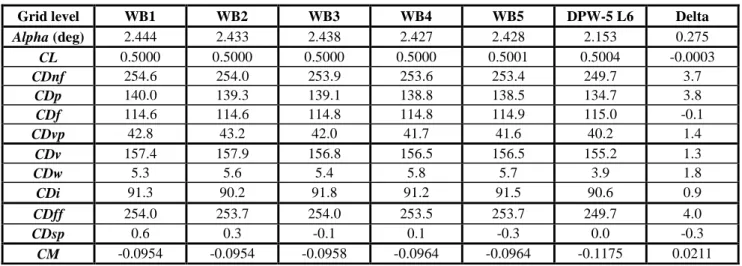
For the convergence study shown below, the Boeing Overset grids 2p75 presented in Table 1 are used and the aerodynamic conditions are the following: Mach number Ma = 0.85, lift coefficient CL = 0.5 (±0.001), Reynolds number Re = 5 x 10⁶. All these computations were performed in a fully turbulent regime. The results are summarized in Table 2. It gives the angles of attack, lift, near-field, and far-field drag coefficients for each refinement level. It also includes the results obtained with the finest grid of DPW-5 family (i.e. with original wing geometry) extracted from [3] and a column exhibiting the increment due to the wing shape modification. Fig. 11 shows some of these figures (pressure and friction components) but also data from [6].
Table 2 WB; grid convergence study; Ma = 0.85, Re = 5 x 10⁶, CL = 0.5; global coefficients
Grid level WB1 WB2 WB3 WB4 WB5 DPW-5 L6 Delta
Alpha (deg) 2.444 2.433 2.438 2.427 2.428 2.153 0.275 CL 0.5000 0.5000 0.5000 0.5000 0.5001 0.5004 -0.0003 CDnf 254.6 254.0 253.9 253.6 253.4 249.7 3.7 CDp 140.0 139.3 139.1 138.8 138.5 134.7 3.8 CDf 114.6 114.6 114.8 114.8 114.9 115.0 -0.1 CDvp 42.8 43.2 42.0 41.7 41.6 40.2 1.4 CDv 157.4 157.9 156.8 156.5 156.5 155.2 1.3 CDw 5.3 5.6 5.4 5.8 5.7 3.9 1.8 CDi 91.3 90.2 91.8 91.2 91.5 90.6 0.9 CDff 254.0 253.7 254.0 253.5 253.7 249.7 4.0 CDsp 0.6 0.3 -0.1 0.1 -0.3 0.0 -0.3 CM -0.0954 -0.0954 -0.0958 -0.0964 -0.0964 -0.1175 0.0211 Based on Table 2 and Fig. 11, the following comments can be made:
1) Considering the angle of attack that leads to a lift coefficient of 0.5 +/- 0.001, a variation of about 0.016 deg is observed between the coarsest and finest grids of the DPW-6 family. This variation can be considered as relatively low. However, the difference of 0.275 deg between the angles of attack corresponding to CL = 0.5 for DPW-5 and DPW-6 geometries is quite significant and demonstrates a first aspect of the wing shape modification impact.
2) The pressure drag coefficient exhibits a monotone decrease of only 1.5 drag counts between WB1 and WB5: it highlights the facts that the grid-size-ratio of this DPW-6 family is relatively low and also that the grid quality is remarkable with levels of spurious drag lower than one count even for coarsest grids. The CDp value of finest grids is close to 138.5 d.c. which is almost 4 counts higher than was obtained with the DPW-5 geometry. Moreover, as it can be noticed in Fig. 11, this value of 138.5 d.c. is in close agreement with the data from [6] in which experimental twist measurements from NASA had been implemented in the DPW-5 grids. This agreement seems to indicate that it is mostly the twist (and not the bending) evolution which is responsible for the drag increment observed between DPW-5 and DPW-6 wing geometries.
3) The friction drag variation is really limited: it shows an increase of only 0.3 drag count between WB1 and WB5. Furthermore, this coefficient is not impacted by the wing shape modification. Its extrapolated value is still about 115 counts in good agreement with [3] and [6].
4) The far-field drag obtained with finest DPW-6 grids is close to 253.7 counts. It is composed of 156.5 d.c. of viscous drag, 5.7 d.c. of wave drag, and 91.5 d.c. of lift-induced drag. The delta with DPW-5 geometry is equal to 4 counts, showing that the global increment is almost entirely due to pressure drag effects: 1.4 d.c. on viscous pressure component, 1.8 d.c. on wave coefficient, and 0.9 d.c. on lift-induced drag. The greater nose-down twist of the DPW-6 geometry leads to modifications in the wing flow field that affect the span load, as well as the pressure and shock distributions [6].
5) The pitching moment shows very limited variation through the DPW-6 grid convergence process. On the other hand, the impact of the wing shape modification is substantial. The original pitching moment of -0.1175 is reduced to -0.0964. As shown in [6], this significantly reduces the discrepancy between CFD and wind tunnel data.
It is noticeable that, despite the use of different Overset pre-processing methods and different solvers, the results presented above are really close to the ones shown by Boeing with the same set of grids and turbulence model [1]. The difference in extrapolated total drag values is below the count: it represents a very good validation of the Overset pre-processing and computations performed with the software Cassiopee and elsA.
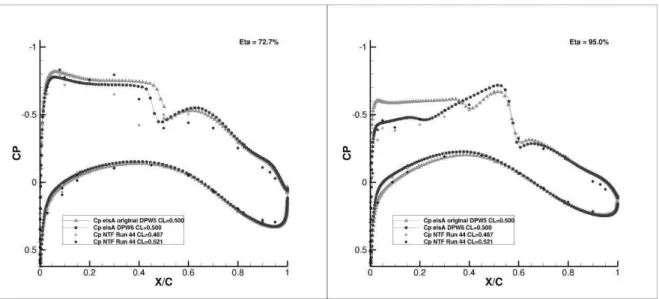
Some local considerations are introduced with the pressure distributions over two outer wing sections shown in Fig. 12. The outer part of the wing is the region in which the shape modification is the most noticeable as illustrated in Fig. 2. As it can be observed, experimental Cp distributions from [9] are added: two runs surrounding the lift coefficient of 0.5 have been used. In the comparison process, it should be kept in mind that the experimental data from NTF is not corrected from support system effects. The numerical distributions are obtained with the finest grids of original DPW-5 [3] and DPW-6 families. Concerning the section at 72.7% span, it can be seen that the wing shape modification only provokes a slight displacement of shock position and pressure levels on the suction side. On the other hand, at 95.0% span, the geometry change has a strong impact on the Cp shape. The agreement between experimental and numerical data is clearly improved with the new wing proposed in DPW-6. However, it appears in Fig. 12 that the CFD seems to over-predict the aft-loading measured in experiments. It partly explains why the numerical pitching moment is too negative compared to the wind tunnel data.
Fig. 12 WB; Ma = 0.85, Re = 5 x 10⁶, CL = 0.5; pressure distributions.
As it appeared that the use of the model SA-QCR2000 [8] could be relevant in off-design conditions (at higher angles of attack), additional computations have been carried out to quantify the impact of this specific version on drag prediction accuracy at design point. The results are shown in Table 3 and Fig. 11. As it can be observed, the differences that exist are not negligible. They have been confirmed by other DPW-6 participants [1].
Table 3 WB; SA vs SA-QCR2000; Ma = 0.85, Re = 5 x 10⁶, CL = 0.5; global coefficients Grid level WB5 SA-QCR2000 WB5 Delta
Alpha (deg) 2.469 2.428 0.041 CL 0.5000 0.5001 -0.0001 CDnf 255.0 253.4 1.6 CDp 140.8 138.5 2.3 CDf 114.2 114.9 -0.7 CDvp 42.9 41.6 1.3 CDv 157.1 156.5 0.6 CDw 6.2 5.7 0.5 CDi 91.9 91.5 0.4 CDff 255.3 253.7 1.6 CDsp -0.3 -0.2 -0.1 CM -0.0922 -0.0964 0.0042
Concerning Table 3, it can be said that the increment of Alpha which is necessary to reach the appropriate lift coefficient with the SA-QCR2000 version is quite significant. Furthermore, the increase of 2.3 d.c. of pressure drag is relatively strong. On the other hand, the friction drag exhibits a decrease of 0.7 count. It leads to a total drag difference of about 1.6 counts composed of similar CDv, CDw, and CDi increases. Since this configuration only shows a minor flow separation at the Wing-Body junction in design conditions (this has been verified with these Overset grids and previous grid families [1]), the impact of using the QCR2000 version at design point is more significant than it could have been expected. Actually, the decrease of the corner flow separation due to QCR should lead to a CDf increase and a CDp decrease but the contrary is observed. It should be kept in mind if this model improvement becomes the reference and is used for comparison studies involving computations carried out with the original SA model.
B. Angle of Attack Sweep Study
For the Alpha sweep study presented here, the geometry is still the Wing-Body configuration. The additional medium grids referenced as 2p50, 3p25, 3p75, and 4p00 are used. Each grid defines the wing geometry corresponding to the specified angle of attack in experimental conditions. This is a significant progress compared to previous DPW studies: the aero-elastic deformations are taken into account. Nevertheless, due to a non-negligible discrepancy between CFD and wind tunnel CL(Alpha) curves, the CFD load at a given angle of attack is not rigorously identical to the experimental load which induced the deformation that is considered. Tests have been carried out to verify that this approximation has only minor effects. The medium grid 2p75 employed in the former sub-section is also added in the following polars. The Mach and Reynolds numbers are unchanged.
Fig. 13 shows the lift polar for angles of attack from 2.50 to 4.00 deg and includes numerical results from DPW-5 [3] and wind tunnel data from NTF [9]. Once again, it should be mentioned that the experimental data is not corrected from support system effects (despite the fact that the sting which was used has a significant size). It can be noticed that the DPW-6 results are closer to the experiments, showing the impact of the wing shape modification, nevertheless a quite strong gap remains. For a given angle of attack, the DPW-6 computations predict a lift coefficient which is superior of about 0.05 to the NTF data. Furthermore, contrary to the DPW-5 outcomes presented in Fig. 13, the geometries and Overset grids used in this new study led to a strong CL drop at 4.00 deg
Fig. 13 WB; Ma = 0.85, Re = 5 x 10⁶; medium grids; lift polar.
To understand the reasons for such a premature flow separation at high angle of attack with the standard SA model, it should be reminded that, as explained in [7], Overset meshes tend to exhibit particularly refined grid areas close to junctions. Fig. 14 shows the stream traces and friction levels for SA and SA-QCR2000 models at 4.00 deg of incidence. The computation performed with the standard SA exhibits a massive corner flow separation at the Wing-Body junction resulting in the unexpected CL drop discussed above [18]. On the other hand, this flow separation almost disappears with the QCR2000 version.
Then, Fig. 15 gives the drag polar. In this figure, DPW-5, DPW-6 (SA and SA-QCR2000), and NTF data are compared. In addition to the fact that wind tunnel data is not corrected from sting effects, it should also be said, as addressed in [6], that the computations are fully turbulent whereas the experimental model exhibits a 10% chord laminar boundary layer at the wing leading edge which results in a drag reduction of about 6 counts at design point. By assuming that this CD drop of 6 d.c. can be considered as constant over the whole polar, a curve named NTF Run 44 – fully turbulent has been added in Fig. 15. Observing the latter, it can be stated that the wing geometry change in itself does not clearly allow a better agreement between numerical and experimental drag polars. The aero-elastic effects do not seem to have a significant impact here, as shown in [19]. However, the SA-QCR2000 model gives very interesting results which are in better agreement with experiments at high angles of attack. As said in the past, without any support system corrections, the good agreement between CFD and NTF absolute drag values at design point should be considered with caution.
Fig. 15 WB; Ma = 0.85, Re = 5 x 10⁶; medium grids; drag polar.
To conclude this sub-section dedicated to the Alpha sweep study, far-field analyses are proposed. Fig. 16 shows the evolution of different drag components with the angle of attack increase from 2.50 to 4.00 deg. Considering the previous results, this is the SA-QCR2000 model which has been chosen for this post-processing insight. The friction drag CDf shows a slight decrease due to the increasing extent of flow separation. On the other hand, the viscous pressure component CDvp exhibits a substantial increase of more than 65 counts due to the wake and boundary layer growth. The wave drag CDw also shows a dramatic evolution and is multiplied by more than 10 between design point and 4.00 deg. The lift-induced drag CDi rapidly becomes the strongest component since its value is directly linked to the lift level.
Fig. 16 WB; Ma = 0.85, Re = 5 x 10⁶; medium grids; CDf, CDvp, CDw, and CDi vs Alpha.
V.
The Wing-Body-Nacelle-Pylon Configuration
In this section, results obtained with the Wing-Body-Nacelle-Pylon configuration are presented so that the corresponding Nacelle-Pylon (NP) drag increment can be evaluated. Global and local analyses are given. Only the standard SA model is used in this section.
A. Drag Increment due to Nacelle-Pylon Installation
Here again, the Boeing Overset grids 2p75 presented in Table 1 are used and the aerodynamic conditions are still: Mach number Ma = 0.85, lift coefficient CL = 0.5 (±0.001), and Reynolds number Re = 5 x 10⁶. Table 4 gives the angles of attack, lift, near-field, and far-field drag coefficients for each refinement level of the WBNP configuration. It includes the WB5 values for direct comparison with the Wing-Body geometry and therefore a column exhibiting the increment due to the Nacelle-Pylon installation in iso-CL conditions.
Table 4 WBNP; grid convergence study; Ma = 0.85, Re = 5 x 10⁶, CL = 0.5; global coefficients Grid level WBNP2 WBNP3 WBNP4 WBNP5 WB5 Delta
Alpha (deg) 2.619 2.622 2.602 2.596 2.428 0.168 CL 0.5001 0.5009 0.5006 0.5004 0.5001 0.0003 CDnf 276.8 276.7 276.2 275.9 253.4 22.5 CDp 145.1 144.6 144.1 143.6 138.5 5.1 CDf 131.7 132.0 132.1 132.3 114.9 17.4 CDvp 49.8 47.2 47.0 46.9 41.6 5.3 CDv 181.5 179.3 179.1 179.1 156.5 22.6 CDw 5.8 5.8 5.8 5.7 5.7 0.0 CDi 88.2 91.1 90.8 90.6 91.5 -0.9 CDff 276.4 276.3 275.7 275.5 253.7 21.8 CDsp 0.4 0.4 0.5 0.4 -0.2 0.6 CM -0.0906 -0.0915 -0.0911 -0.0915 -0.0964 0.0049
Based on Table 4, the following comments can be formulated:
1) The coefficient evolutions through grid convergence process are very similar to what was observed with the Wing-Body configuration in Table 2 (for instance, slight decrease and increase of the pressure and friction drag components respectively).
2) The drag increment due to the Nacelle-Pylon installation exhibits a value close to 22 drag counts. When considering the WBNP5 and WB5 grids, the exact delta given by elsA/ffd72 is 21.8 counts. When considering Fig. 17, which is courtesy of Edward Tinoco, it can be said that this numerical increment is really close to the experimental delta extracted from NTF and Ames data: 22.8 d.c. +/- 1.2 d.c. This is an illustration that the CFD is mature enough to provide increments with levels of accuracy equivalent to the wind tunnel standards.
3) Over these 22 drag counts, the breakdown shown in Table 4 allows to notice that more than 17 counts come from the friction coefficient only. It means that more than 75% of the increment is just due the additional wet surfaces. The remaining 5 counts are viscous pressure drag. Both wave and lift-induced components are not affected, which is quite remarkable. These aspects will be discussed below in the sub-section dedicated to local analyses.
4) The spurious drag levels remain very low for this more complex geometry which includes a through flow NP installation, demonstrating the good quality of Overset grids and pre-processing.
Fig. 17 WB vs WBNP; Ma = 0.85, Re = 5 x 10⁶; experimental increment (courtesy of Edward Tinoco).
B. Local Analyses
In this sub-section, the effects of the Nacelle-Pylon installation at design point are studied through local investigations. First, the impact on suction side pressure distribution is shown in Fig. 18. It can be noticed that the NP presence significantly modifies the initial pressure field of the Wing-Body configuration (left). It is especially visible in the inner part of the wing where the shock position and shape are clearly affected. The impact of the engine installation on the shock features is also confirmed by Fig. 10 which shows the wave drag integration volume extending upstream and upward in the inner wing and fuselage areas.
Fig. 18 WB vs WBNP; Ma = 0.85, Re = 5 x 10⁶, CL = 0.5; pressure fields on suction sides.
In addition, Fig. 19 and Fig. 20 also give the Cp distributions of WB and WBNP geometries in 4 wing sections materialized by lines in Fig. 18. It can be observed that the section at 28.3% span exhibits great differences between the two configurations, both on pressure and suction sides. The WBNP wing shows a premature shock 10 to 15% chord closer to the leading edge (LE) in this section. On the other hand, this loss of lift is compensated by the pressure side. These numerical trends are confirmed by NTF data [9]. The following sections show that the differences between WB and WBNP are decreasing along the wing span (the WBNP shock is moving downstream) and the final section at 95% span exhibits almost identical distributions. The discrepancy between wind tunnel and CFD aft-loading evaluations at trailing edge (TE) seems not to be affected by the NP installation.
Fig. 20 WB vs WBNP; Ma = 0.85, Re = 5 x 10⁶, CL = 0.5; outer wing pressure distributions.
What is remarkable, as mentioned for the 28.3% section, is that the overall span lift (load) distribution is almost unchanged when comparing the two configurations. This aspect is illustrated in Fig. 21 and explains why the lift-induced drag coefficient is almost not impacted (Table 4). Concerning the other drag components, an insight is given in Fig. 22. It shows the span productions of the friction, viscous pressure, and wave drag coefficients for WB and WBNP geometries. The increase of about 17 counts of the friction component (Table 4) can easily be located at the NP position. On the other hand, it can be noticed that the viscous pressure drag curves exhibit differences not only in the nacelle area. As discussed above, the shock features are quite different in the inner wing. This affects the boundary layers and wakes and therefore the viscous pressure drag which is increased of about 5 counts. The analysis of the wave component is particularly interesting since this coefficient has shown no modification of its overall value due to the Nacelle-Pylon installation (see Table 4) whereas the span distributions of CDw for the WB and WBNP configurations are completely different. Indeed, it can be observed in Fig. 22 that the WBNP wing produces a double bump of wave production with a significant contribution of the inner part while the WB geometry only exhibits a single bump at midspan.
Fig. 22 WB vs WBNP; Ma = 0.85, Re = 5 x 10⁶, CL = 0.5; CDf, CDvp, and CDw span distributions.
Finally, Fig. 23 shows the flow (stream traces and friction levels) in different parts of the NP installation. It focuses on the pylon trailing edge where minor flow separation areas can be seen, the one in the inboard side (left) being the most important, and leading edge. The latter exhibits a small flow separation on the outboard side but the flow is attached again shortly thereafter. The fact that more than 75% of the Nacelle-Pylon drag increment is due to friction shows that these flow separation areas have only limited impact.
VI.
The Complete Cruise Configuration
In this section, the horizontal and vertical tailplane geometries and grids presented above are added to the WBNP configuration in order to obtain a complete cruise configuration. As explained, a CRM Wing-Body configuration (based on original DPW-5 wing geometry) including the HTP and VTP had already been calculated in [7]. As a consequence, the increment due to the addition of horizontal and vertical tails obtained in the present study can be compared with previous CFD data. The HTP is set at 0.00 deg and consequently the complete configuration is not trimmed. Detail about trim drag evaluation can be found in [2]. Only the standard SA model has been employed in this section.
Table 5 shows the angles of attack, lift, near-field, and far-field drag coefficients for WBNP3 and a medium grid of the complete configuration. The last column exhibits the delta due to the addition of the tails. Aerodynamic conditions are unchanged and the comparisons are done in iso-CL conditions. An illustration of the pressure field over the complete configuration is shown in Fig. 24.
Table 5 Complete configuration; Ma = 0.85, Re = 5 x 10⁶, CL = 0.5; global coefficients Grid level Complete
configuration WBNP3 Delta Alpha (deg) 2.700 2.622 0.078 CL 0.5004 0.5009 0.0005 CDnf 306.8 276.7 30.1 CDp 153.9 144.6 9.3 CDf 152.9 132.0 20.9 CDvp 56.1 47.2 8.9 CDv 209.0 179.3 29.7 CDw 6.7 5.8 0.9 CDi 90.6 91.1 -0.5 CDff 306.3 276.3 30.0 CDsp 0.4 0.4 0.0 CM -0.0575 -0.0915 0.034
Considering Table 5, it can be noticed that the drag increment due to the tails is about 30 counts. It is really close to the value of 31.5 d.c. shown in [7] for which the wing geometry and Wing-Body grid were different from the ones used in this article. This represents a good validation of these results. The 30 counts of increment are composed of almost 21 d.c. of friction (inevitable wet surfaces) and about 9 counts of viscous pressure drag. Indeed, it can be noticed that due to the HTP negative lift, the wing needs a higher angle of attack to maintain the global lift level and it produces significant CDvp and CDw increases.
The total drag of this complete cruise configuration exhibits a value close to 306 counts which can be analyzed as follows: exactly 50% of friction drag, 18% of viscous pressure drag, only 2% of wave drag, and 30% of lift-induced drag. It can be understood from these figures that the technologies acting on the friction component (such as natural or hybrid laminar flow control systems) are of great interest for the future of civil aircraft.
Fig. 24 Complete configuration; Ma = 0.85, Re = 5 x 10⁶, CL = 0.5; pressure field on suction side.
VII.
Conclusions
This article is focused on the computational studies which have been carried out at ONERA in 2016 in the framework of the 6th AIAA Drag Prediction Workshop.
First, using structured Overset grids provided by Boeing, a grid convergence study at design point involving the new CRM wing geometry based on twist and bending wind tunnel measurements has been completed. The extrapolated Wing-Body drag value of about 254 counts that has been obtained exhibits an increment of 4 counts compared to the original DPW-5 configuration. This evaluation is in agreement with previous publications from ONERA and also with other DPW-6 participants such as Boeing or Penn State and Michigan Universities.
An angle of attack sweep study has also been performed with these experimental wing shapes and it has allowed a better agreement between the CFD and wind tunnel lift polars. Moreover, at high angles of attack, the SA-QCR2000 turbulence model has shown results closer to the experimental data than the standard SA model, both for lift and drag polars. The QCR2000 version has also been evaluated for drag prediction at design point (iso-lift conditions) and non-negligible differences have been observed with the usual SA formulation: about 2 counts higher for the pressure component and 1 count lower for the friction coefficient.
Then, a Nacelle-Pylon drag increment has been quantified using the proposed WBNP configuration: the CFD value of about 22 counts shows very good agreement with the NTF and Ames data (22.8 d.c. +/- 1.2). Analyses have highlighted that more than 75% of this increment is due to friction, the remaining 5 counts being viscous pressure drag. The NP installation has a significant impact on the inner wing flow and shock features but the global wave and lift-induced drag components are almost unchanged compared to the WB geometry.
Finally, a complete cruise configuration including the Nacelle-Pylon plus horizontal and vertical tails has been computed. The increment due to the addition of tailplanes which has been obtained with a combination of Boeing and ONERA Overset grids is close to 30 counts. This is in good agreement with the ONERA article of 2015 in which the vertical tail geometry had been presented. The evaluation of such a relevant complete cruise configuration is particularly interesting since it allows meaningful drag component analyses to be performed.
As noticed, this is mainly the prediction of increments which has been addressed in this paper. Indeed, the wind tunnel environment, such as support system (sting) or walls, is not modeled in the computations. And on the other hand, the NASA CRM experimental data is not corrected from support system effects. A priori, this prevents absolute drag comparisons to be carried out. Besides, many among the DPW community think that evaluating increments with accuracy is what matters the most. This is perfectly understandable in an industrial context which tends to favor minor changes in aircraft design rather than radical evolutions. Nevertheless, it also seems that there is interest for absolute drag prediction and therefore absolute CFD / wind tunnel / flight comparisons. Investigations on this field would allow the prediction tools to include more physics and more practical aspects in the simulations. Such studies are in progress at ONERA and they will be the subject of coming articles.
Acknowledgments
The authors would like to thank D. Destarac and S. Esquieu, who developed the far-field drag extraction software used in this study following a theory elaborated by J. van der Vooren. The authors also thank the DPW Organizing Committee and especially Ed. Tinoco. The studies presented in this article have been funded in the framework of the elsA three-party agreement between AIRBUS, SAFRAN, and ONERA (ASO) which are co-owners of this software.
References
1.
DPW-6 website, http://aiaa-dpw.larc.nasa.gov/
2.
Hue, D., and Esquieu, S., “Computational Drag Prediction of the DPW4 Configuration Using the Far-Field Approach,”
Journal of Aircraft, Vol. 48, No. 5, Sept.-Oct. 2011, pp. 1658-1670.
3.
Hue, D., “Fifth Drag Prediction Workshop: Computational Fluid Dynamics Studies Carried Out at ONERA,” Journal of
Aircraft, Vol. 51, No. 4, July.-August. 2014, pp. 1295-1310.
4.
Vassberg, J. C., DeHann, M. A., Rivers, S. M., and Wahls, R. A., “Development of a Common Research Model for Applied CFD Validation Studies,” AIAA Paper 2008-6919, 2008.
5.
Rivers, M. B., Hunter, C. A., and Campbell, R., L., “Further Investigation of the Support System Effects and Wing Twist on the NASA Common Research Model,” AIAA Paper 2012-3209, 2012.
6.
Hue, D., “Fifth Drag Prediction Workshop: ONERA Investigations with Experimental Wing Twist and Laminarity,” Journal
of Aircraft, Vol. 51, No. 4, July.-August. 2014, pp. 1311-1322.
7.
Hue, D., et al., “Validation of a near-body and off-body grid partitioning methodology for aircraft aerodynamic performance prediction,” Computers & Fluids, Vol. 117, 2015, pp. 196-211.
8.
Spalart, P. R., "Strategies for Turbulence Modelling and Simulation," International Journal of Heat and Fluid Flow, Vol. 21, 2000, pp. 252-263.
9.
Common Research Model website, http://commonresearchmodel.larc.nasa.gov/
10.
Vassberg, J. C., “A Unified Baseline Grid about the Common Research Model Wing-Body for the Fifth AIAA CFD Drag Prediction Workshop,” AIAA Paper 2011-3508, 2011.
11.
Péron, S., Benoit, C., Landier, S., and Raud, P., “Cassiopée: CFD Advanced Set of Services In an Open Python EnvironmEnt,” 12th Symposium on Overset Grid and Solution Technology, Atlanta, 2014.
12.
Mesh Generation Software for CFD - Pointwise, http://www.pointwise.com
13.
Cambier, L., Heib, S., and Plot, S., “The ONERA elsA CFD Software: Input from Research and Feedback from Industry,”
Mechanics and Industry, Vol. 15(3), pp. 159-174, 2013.
14.
Jameson, A., Schmidt, W., and Turkel, E., “Numerical Solution of the Euler Equations by Finite Volume Methods Using Runge Kutta Time Stepping Schemes,” AIAA-81-1259, June 1981.
15.
Spalart, P. R., and Allmaras, S. R., "A One-Equation Turbulence Model for Aerodynamic Flows," AIAA Paper 92-0439, 1992.
16.
Destarac, D., “Far-Field / Near-Field Drag Balance Applications of Drag Extraction in CFD,” CFD-Based Aircraft Drag
Prediction and Reduction, VKI Lecture Series 2003-02, von Karman Institute for Fluid Dynamics, Rhode-Saint-Genèse,
Belgium, 3-7 November 2003.
17.
Destarac, D., “Drag Extraction from Numerical Solutions to the Equations of Fluid Dynamics: the Far-field Philosophy,”