HAL Id: hal-00298062
https://hal.archives-ouvertes.fr/hal-00298062
Submitted on 1 Feb 2007
HAL is a multi-disciplinary open access
archive for the deposit and dissemination of
sci-entific research documents, whether they are
pub-lished or not. The documents may come from
teaching and research institutions in France or
abroad, or from public or private research centers.
L’archive ouverte pluridisciplinaire HAL, est
destinée au dépôt et à la diffusion de documents
scientifiques de niveau recherche, publiés ou non,
émanant des établissements d’enseignement et de
recherche français ou étrangers, des laboratoires
publics ou privés.
Atlantic ocean in PMIP coupled model simulations
S. L. Weber, S. S. Drijfhout, A. Abe-Ouchi, M. Crucifix, M. Eby, A.
Ganopolski, S. Murakami, B. Otto-Bliesner, W. R. Peltier
To cite this version:
S. L. Weber, S. S. Drijfhout, A. Abe-Ouchi, M. Crucifix, M. Eby, et al.. The modern and glacial
overturning circulation in the Atlantic ocean in PMIP coupled model simulations. Climate of the
Past, European Geosciences Union (EGU), 2007, 3 (1), pp.51-64. �hal-00298062�
www.clim-past.net/3/51/2007/
© Author(s) 2007. This work is licensed under a Creative Commons License.
of the Past
The modern and glacial overturning circulation in the Atlantic
ocean in PMIP coupled model simulations
S. L. Weber1, S. S. Drijfhout1, A. Abe-Ouchi2, M. Crucifix3, M. Eby4, A. Ganopolski5, S. Murakami6, B. Otto-Bliesner7, and W. R. Peltier8
1Royal Netherlands Meteorological Institute (KNMI), De Bilt, The Netherlands 2Center for Climate System Research, The University of Tokyo Kashiwa, Japan 3Hadley Center for Climate Prediction and Research, Met Office, Exeter, UK 4School of Earth and Ocean Sciences, University of Victoria, Victoria, Canada 5Potsdam Institute for Climate Impact Research, Potsdam, Germany
6Meteorological Research Institute, Tsukuba, and Frontier Research Center for Global Change, JAMSTEC, Yokohama, Japan 7National Center for Atmospheric Research, Boulder, USA
8Department of Physics, University of Toronto, Toronto, Canada
Received: 22 September 2006 – Published in Clim. Past Discuss.: 11 October 2006 Revised: 15 January 2007 – Accepted: 25 January 2007 – Published: 1 February 2007
Abstract. This study analyses the response of the Atlantic
meridional overturning circulation (AMOC) to LGM forc-ings and boundary conditions in nine PMIP coupled model simulations, including both GCMs and Earth system Mod-els of Intermediate Complexity. Model results differ widely. The AMOC slows down considerably (by 20–40%) during the LGM as compared to the modern climate in four mod-els, there is a slight reduction in one model and four models show a substantial increase in AMOC strength (by 10–40%). It is found that a major controlling factor for the AMOC response is the density contrast between Antarctic Bottom Water (AABW) and North Atlantic Deep Water (NADW) at their source regions. Changes in the density contrast are de-termined by the opposing effects of changes in temperature and salinity, with more saline AABW as compared to NADW consistently found in all models and less cooling of AABW in all models but one. In only two models is the AMOC re-sponse during the LGM directly related to the rere-sponse in net evaporation over the Atlantic basin. Most models show large changes in the ocean freshwater transports into the basin, but this does not seem to affect the AMOC response. Fi-nally, there is some dependence on the accuracy of the con-trol state.
Correspondence to: S. L. Weber ([email protected])
1 Introduction
Simulation of the glacial climate is a relevant excercise for general circulation models (GCMs) used to predict future cli-mate changes. Most importantly, it provides an assessment of the accuracy of models’ representation of climate change in response to changes in the forcings and boundary condi-tions. Whether direct inferences on future climate changes can be made based on the glacial climate is still under debate (Hargreaves et al., 2006). The glacial net forcing includes large contributions from other factors than greenhouse gas changes. Also, the climatic responses to increased green-house gas levels (future climate) and reduced levels (glacial climate) is not necessarily symmetric. Obviously, this holds for the response of the Atlantic meridional overturning cir-culation (AMOC) as climate models simulate a decline in circulation strength for a CO2 quadrupling (Gregory et al.,
2005) while proxy data indicate a decline during glacials as well (see below). Nevertheless, such validation excercises should be attempted in order to gain understanding of the processes underlying climate change and to enhance confi-dence in model predictions of the climate of the next century. The Paleoclimate Modeling Intercomparison Project (PMIP) has defined a standard set of forcings and bound-ary conditions for the Last Glacial Maximum (LGM) and pre-industrial climate in order to facilitate intercomparison among models and with paleoclimatic data (eg Masson-Delmotte et al., 2005; Kageyama et al., 2006). During the first phase of PMIP, simulations were done with atmospheric GCMs. Now that simulations of the glacial climate with
cou-pled atmosphere-ocean GCMs are feasible, it is possible to test the glacial AMOC against the available evidence from proxy data. Paleoclimatic data suggest that the overturning cell associated with North Atlantic Deep Water (NADW) for-mation was weaker than today (McManus et al., 2004), with enhanced intrusion of Antarctic Bottom Water (AABW) into the Atlantic basin (Duplessy et al., 1988; Labeyrie et al., 1992; Sarnthein et al., 1994; Curry and Oppo, 2005). Mod-els, on the other hand, show a wide range of responses when comparing the glacial AMOC to the modern. The AMOC is intensified in some of the first coupled AO-GCM runs (He-witt et al., 2001; Kitoh et al., 2001), while it is weakened in others (Peltier and Solheim, 2003; Shin et al, 2003). Con-sidering this diversity of model results, it remains to be es-tablished which mechanisms are responsible for maintaining the glacial AMOC as it is reconstructed from proxy data.
Several hypotheses have been put forward in the literature on the dominant processes responsible for the reduced glacial overturning circulation. Sensitivity experiments with the UVic intermediate-complexity coupled model show that the glacial thermal forcing alone leads to stronger NADW for-mation, while diminished net evaporation over the Atlantic basin counteracts the thermal forcing resulting in reduced NADW (Schmittner et al., 2002). The glacial ocean exhibits two closely related equilibrium states in the CLIMBER-2 intermediate-complexity model, which differ in the location of deep-water formation (Ganopolski et al., 1998; Ganopol-ski and Rahmstorf, 2001). One is a stable “cold” mode with a slightly weakened AMOC, due to a salinity reduction in NADW compared to AABW, and the other a marginally un-stable “warm” mode with intensified AMOC and a more northern formation of NADW. Finally, a weakened AMOC is associated with enhanced AABW formation induced by stronger equatorward sea-ice export in the Southern Ocean in the NCAR atmosphere-ocean (AO) GCM (Shin et al., 2003). The purpose of the present paper is to carry out a model intercomparison study, analysing for the first time the mod-ern and glacial circulation in the Atlantic ocean simulated by coupled atmosphere-ocean models within the framework of PMIP. More specifically, we examine if processes invoked in the literature to explain AMOC changes in a certain model also work in other models. We do not attempt a detailed com-parison to the available proxy data, but focus on the role of different mechanisms in the simulations. The outline of this paper is as follows. Section 2 briefly describes the models and experimental design, while Sect. 3 gives an account of simulated AMOC changes. Sections 4 and 5 focus on two important contributors to AMOC changes, namely the At-lantic freshwater budget and the relative roles of AABW and NADW. Finally, Sect. 6 contains a discussion and conclu-sions.
2 Models and experimental design
The present intercomparison study includes five PMIP2 cou-pled AO simulations, see Table 1. Two of the GCMs (CCSM and HadCM) start from the cold state of a previous cou-pled LGM simulation, whereas one GCM (MIROC) is initial-ized from modern conditions. We include two Earth system Models of Intermediate Complexity (EMICs; ECBilt/CLIO and the UVic model), which both consist of a simplified at-mospheric component while the ocean/sea-ice component is similar in complexity to those in the AO-GCMs. The two EMIC runs start from a warm state, but have each been run for a few millennia under glacial forcings and boundary con-ditions.
The PMIP2 forcings for the LGM, which occurred ca. 21 000 years Before Present (21 kyr BP), are the changes in solar insolation and the reduced concentrations of green-house gas levels relative to the pre-industrial control state. Boundary conditions are the ICE-5G ice-sheet reconstruc-tion (Peltier, 2004) and the changes in land-sea mask con-sistent with ICE-5G. The lowering of sea level due to the presence of large continental ice sheets results in exposed land. Most notably in the circum-Atlantic area is the closure of Bering Strait. Vegetation and other land-surface charac-teristics are unchanged with respect to the control simula-tion. The forcings and boundary conditions are detailed on the PMIP2 website (http://www-lsce.cea.fr/pmip2/).
For some of the coupled AO models included in the present analysis earlier LGM simulations have been pub-lished, using the ICE-4G ice-sheet reconstruction (Peltier, 1994) in which the Fennoscandian ice sheet extended far east over northwestern Siberia. These so-called PMIP1.5 runs ex-ist for HadCM (Hewitt et al., 2001), UVic (Schmittner et al., 2002), the NCAR CCSM (Shin et al., 2003) and the Uni-versity of Toronto version of the CCSM model (CCSM1.4; Peltier and Solheim, 2003). In the present study, the most re-cent PMIP2 simulations are used for CCSM (Otto-Bliesner et al., 2006) and UVic. For HadCM we analyse both the PMIP2 and the earlier PMIP1.5 runs, as they exhibit a qual-itatively different AMOC response. In addition, we analyse the early MRI (Kitoh et al., 2001) and CCSM1.4 runs (Peltier and Solheim, 2003) as well as the “cold” glacial state found in CLIMBER-2 (Ganopolski et al., 1998). The latter model is an EMIC consisting of a zonally-averaged three-basin ocean component coupled to a statistical-dynamical atmosphere.
More information on the models can be found in the ref-erences given above for the LGM simulations and on the PMIP2 website. A number of the recent PMIP2 LGM simu-lations have not been published yet. For detailed information on these models we refer to the relevant publications on the control state (HadCM3M2 – Gordon et al., 2000; MIROC3.2 – Hasumi and Emori, 2004; ECBilt/CLIO – Vries and Weber, 2005; UVic – Weaver et al., 2001). The output data for these runs is available from the PMIP database, as indicated in Ta-ble 1, or directly from the modelling groups. All simulations
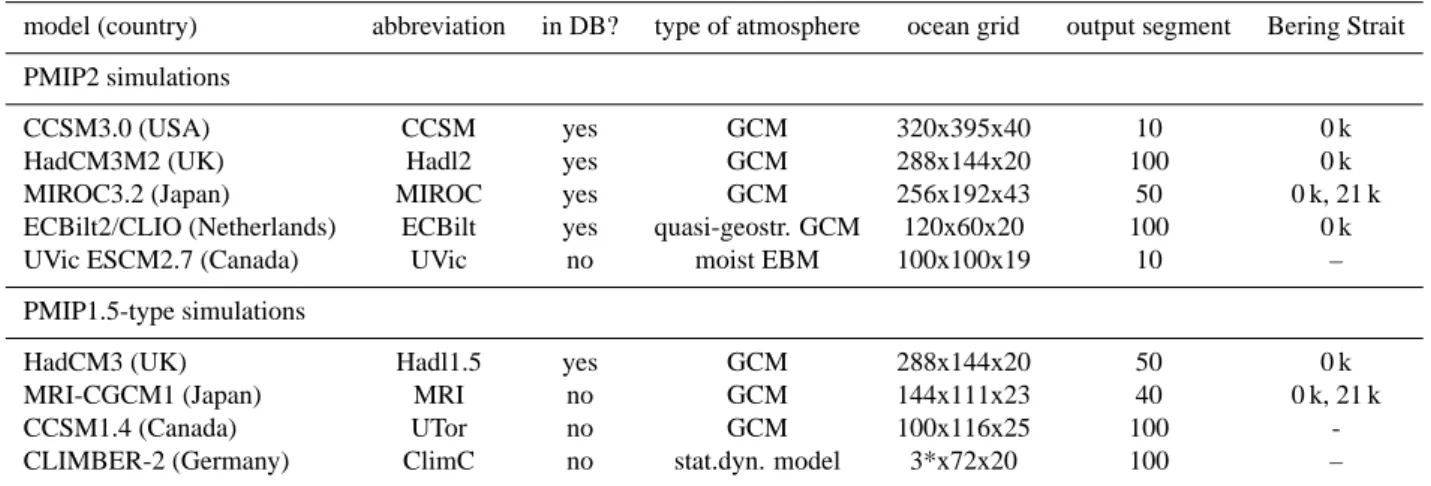
Table 1. The simulations that are included in the analysis, abbreviated model names, availability (yes/no) of model output in the PMIP
database, type of atmospheric component, the number of ocean horizontal grid points (lonxlat) and depth levels, the number of years at the end of each simulation used to compute the overturning streamfunction in Sect. 3 and the mean seasonal cycle in Sect. 4, and the time periods for which the model allows for transport through Bering Strait. The ocean component of CLIMBER-2 contains three zonally-averaged basins.
model (country) abbreviation in DB? type of atmosphere ocean grid output segment Bering Strait PMIP2 simulations
CCSM3.0 (USA) CCSM yes GCM 320x395x40 10 0 k
HadCM3M2 (UK) Hadl2 yes GCM 288x144x20 100 0 k
MIROC3.2 (Japan) MIROC yes GCM 256x192x43 50 0 k, 21 k
ECBilt2/CLIO (Netherlands) ECBilt yes quasi-geostr. GCM 120x60x20 100 0 k
UVic ESCM2.7 (Canada) UVic no moist EBM 100x100x19 10 –
PMIP1.5-type simulations
HadCM3 (UK) Hadl1.5 yes GCM 288x144x20 50 0 k
MRI-CGCM1 (Japan) MRI no GCM 144x111x23 40 0 k, 21 k
CCSM1.4 (Canada) UTor no GCM 100x116x25 100
-CLIMBER-2 (Germany) ClimC no stat.dyn. model 3*x72x20 100 –
have been integrated long enough to have allowed the deep ocean temperature to adjust to glacial forcings and boundary conditions. Remaining imbalances in the deep ocean salin-ity for the modern and the glacial climate are assessed in Sect. 4.2, where we compute the terms of the Atlantic fresh-water budget. Local freshfresh-water flux corrections are used in the MRI model (Kitoh et al., 2001), whereas ECBilt applies basin-scale corrections and a local correcion in the southern Atlantic (Vries and Weber, 2005).
Some variations exist among the PMIP simulations in the applied glacial boundary conditions, mostly the handling of ice-sheet melt and the adaptation of the river routing scheme. In all simulations except Hadl2 the maximum snow depth is set to a fixed limit (of 1–2 m) both for the control and the LGM state. When the snow depth exceeds this limit, excess snow melts and becomes runoff. In Hadl2 a spatially vary-ing freshwater correction is used to close the water budget, which was calibrated such as to compensate for the long-term accumulation of snow over the adjacent ice sheets. The cor-rection is prescribed for the high-latitude oceans (poleward of 40◦N in the Atlantic/Arctic ocean and poleward of 50◦S in the Southern ocean). For the Atlantic/Arctic basin this cor-rection is equivalent to a freshwater forcing of 0.033 Sv for the modern run and 0.054 Sv for the LGM run.
The present-day river pathways are used for the LGM in most models. Only Hadl2 and ECBilt adopt a slight modifi-cation. In the Hadl2 run the river pathways were altered ac-cording to the output from a river routing model forced with ICE-5G topography. In ECBilt those catchment areas that are covered by ice-sheets during the LGM are added to the catchment of a nearby non-covered river. The zonal-mean ocean component of CLIMBER-2 includes a parameteriza-tion of freshwater transport due to the subpolar gyre and sea-ice export in the northern Atlantic, which is modified for
glacial conditions resulting in reduced transport (Ganopol-ski and Rahmstorf, 2001). Mean ocean salinity includes an increase of 1 PSU in the LGM initial state of CCSM (Shin et al., 2003), but is left unchanged in all other PMIP runs.
3 The Atlantic overturning circulation
A number of characteristics of the Atlantic overturning circu-lation are given in Table 2 for the nine different simucircu-lations. For the control state the maximum of the main circulation cell associated with the formation of NADW varies between 14 and 27 Sv. The downward branch of this cell, as indi-cated by the latitude of the 10 Sv contour at the depth of the AMOC maximum, is located at 56–65◦N. This implies that deep water is formed reasonably close to the observed loca-tions (Dickson and Brown, 1994). The division between the main cell and the reversed deep cell associated with the intru-sion of AABW is characterised by the depth of the zero con-tour at the southern boundary of the Atlantic basin. It ranges between 2 and 3.5 km. It follows that a number of models overestimate the overturning strength, while the depth of the main cell is generally underestimated.
A relatively larger contribution of AABW as compared to NADW during the LGM was deduced on the basis of low δ13C values below 2000–2500 m depth in the
north-ern Atlantic by a number of authors (Duplessy et al., 1988; Labeyrie et al., 1992; Sarnthein et al., 1994; Curry and Oppo, 2005). However, passive tracers provide little information on oceanic volume transport (Legrand and Wunsch, 1995; Ruttberg and Peacock, 2006), as their end-member values are largely unknown. Better constraints are obtained from Pa/Th data, which indicate a slowdown of the AMOC dur-ing the LGM as compared to the present climate by ca. 30% and probably less (McManus et al., 2004). Most likely
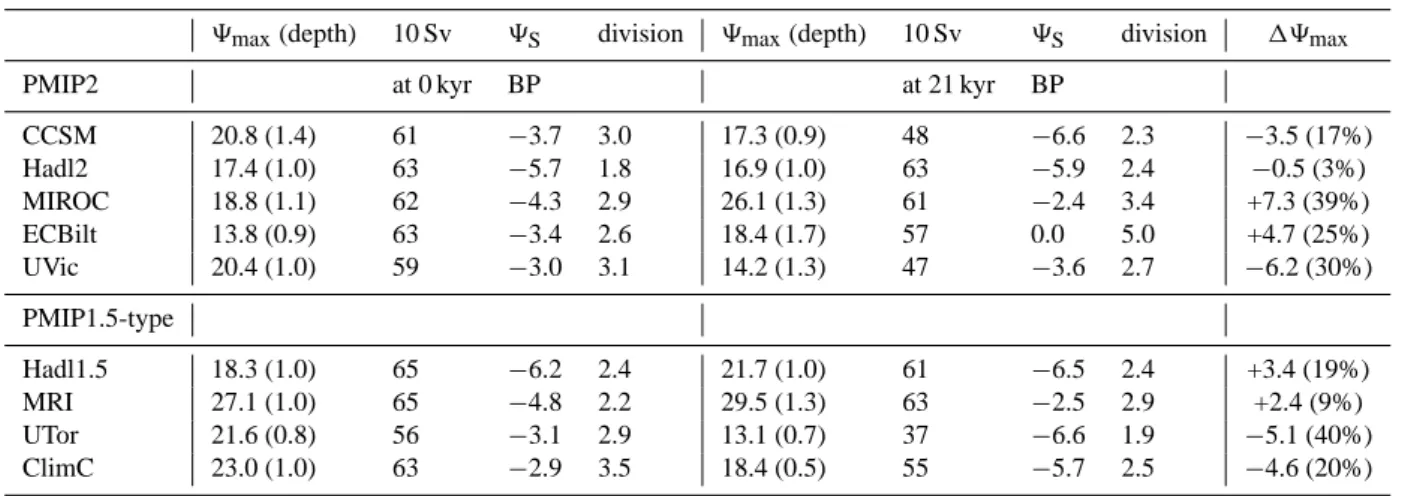
At-Table 2. Characteristics of the AMOC: the maximum strength 9max(in Sv) occurring at the given depth (in km), the latitude of the 10 Sv
contour at this depth, the maximum 9Sof the reversed cell associated with AABW at the southern boundary of the Atlantic basin and the
depth (in km) of the division between NADW and AABW at the southern boundary. The first four columns give values for 0 k, the second four those for 21 k and the last column gives the response in 9max(in Sv and as a percentage of the modern value).
9max(depth) 10 Sv 9S division 9max(depth) 10 Sv 9S division 19max
PMIP2 at 0 kyr BP at 21 kyr BP
CCSM 20.8 (1.4) 61 −3.7 3.0 17.3 (0.9) 48 −6.6 2.3 −3.5 (17%) Hadl2 17.4 (1.0) 63 −5.7 1.8 16.9 (1.0) 63 −5.9 2.4 −0.5 (3%) MIROC 18.8 (1.1) 62 −4.3 2.9 26.1 (1.3) 61 −2.4 3.4 +7.3 (39%) ECBilt 13.8 (0.9) 63 −3.4 2.6 18.4 (1.7) 57 0.0 5.0 +4.7 (25%) UVic 20.4 (1.0) 59 −3.0 3.1 14.2 (1.3) 47 −3.6 2.7 −6.2 (30%) PMIP1.5-type Hadl1.5 18.3 (1.0) 65 −6.2 2.4 21.7 (1.0) 61 −6.5 2.4 +3.4 (19%) MRI 27.1 (1.0) 65 −4.8 2.2 29.5 (1.3) 63 −2.5 2.9 +2.4 (9%) UTor 21.6 (0.8) 56 −3.1 2.9 13.1 (0.7) 37 −6.6 1.9 −5.1 (40%) ClimC 23.0 (1.0) 63 −2.9 3.5 18.4 (0.5) 55 −5.7 2.5 −4.6 (20%)
lantic deep-water was formed at more southern locations than today (Labeyrie et al., 1992). At present NADW is warm and saline, whereas AABW is cold and relatively fresh. Since AABW cannot cool below the freezing point, it must have been saltier than today to balance the higher density of NADW (Zahn and Mix, 1991). During the LGM the South-ern Ocean indeed contained the saltiest deep water (Adkins et al., 2002).
In four model simulations (CCSM, UVic, UTor and ClimC) the AMOC slows down during the LGM as com-pared to the control state, see Table 2. In those runs the max-imum overturning strength 9maxis reduced by 3–6 Sv (20–
40%). In Hadl2 there is a slight reduction (by 3%), while in four simulations (MIROC, ECBilt, Hadl1.5 and MRI) the AMOC strength increases by 2–7 Sv (10–40%). In all simu-lations the location of the downward branch shifts southward or remains at the same latitude. This suggests a southward shift (by 0–20 degrees) of the location of NADW forma-tion sites. A larger southward shift is found in those mod-els which have a larger decrease in the overturning strength. Also, a larger southward shift occurs in models that have a more southern location of the downward branch in the con-trol state.
The depth of the main circulation cell associated with the formation of NADW reduces (by 0.5–1 km) in those simula-tions that show a pronounced decrease in 9max. At the same
time the deep reversed cell intensifies in those models during the LGM and AABW extends to shallower depths, although remaining mostly at latitudes south of 40–50◦N. Models that have a deeper main cell in the control state show a stronger shoaling (or less deepening) during the LGM.
We thus find reasonable agreeement with the data in the re-sponse of the overturning strength and the depth of the main cell for about half of the participating models. All models re-duce the northward extent of the main cell during the LGM. We conclude at this point that there is a weak dependence of 19max on the control state: a relatively northern
loca-tion of the downward branch and a shallow main cell seem to favour an intensified AMOC during the LGM, which ex-tends far north and does not shoal. Other processes influenc-ing 19maxwill be discussed in the following two sections.
The different AMOC characteristics discussed here show, in general, a consistent pattern in their response to glacial conditions: a reduced overturning strength goes with a stronger southward shift of the downward branch and a shoaling of the main cell, together with an intensification of the deep reversed cell, and the reversed pattern of change occurs for increased overturning strength. Exceptions are the two experiments where 9S increases in absolute value
(Hadl2 and Hadl1.5), while the main cell deepens or remains at the same level. However, 19S is small in these runs. It
follows that in current climate models changes in the rela-tive contribution of AABW as compared to NADW on the one hand, and changes in oceanic volume transport on the other hand, are equivalent measures of the AMOC response to glacial conditions. Therefore we will discuss the response in only one characteristic in the following, namely that in the maximum overturning strength.
4 The Atlantic freshwater budget
As a first step in the analysis this section examines the re-sponse of net evaporation over the Atlantic basin, which has been hypothesized to strongly affect the response in AMOC strength (Schmittner et al., 2002). The water loss due to net
evaporation should be balanced by oceanic transports into the basin (Rahmstorf, 1996). We consider all terms in the fresh-water budget rather than just the surface freshfresh-water forcing, as any change in one term will affect the other terms of the budget in order to achieve equilibrium.
4.1 The terms of the freshwater budget
The Atlantic freshwater budget consists of a surface flux component (net evaporation) and several oceanic compo-nents (transport through the boundaries). Mass conservation imposes that in equilibrium all components should balance:
[Enet] =Mov+Maz+Mdif+MBS. (1)
Here the surface flux contribution [Enet] is the net
basin-integrated result of evaporation, precipitation, continental run-off, ice-melt and brine rejection. It also includes any water flux correction, if this is applied in a particular model. The meridional overturning component Movand azonal
com-ponent Maz of the oceanic freshwater transport through the
southern boundary are defined as (Rahmstorf, 1996; Weijer et al., 1999): Mov= − 1 S0 Z dz v(z)[< S(z) > −S0], (2) Maz= − 1 S0 Z dz v′(z)S′(z), (3)
where S0(34.7 PSU) is a reference salinity, the overbar and
the brackets < . > denote zonal integration and zonal av-eraging, respectively, and v′ and S′ are deviations from zonal means. The other terms of Eq. (1) represent contri-butions from diffusion at the southern boundary and trans-port through Bering Strait. The southern border of the At-lantic basin ranges from 31.5 to 34.5◦S in the different ocean
GCMs. It is taken to be at 40◦S in the CLIMBER-2
zonal-mean ocean component, as the closure coefficient between the meridional and zonal pressure gradient is reduced by three orders of magnitude at this latitude.
In the present analysis we compute Movand Mazfrom the
monthly output (mean seasonal cycle) of the 3-D fields of northward velocity v and ocean salinity S that are available in the PMIP database. The run length that is used to compute the mean seasonal cycle ranges from 10–100 yr. Compari-son for ECBilt with results based on 100-year timeseries of daily output indicates that this is fairly accurate. The total freshwater flux [Enet]is also available from the database, but
for most models not its separate components. The Bering Strait and diffusive contributions are determined as rest term
R=[Enet]−Mov−Mazfrom Eq. (1), assuming that the
fresh-water budget has equilibrated. In practice, R also contains a term that is associated with the drift in basin-mean salinity in the Atlantic basin. A number of models incorporate the freshwater flow through Bering Strait for the pre-industrial climate, either parameterised as a diffusive transport or ex-plicitly calculated. This transport is mostly set to zero in the LGM simulations, see Table 1.
The overturning component Movcan be understood as the
net freshwater transport carried by the AMOC. For negative values of Mov the AMOC exports freshwater, even though
the Atlantic is a net evaporative basin. The “excess” salt is removed by the azonal component Maz, which
incorpo-rates the export of surface and thermocline waters via the subtropical gyre. The direction of the overturning freshwater transport is hypothesized to be closely related to the dynam-ical regime of the AMOC (Rahmstorf, 1996): a northward transport (Movpositive) implies that only the circulation state
with NADW formation exists, while a southward transport (Movnegative) implies that a stable circulation state without
NADW formation is also possible. It is not trivial whether such a conceptual model can be applied to GCMs or the real world. However, numerical experiments with intermediate-complexity coupled models (Vries and Weber, 2005; Marsh et al., 2007) have confirmed this hypothesis by showing that the bifurcation between the monostable and bistable regime occurs at Mov≃0. Based on these studies, we propose Mov
as a diagnostic for the existence of a stable collapsed AMOC in an ocean model.
4.2 The pre-industrial and glacial freshwater budgets
For the present-day climate [Enet]is thought to carry a net
freshwater transport of 0.2-0.3 Sv out of the Atlantic basin (Pardaens et al., 2003). Net evaporation is positive in all models (Fig. 1), except MRI where it is just below zero. This term is overestimated by 0.1–0.3 Sv in most simula-tions. Using inverse-model data Weijer et al. (1999) have suggested that the present-day ocean has Maz=0.38 Sv and
Mov=−0.20 Sv. Most models underestimate the azonal term
Maz (it is zero by definition in ClimC which only resolves
the zonal-mean Atlantic circulation). This is due to an un-derestimation in most models of the zonal salinity contrast in the southern Atlantic ocean. As a result of high [Enet]and
low Maz, the overturning freshwater transport Movis
misrep-resented in most models. It is positive in all models, except ECBilt, which is most likely at variance with observations. In ECBilt the zonal salinity contrast in the southern Atlantic ocean is corrected by local flux corrections, which results in increased Maz and a negative value for Mov(Vries and
We-ber, 2005).
The rest term is small enough in most models to assume that diffusion and remaining imbalances play a secondary role. However, for some models the freshwater budget has not yet fully equilibrated. This implies that the budget terms might change when continuing these runs over longer inte-gration times and only preliminary conclusions can be drawn from the present results. Freshwater is not conserved in the UTor model, giving rise to a weak secular variation in mean ocean salinity (Peltier and Solheim, 2003).
The differences (LGM minus pre-industrial values) show a reduction of net evaporation in the cold LGM climate in all PMIP simulations, except Hadl1.5 and MRI. The changes are
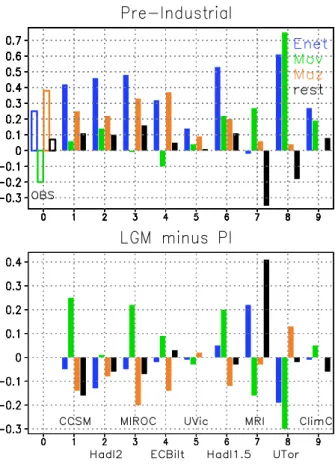
Fig. 1. The terms of the Atlantic freshwater budget as defined in
Eq. (1) for the pre-industrial control state (upper panel) and the dif-ference between the LGM and the control state (lower panel) for the nine PMIP simulations as indicated on the horizontal axis. The terms (in Sv) are net evaporation (blue), the overturning (green), azonal (orange) and rest term (black). Open bars denote “observed” values, see text.
most pronounced in Hadl2 and UTor, where [Enet]is reduced
by 0.1–0.2 Sv, and in MRI, where [Enet]increases by 0.2 Sv.
In all other models, there are larger changes in the ocean transport terms than in the surface flux term. The ocean overturning transport increases (considerably) in most mod-els, whereas the azonal component is mostly reduced during the LGM. Those models that close Bering Strait during the LGM mostly show a reduction in the amplitude of the rest term. It clearly follows from Fig. 1 (lower diagram) that the response in the Atlantic freshwater budget and the associated response in basin-scale salinity is primarily determined by oceanic processes. The surface freshwater flux (integrated over the basin) plays a secondary role. This implies that for most models basin-scale changes in, for example, precipita-tion, river run-off or sea-ice formation do not significantly affect the Atlantic freshwater budget.
4.3 The surface freshwater forcing as a function of latitude
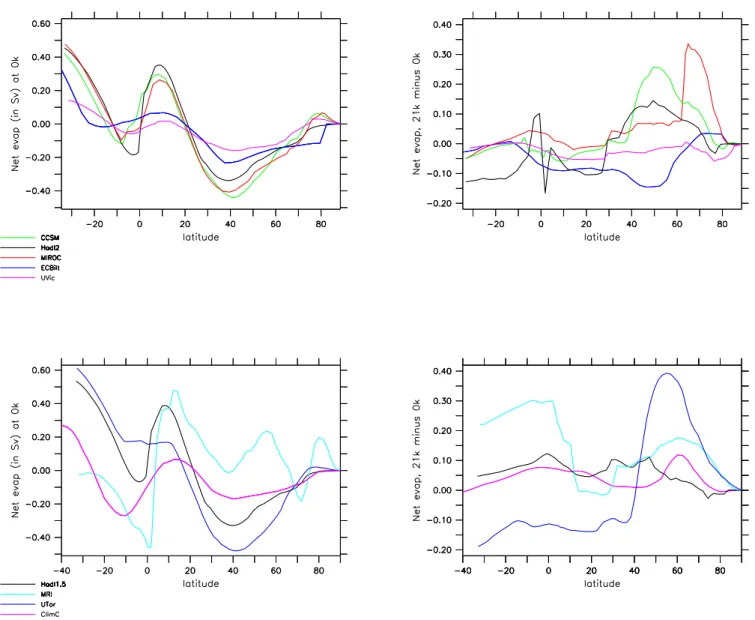
There is local net evaporation in the subtropics, while there is local net precipitation in the equatorial region and in the mid-high latitudes in all pre-industrial control simulations, broadly consistent with observations. The meridionally-integrated values are shown in Fig. 2 as a function of latitude. In the northern part of the Atlantic basin the integrated values are negative (net precipitation) up to ca. 20◦N in all
mod-els, except MRI. However, the basin-integrated value is posi-tive (net evaporation), because of the subtropical evaporation zones which dominate over the net precipitation at mid-high latitudes and in the equatorial region. The EMICs under-estimate the amplitude of latitudinal variations, but capture the basic pattern. In the UTor run [Enet] is overestimated
considerably, because the tropical precipitation belt is almost completely absent in this model. The latitudinal variations of net evaporation generated by the atmospheric part of the MRI model are basically similar to the other models, but the local flux adjustment is quite large especially over the north-ern Atlantic. The latitudinal profile of the surface freshwater forcing given to the OGCM is, therefore, more complex in the MRI model.
Latitudinal response patterns (Fig. 2) show a southward shift of the northern Atlantic net precipitation in six mod-els (CCSM, Hadl2, MIROC, MRI, UTor and ClimC), with decreased high-latitude net precipitation and increased mid-latitude net precipitation during the LGM as compared to the control run. However, in most models the net effect is small. Only in the UTor simulation there is a clear increase of the mid-high latitude net precipitation during the LGM. Of the three other models ECBilt and UVic show an increased net precipitation over the northern Atlantic, while there is little change in the Hadl1.5 simulation. Over the equatorial and southern Atlantic ocean all models seem to show a latitudinal pattern of reduced subtropical evaporation as well as reduced tropical precipitation, with amplitudes varying among the different models. The basin-integrated value [Enet]is thus
the result of a subtle balance between different processes. It shows little change during the LGM (less than 0.05 Sv) in all simulations except Hadl2, MRI and UTor. The latitudi-nal distribution in Hadl2 indicates that reduced subtropical evaporation in the colder LGM climate plays a major role in reducing [Enet]in this model, while both reduced subtropical
evaporation and increased mid-high latitude precipitation are important for UTor. In the MRI simulation tropical precip-itation reduces considerably during the LGM, so that [Enet]
increases.
4.4 The ocean transport through the southern boundary
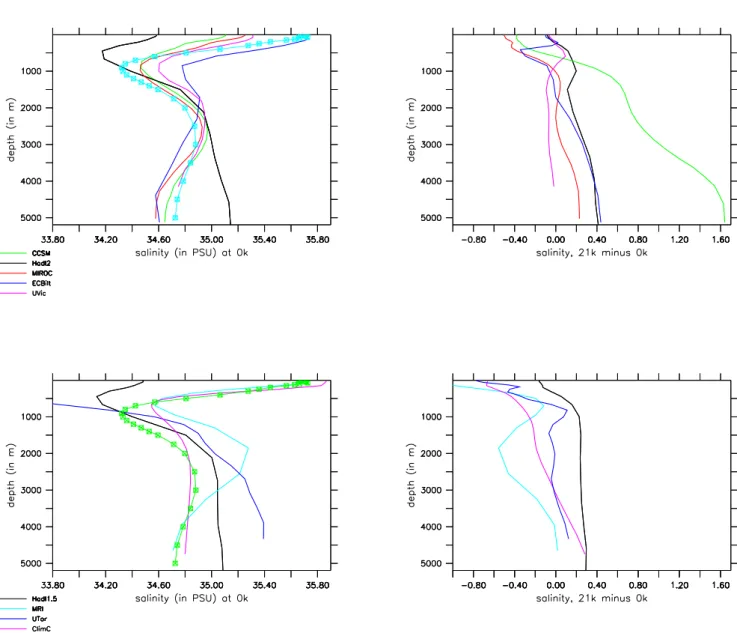
Simulated salinity profiles at the southern border of the At-lantic ocean are shown in Fig. 3. All models, except UTor, simulate very saline surface and thermocline waters, below which relatively fresh Antarctic intermediate waters lie. The
Fig. 2. Meridionally-integrated net evaporation over the Atlantic basin as a function of latitude for the pre-industrial control state (upper
left panel) and the difference between the LGM and the control state (upper right panel) for the PMIP2 simulations: CCSM (green), Hadl2 (black), MIROC (red), ECBilt (dark blue) and UVic (purple). Same for the PMIP1.5-type simulations (lower panels): Hadl1.5 (black), MRI (light blue), UTor (dark blue) and ClimC (purple). The integration starts at 90◦N (compare Fig. 1 for the values at the southern border).
upper “limb” of the AMOC consists of these waters flow-ing northward while undergoflow-ing transformations due to, for example, the surface freshwater forcing. The lower “limb”, NADW flowing southward, lies roughly between 1000 m and 3000 m depth (compare Table 2). In most models it is more saline than the upper limb for the modern climate, as indicated by the positive value of Mov (the AMOC imports
freshwater). Antarctic bottom water is slightly fresher than NADW in most PMIP2 simulations, but has varying ity in PMIP1.5 runs. For comparison the observed salin-ity profile (Levitus et al., 1994) is shown as well in Fig. 3. Most models capture the vertical structure seen in the data rather well, although the sharp contrast between surface and
thermocline waters is generally underestimed. The salinity contrast between AABW and NADW is misrepresented in a number of models as compared to the data. In these simula-tions NADW and AABW have similar salinity (Hadl1.5 and ClimC) or AABW is even more saline than NADW (Hadl2, UTor).
During the LGM most models simulate somewhat fresher surface and thermocline waters and more saline water at deeper levels. The response is most pronounced in CCSM, which simulates an increase of 0.5-1.7 PSU in Atlantic water masses below ca. 1000 m (not taking the global-mean increase by 1 PSU in this model into account). Most models simulate a stronger increase in salinity in AABW
Fig. 3. The zonal-mean salinity at the southern border of the Atlantic basin as a function of depth for the control state (upper left panel) and
the difference between the LGM and the control state (upper right panel) for the PMIP2 simulations. Same for the PMIP1.5-type simulations (lower panels). Color coding as in Fig. 2. Levitus salinity profiles (left panels) are marked by squares. The global-mean 1 PSU increase for the LGM in the CCSM model has been subtracted from the model output in order to facilitate comparison with the other models.
than in NADW. In the ClimC simulation AABW becomes more saline, while NADW even freshens. In some models (MIROC, UVic, UTor) changes in deep-ocean salinity are minor. The MRI model shows a freshening at all levels.
Most models simulate a larger Mov during the LGM,
be-cause the fresh upper limb of the AMOC freshens and the saline lower limb becomes more saline. This effect is so strong, that a larger Mov is even found in those models that
simulate a decrease in the overturning strength. It can be amplified by a strong intensification of the AMOC as, for ex-ample, in the MIROC run. Only in case of a pronounced de-crease in 9maxthere is a decrease in the overturning transport
term (UVic, UTor). In the MRI run Movdecreases, because
the lower AMOC branch freshens.
Significant contributions to Mazcome from depths above
ca. 700 m. This is in accordance with the longitudinal vari-ations of salinity being appreciable only at those depths. All models exhibit a salinity maximum near the South Ameri-can continent, resulting in a positive Mazfor the control
cli-mate. The azonal component becomes smaller during the LGM compared to modern in most models. This is mainly due to a reduced zonal contrast in the southern Atlantic ocean salinity, while the gyre circulation intensifies. In two mod-els (UVic and UTor) the azonal salinity contrast becomes stronger, resulting in an enhanced azonal transport.
4.5 Preliminary conclusions
Changes in the overturning freshwater transport are clearly not a good diagnostic for changes in AMOC strength, as
1Mov is mostly positive or close to zero irrespective of
19max. Also, we cannot attribute the change in AMOC
strength to one of the other components of the freshwater budget. It seems that none of these terms can be seen as the main driver for the changes in Atlantic overturning. So we re-ject the earlier hypothesis that changes in Atlantic net evapo-ration primarily cause changes in Atlantic overturning, when comparing modern and LGM values. Clearly, the Atlantic overturning does not operate in isolation and is not forced lo-cally by the Atlantic freshwater budget. The most likely can-didate from outside to drive changes in the Atlantic overturn-ing seems to be the Southern Ocean overturnoverturn-ing cell involv-ing AABW formation. There is a remarkable anticorrelation between the response in this cell and that in the overturning strength (compare Table 2). In the next section we will evalu-ate the interaction between the Southern Ocean and Atlantic overturning cells in more detail.
The response of the overturning transport term to glacial conditions does give an indication of the dynamical regime of the AMOC. During the LGM most models have positive
Mov, implying that they are in the monostable regime (on
the thermohaline branch in the hysteresis diagram). Monos-tability of the glacial AMOC was already demonstrated by Ganopolski and Rahmstorf (2001) in the CLIMBER-2 model, where a collapsed LGM state does not exist (but which allows for two closely-related modes with an active AMOC during the LGM). Also, the glacial AMOC was found to be monostable in experiments with an ocean-only model by Prange et al. (2002). The present results suggest that most models exhibit similar behavior.
For two models (ECBilt and UVic) Mov≃0 for the LGM
state. Based on this value, we hypothesize that in these models the LGM state is very close to the bifurcation point between the monostable regime (thermohaline branch) and bistable regime (thermal branch). This might cause a strongly nonlinear response to the imposed LGM forcings and boundary conditions.
5 Southern Ocean controls versus Atlantic processes
In this section we examine the AMOC response during the LGM, focussing on the role of processes within the At-lantic basin versus those originating in the Southern Ocean. To characterise the controlling processes within the Atlantic basin, we examine the response in both net evaporation [Enet]
and the density difference ρAtl between the northern and
southern ends of the Atlantic basin. The density difference, which is ultimately generated by local fluxes of heat and freshwater at the ocean surface, has been found to scale lin-early with the overturning strength in a number of modelling
studies (Hughes and Weaver, 1994; Rahmstorf, 1996; Thorpe et al., 2001). If the AMOC response is controlled by Atlantic processes, then one expects 19maxto scale with 1[Enet]and
1ρAtl. On the other hand, if the competition between NADW
and AABW plays a major role (Ganopolski et al., 1998; Shin et al., 2003) such scaling behavior is less likely.
In the following the Atlantic north-south density differ-ence ρAtl is computed as the difference between the
zonal-and depth mean density in the northern Atlantic (at 55◦N) and at the southern end of the Atlantic basin (taken at 30◦S in all models). The former is assumed to characterise the density of NADW at its source region, as the location of the sinking branch of the meridional overturning cell associated with NADW is roughly at this latitude. The depth average is taken over depths between the surface and 1500 m. The latter depth level lies within the body of southward flow-ing NADW for most models at the two time periods. This choice of level of integration was found to be adequate for the HadCM3 model (Thorpe et al., 2001), while no sensi-tive dependence of the scaling relation on the depth level was found by Rahmstorf (1996). The zonal- and depth mean den-sities at the northern and southern ends of the Atlantic basin are shown for each simulated control state in Fig. 4 (upper left panel), together with estimates based on observed tem-perature and salinity data (Levitus and Boyer, 1994; Levitus et al., 1994). The majority of models lies reasonably close to the observed data, with the northern values considerably larger than the southern ones.
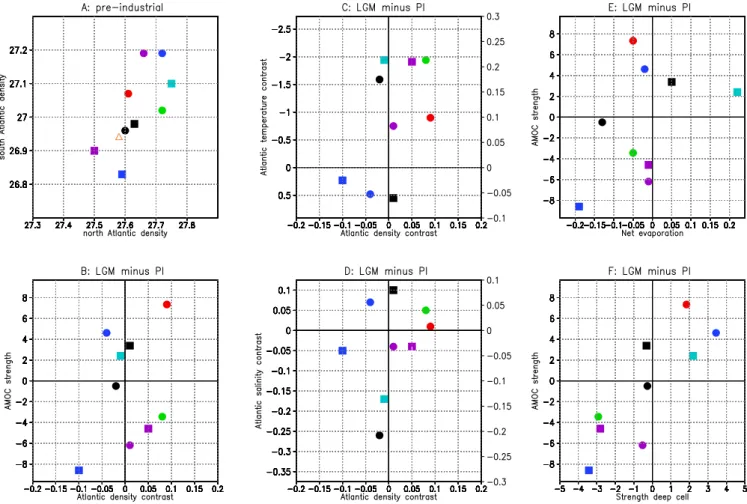
Changes in the overturning strength scale with 1ρAtl in
only two out of nine models (Fig. 4, lower left panel): an in-creased ρAtlgives rise to a stronger overturning in MIROC,
while a decreased ρAtland reduced 9maxare found in UTor.
In the seven other models, the response in the density differ-ence is either small (Hadl2, UVic, Hadl1.5 and MRI) or it works against the response in overturning strength (CCSM, ECBilt and ClimC). Examination of the north-south temper-ature and salinity differences (Fig. 4, middle panels) does not show a consistent response among the different models. The northern part of the Atlantic basin cools more than the southern part in some models, and vice versa in others. Also, the northern Atlantic freshens in some models and becomes more saline in others compared to the southern part. The rel-ative contribution of changes in temperature and salinity to changes in the north-south density difference is indicated in the figure (right-hand scale). For most models temperature and salinity effects are equally important.
Changes in the overturning strength are plotted against changes in net evaporation in Fig. 4 (upper right panel). There is mostly a clear relationship between the sign of
19maxand 1[Enet]. However, the amplitude of changes in
AMOC strength does not seem to depend much on the am-plitude of changes in [Enet]. These results indicate that small
changes in the freshwater forcing (of 0.05 Sv and less) dur-ing the LGM as compared to modern are not decisive for the simulated AMOC response. However, a strong reduction or
Fig. 4. Analysis of processes within the Atlantic basin for the PMIP2 (circles) and PMIP1.5 (squares) simulations: CCSM (green), Hadl2
(black), MIROC (red), ECBilt (dark blue), UVic (purple), Hadl1.5 (black), MRI (light blue), UTor (dark blue) and ClimC (purple). (A) The density at the southern end of the Atlantic basin versus that at the northern end for the pre-industrial control runs, with an estimate based on the Levitus data (orange triangle) and (B) The response in AMOC strength versus that in the Atlantic density contrast. The middle panels (C and D) give the response in the Atlantic temperature and salinity contrast (left-hand scale in K and PSU) versus that in the density contrast. The separate impact of the temperature and salinity response on the density response is estimated using the equation of state with a fixed salinity of 34.7 PSU and a fixed temperature of 275 K, respectively (right-hand scale in kg/m3; the vertical range is the same in both panels). The right-hand panels (E and F) give the response in AMOC strength versus that in net evaporation over the Atlantic basin (E) and the strength of the deep reversed cell (F). Densities are given in kg/m3(relative to a reference value of 1000), circulation strengths and evaporation in Sv.
increase in [Enet](as in Hadl2, MRI and UTor) clearly
con-tributes toward a MOC reduction or increase.
As already discussed in Sect. 3, the strength of the deep reversed cell increases (decreases) consistently with reduced (increased) 9max for the LGM climate as compared to the
control climate in all simulations except Hadl1.5 (lower right panel). This strongly suggests that changes in AABW den-sity play an important role in controlling changes in the AMOC strength. Therefore, we now consider changes in the density of AABW at its source latitude and associated changes in the reversed circulation cell at depths below ca. 3000 m in the Atlantic ocean. The density of AABW is char-acterised here by the zonal-mean density at 55◦S averaged over all depth levels. The density contrast ρSNis defined as
the density difference between AABW (at 55◦S) and NADW
(at 55◦N).
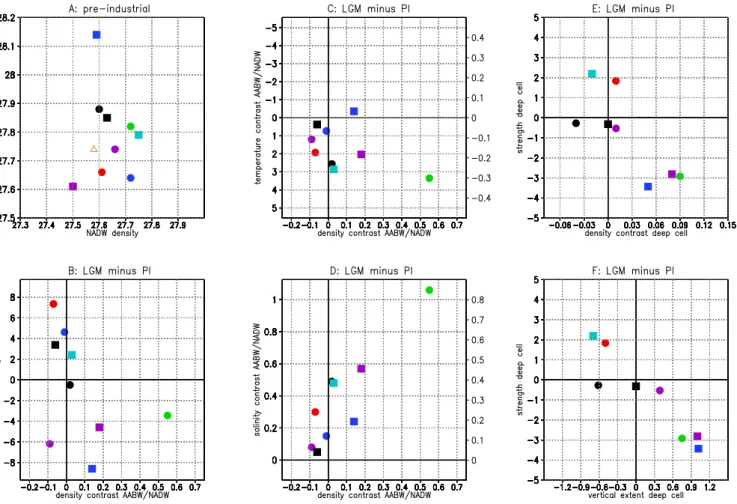
The AABW and NADW densities vary greatly among the different models in the control state (Fig. 5, upper left panel). Very dense AABW (at its source region) is found in those models that have relatively saline AABW at the southern end of the Atlantic basin (Hadl2 and UTor; compare Fig. 3), while in one model (ECBilt) NADW is more dense than AABW (both at their source region). Observations suggest slightly more dense AABW as compared to NADW, as indi-cated in the Figure.
Changes in 9maxare shown versus those in ρSNin Fig. 5
(lower left panel). The response in the density contrast is found to be a fairly good predictor for the response in
At-Fig. 5. Analysis of Atlantic processes versus those originating in the Southern Ocean. Colors, symbols and units as in At-Fig. 4. (A) The density
of AABW at its source region versus that of NADW at its source region for the pre-industrial control runs, with an estimate based on the Levitus data (orange triangle) and (B) The response in AMOC strength versus that in the density contrast between AABW and NADW. The middle panels (C and D) give the response in the temperature and salinity contrast between AABW and NADW (left-hand scale in K and PSU) versus that in the density contrast. The estimated impact on the density contrast is derived as in Fig. 4 (right-hand axis in kg/m3). The right-hand panels (E and F) analyse the deep reversed cell associated with the formation of AABW, giving the response in the strength of the deep cell versus that in the deep meridional density contrast (E) and the vertical extent of the deep cell (F).
lantic overturning strength in most models that have a sig-nificant change in ρSN. A relative increase in AABW
den-sity is found in CCSM, UTor and ClimC, together with an increased 9S and decreased 9max. The reverse is seen in
MIROC and Hadl1.5, although changes in ρSNare relatively
small here. Three models (Hadl2, ECBilt and MRI) have negligible 1ρSN. In one model (UVic) the density contrast
reduces, while 9maxreduces as well. The response in
tem-perature and salinity contrast between AABW and NADW (middle panels) is more consistent than in case of the Atlantic north-south differences. During the LGM AABW becomes relatively more saline in all models, while it cools less than NADW in all models except one. The opposing effects of a relative temperature increase and salinity increase result in an increased density contrast in some models, but decreased contrast in others. Salinity changes dominate over
tempera-ture changes in those models that show a substantial increase in ρSN(CCSM, UTor and ClimC). In the other models
sim-ulated temperature and salinity changes have a comparable impact on the density contrast.
Table 3 gives a summary of the scaling relationships be-tween 19maxand the response in processes within the
At-lantic basin as well as originating from the Southern Ocean. Here a Yes indicates a positive correlation, a No a negative correlation and a blank the absence of a significant response in the process under examination. Although a correlation cannot prove a causal relationship, we can at least deduce a strong indication for such a relationship from it. This is es-pecially true, if one process shows a positive correlation and the other processes show no response or a negative correla-tion. We conclude here that in a number of models only one process plays a dominant role, while more than one process
Table 3. Overview of the scaling relationships between 19max
(the response in the AMOC strength) and 1[Enet](the response in
net evaporation), 1ρAtl(the response in the Atlantic north-south
density contrast) and 1ρSN (the response in the density contrast
between AABW and NADW), see Sect. 5 for a discussion. The columns 2–4 give a Yes (No) in the case of a positive (negative) correlation and a blank if there is no significant response. The fifth column summarizes the processes that apparently control 19max
for each model.
1[Enet] 1ρAtl 1ρSN control
PMIP2
CCSM No Yes ρSN
Hadl2 Yes [Enet]
MIROC Yes Yes ρAtl+ρSN
ECBilt No
UVic No
PMIP1.5
Hadl1.5 Yes ρSN
MRI Yes [Enet]
UTor Yes Yes Yes [Enet]+ρAtl+ρSN
ClimC No Yes ρSN
is at work in two models (MIROC and UTor) and none of the examined processes is decisive in two other models (EC-Bilt and UVic). The response in the density contrast between AABW and NADW plays an important role in five out of nine models.
Finally we consider the response in the intensity of the deep reversed cell itself (Fig. 5, right-hand panels). It is found to scale well with the response in both the deep merid-ional density contrast and the vertical extent of the deep cell, a relationship which has been derived theoretically by Ka-menkovich and Goodman (2000). Here the meridional den-sity contrast is defined as the zonal- and depth mean denden-sity at 30◦S minus that at 25◦N, taking the depth average over the lower 1000 m for each model. These strong scaling re-lationships again point to the deep reversed cell as a driving process for the AMOC response to glacial conditions.
Factors that are thought to be important for setting AABW transport are surface salinity at the Antarctic coast (Paul and Schaeffer-Neth, 2003) and mixing by mesoscale oceanic ed-dies as parameterised by diffusion (Kamenkovich and Good-man, 2000). Three models show a substantial increase in the strength of AABW transport in the present analysis. The salinity contrast between AABW and NADW was found to play a key role (Fig. 5). One of these models shows a salinity increase of glacial AABW at its source region (CCSM), one a freshening of glacial NADW at its source region (UTor) and one seems to be driven by the combined effect of north-ern freshening and southnorth-ern salinification during the LGM (ClimC). Interestingly, these models span the full range of ocean model resolution considered here. This implies
vary-ing importance of mixvary-ing by diffusion. It is thus not possi-ble to relate the response in AABW transport uniquely to an Antarctic source or to the diffusivity in the numerical ocean model.
6 Discussion and conclusions
This paper analyses the response of the Atlantic overturn-ing circulation to LGM forcoverturn-ings and boundary conditions in nine PMIP coupled model simulations. Central in the anal-ysis is the question of which mechanism ultimately controls the AMOC response: changes in net evaporation over the At-lantic basin, local processes within the AtAt-lantic basin as ex-pressed by the density difference between the northern and southern ends, or the deep overturning cell associated with the formation of AABW in the Southern Ocean. The results are summarised in Table 3.
In five out of nine simulations (CCSM, MIROC, Hadl1.5, UTor and ClimC) the competition between NADW and AABW is found to play an important role, either favour-ing an increase or a decrease in overturnfavour-ing strength. In the two simulations, which have the largest response in ρSN
(CCSM and ClimC), the controlling process originates ex-clusively in the competition between southern and northern water masses. The response in the Atlantic density contrast
ρAtlopposes the AMOC response in these two models, while
net evaporation remains close to modern values during the LGM. In the three other models, the response in the Atlantic density contrast ρAtlplays a role too (MIROC and UTor) or
the response in ρSNis relatively small (Hadl1.5). In the
for-mer two models 1ρSNand 1ρAtlhave the same sign, so that
it is not possible to distinguish between these two factors. In one of these simulations (Utor) 1[Enet]also contributes
to-ward the simulated AMOC response, whereas it is small in MIROC and Hadl1.5. In two simulations (Hadl2 and MRI)
1[Enet]seems to be the sole controlling process. Finally, for
two simulations (ECBilt and Uvic) it is not possible to iden-tify which process dominates the simulated AMOC response. We thus find that 1ρSNis a major controlling factor. It
is determined by the balance between a relative increase in AABW salinity versus a relative warming (less cooling) as compared to NADW during the LGM. More saline AABW during the LGM is consistently found in all simulations, but the amplitude of the signal varies considerably. A strong in-crease as suggested by Adkins et al. (2002) is only found in CCSM. In this model the salinity increase is attributed to sea-ice expansion rather than changes in local evaporation and precipitation (Shin et al., 2003). Further research is needed to establish whether this mechanism is unique to the CCSM model or whether it is also present in other models, but less active than in CCSM.
It is remarkable that net evaporation over the Atlantic basin only plays a dominant role in two simulations. In one of these (Hadl2) the reduction in [Enet] during the LGM is partly
due to an imposed freshwater flux at high northern latitudes. In the earlier HadCM run (Hadl1.5), which did not contain such a freshwater forcing, the AMOC response is linked to changes in density contrasts rather than 1[Enet]. Although
evaporation decreases in the colder LGM climate, precipita-tion and run-off also decrease resulting in a small net effect in most simulations. Interestingly, most models that have a AMOC reduction during the LGM show a decrease in net precipitation over the northern Atlantic ocean. This implies that it is definitely not a high-latitude freshening of the At-lantic basin which causes the glacial AMOC reduction.
There seems to be some dependence of the glacial AMOC response on the accuracy of the control state. Models that have a too shallow main circulation cell in the Atlantic basin do not show further shoaling during the LGM. Also, a south-ern location of the downward branch seems to favour a stronger southward shift during the LGM. A few models have too dense AABW in their control simulation compared to ob-servations. This clearly affects the response to glacial condi-tions, resulting in a strong presence of AABW in the Atlantic basin during the LGM.
It is not possible to pinpoint the controlling mechanism in two simulations (ECBilt and UVic). Changes in the con-trolling factors discussed above are too small to attribute the relatively large AMOC changes found in these two models to any of them. In the case of ECBilt the very low density of AABW in the control climate may play a role, favouring an intensified glacial AMOC. Both models have an overturning freshwater transport close to zero during the LGM, indicating that these models are close to the bifurcation point where the collapsed AMOC exists (Rahmstorf, 1996: Vries and Weber, 2005). This may give rise to a strongly nonlinear response, in agreement with the large AMOC changes associated with the small changes in the controlling factors found in these models.
Summarising, we find a variety of AMOC responses to glacial conditions. About half of the models shows a re-sponse that is consistent with the classical view of a stronger glacial AABW inflow into the Atlantic basin and a reduced NADW formation. However, sites of proxy data are sparsely distributed and the interpretation of the data is difficult (see Roche et al. (2006) for an overview). Therefore, this might be revised as more data becomes available and better inter-pretation techniques are developed. On the modelling side, existing climate models still have relatively coarse resolution and most have fixed diffusion coefficients, while they do not take changes in the energy available for mixing due to winds and tides into account. Inclusion of a physically more realis-tic representation of mixing might modify the glacial AMOC response in climate models (Wunsch, 2006). Considering these caveats, we conclude that the diversity of AMOC re-sponses indicates disagreement with the data for a number of state-of-the art climate models. Although the competition be-tween water masses of southern and northern origin emerges as a major controlling factor, other factors (net evaporation,
accuracy of the control state) cannot be ruled out. Based on these results, it seems inconclusive whether existing climate models have the accuracy to simulate AMOC changes in re-sponse to future increases in greenhouse gas levels.
Acknowledgements. The Laboratoire des Sciences du Climat
et de l’Environnement (LSCE) is acknowledged for collecting and archiving the model output. The PMIP2 Data Archive (http://www-lsce.cea.fr/pmip2/) is supported by CEA, CNRS, the EU project MOTIF (EVK2-CT-2002-00153) and the Programme National d’Etude de la Dynamique du Climat (PNEDC). The analyses were performed using output available at 29-08-2006. This research was partly funded by the MOTIF project. Michael Kliphuis is thanked for developing the budget analysis software. We thank A. Paul and one anonymous referee for constructive and useful reviews.
Edited by: J. Hargreaves
References
Adkins, J. F., McIntyre, K., and Schrag, D. P.: The salinity, temper-ature and δ18O of the glacial deep ocean, Science, 298, 1769– 1773, 2002.
Curry, W. B. and Oppo, D. W.: Glacial water mass geometry and the distribution of δ13C of 6CO2in the western Atlantic ocean, Paleoceanography, 20, 1017–1028, 2005.
Dickson, R. R. and Brown, J.: The production of North Atlantic Deep Water: Sources, rates and pathways, J. Geophys. Res., 99(C6), 12 319–12 341, 1994.
Duplessy, J. C., Shackleton, N. J., Fairbanks, R. G., Labeyrie, L., Oppo, D. W., and Kallel, N.: Deep water source variations during the last climatic cycle and their impact on the global deep water circulation, Paleoceanography, 3, 343–360, 1988.
Ganopolski, A. and Rahmstorf, S.: Rapid changes of glacial climate simulated in a coupled model, Nature, 409, 153–158, 2001. Ganopolski, A., Rahmstorf, S., Petoukhov, V., and Claussen, M.:
Simulation of modern and glacial climates wih a coupled global model of intermediate complexity, Nature, 391, 351–356, 1998. Gordon, C., Cooper, C., Senior, C. A., Banks, H., Gregory, J. M.,
Johns, T. C., Mitchell, J. F. B., and Wood, R. A.: The simulation of SST, sea-ice extents and ocean heat transports in a version of the Hadley Centre coupled model without flux adjustments, Clim. Dyn., 16, 147–168, 2000.
Gregory, J., Dixon, K. W., Stouffer, R. J., Weaver, A. J., Driess-chaert, E., Eby, M., Fichefet, T., Hasumi, H., Hu, A., Jung-claus, J. H., Kamenkovich, I. V., Levermann, A., Montoya, M., Murakami, S., Nawrath, S., Oka, A., Solokov, A. P., and Thorpe, R. B.: A model intercomparison of changes in the At-lantic thermohaline circulation in response to increasing atmo-spheric CO2 concentration, Geophys. Res. Lett., 32, L12703, doi:10.1029/2005GL023209, 2005.
Hargreaves, J. C., Abe-Ouchi, A., and Annan, J. D.: Linking glacial and future climates through an ensemble of GCM simulations, Clim. Past Discuss., 2, 951–977, 2006,
http://www.clim-past-discuss.net/2/951/2006/.
Hasumi, H. and Emori, S.: K-1 coupled model (MIROC) descrip-tion, K-1 technical report 1, Center for Climate System Research, University of Tokyo, 2004.
Hewitt, C. D., Broccoli, A. J., Mitchell, J. F., and Stouffer, R. J.: A coupled model study of the last glacial maximum: was part of the North Atlantic relatively warm?, Geophys. Res. Lett., 28, 1571–1574, 2001.
Hughes, T. M. C. and Weaver, A. J.: Multiple equilibria of an asym-metric two-basin ocean model, J. Phys. Oceanogr., 24, 619–637, 1994.
Kageyama, M., Laine, A., Abe-Ouchi, A., Braconnot, P., Cortijo, E., M. Crucifix, M., de Vernal, A., Guiot, J., Hewitt, C. D., Ki-toh, A., Marti, O., Ohgaito, R., Otto-Bliesner, B., Peltier, W. R., Rosell-Mele, A., Vettoretti, G., Weber, S. L., and MARGO Project Members: Last Glacial Maximum temperatures over the North Atlantic, Europe and western Siberia: a compari-son between PMIP models, MARGO sea-surface temperatures and pollen-based reconstructions, Quatern. Sci. Rev., 25(17–18), 2082–2102, 2006.
Kamenkovich, I. V. and Goodman, P. J.: The dependence of AABW transport in the Atlantic on vertical diffusivity, Geophys. Res. Lett., 27, 3739–3742, 2000.
Kitoh, A., Murakami, S., and Koide, H.: A simulation of the Last Glacial Maximum with a coupled atmosphere-ocean GCM, Geo-phys. Res. Lett., 28, 2221–2224, 2001.
Labeyrie, L. D., Duplessy, J.-C., Duprat, J., Juillet-Leclerc, A., Moyes, J., Michel, E., Kallel, N., and Shackleton, N. J.: Changes in the vertical structure of the North Atlantic ocean between glacial and modern times, Quatern. Sci. Rev., 11, 401–413, 1992. LeGrand, P. and Wunsch, C.: Constraints from paleotracer data on the North Atlantic circulation during the last glacial maximum, Paleoceanography, 6, 1011–1045, 1995.
Levitus, S. and Boyer, T. P.: World Ocean Atlas 1994 Volume 4: Temperature. NOAA ATLAS NESDIS 4. U.S. Government Printing Office, 1994.
Levitus, S., Burgett, R., and Boyer, T. P.: World Ocean Atlas 1994 Volume 3: Salinity. NOAA ATLAS NESDIS 3. U.S. Government Printing Office, 1994.
Marsh, R., Hazeleger, W., Yool, A., and Rohling, E. J.: Stability of the Thermohaline Circulation under millennial CO2forcing and two alternative controls on Atlantic salinity, Geophys. Res. Lett., in press, 2007.
Masson-Delmotte, V., Kageyama, M., Braconnot, P., Charbit, S., Krinner, G., Ritz, C., Guilyardi, E., Jouzel, J., Abe-Ouchi, A., Crucifix, M., Gladstone, R. M., Hewitt, C.D., Kitoh, A., Legrande, A.N., Marti, O., Merkel, U., Motoi, T., Ohgaito, R., Otto-Bliesner, B., Peltier, W. R., Ross, I., Valdes, P.J., Vettoretti, G., Weber, S. L., Wolk, F., and Yu, Y.: Past and future po-lar amplification of climate change: climate model intercom-parison and ice-core constraints, Clim. Dyn., 26(5), 513–529, doi:10.1007/s00382-005-0081-9, 2005.
McManus, J., Francois, R., Gherardi, J., Keigwin, L., and Brown-Leger, S.: Collapse and rapid resumption of Atlantic meridional circulation linked to deglacial climate changes, Nature, 428, 834–837, 2004.
Otto-Bliesner, B., Brady, E. C., Clauzet, G., Tomas, R., Levis, S., and Kothalava, Z.: Last Glacial Maximum and Holocene climate in CCSM3, J. Clim., 19, 2526–2544, 2006.
Pardaens, A. K., Banks, H. T., Gregory, J. M., and Rowntree, P. R.: Freshwater transports in HadCM3, Clim. Dyn., 21, 177–195, 2003.
Paul, A. and Schaefer-Neth, C.: Modeling the water masses of the
Atlantic Ocean at the Last Glacial Maximum, Paleoceanography, 18(3), 1058, doi:10.1029/2002PA000783, 2003.
Peltier, W. R.: Ice age paleotopography, Science, 265, 195–201, 1994.
Peltier, W. R.: Global glacial isostasy and the surface of the ice-age Earth: the ICE-5G (VM2) model and GRACE, Ann. Rev. Earth Plan. Sci., 32, 111–149, 2004.
Peltier, W. R. and Solheim, L. P.: The climate of the Earth at Last Glacial Maximum: statistical equilibrium state and a mode of internal variability, Quatern. Sci. Rev., 23, 335–357, 2004. Prange, M., Romanova, V., and Lohmann, G.: The glacial
thermo-haline circulation: stable of unstable?, Geophys. Res. Lett., 29, 2028–2031, 2002.
Rahmstorf, S.: On the freshwater forcing and transport of the At-lantic thermohaline circulation, Clim. Dyn., 12, 799–811, 1996. Roche, D. M., Dokken, T. M., Goosse, H., Renssen, H., and
We-ber, S. L.: Climate of the last glacial maximum: sensitivity stud-ies and model-data comparison with the LOVECLIM coupled model, Clim. Past Discuss., 2, 1105–1153, 2006,
http://www.clim-past-discuss.net/2/1105/2006/.
Rutberg, R. L. and Peacock, S. L.: High-latitude forc-ing of interior ocean δ13C, Paleoceanography, 21, PA2012, doi:10.1029/2005PA001226, 2006.
Sarnthein, M., Winn, K., Jung, S. J. A., Duplessy, J.-C., Labeyrie, L., Erlenkeuser, H., and Ganssen, G.: Changes in east Atlantic deepwater circulation over the last 30,000 years: Eight time slice reconstructions, Paleoceanography, 9, 209–267, 1994.
Schmittner, A., Meissner, K. J., Eby, M., and Weaver, A. J.: Forcing of the deep ocean circulation in simulations of the Last Glacial Maximum, Paleoceanography, 17, 26–35, doi:10.1029/2001PA000633, 2002.
Shin, S., Liu, Z., Otto-Bliesner, B., Kutzbach, J. E., and Vavrus, S. J.: Southern ocean sea-ice control of the glacial North At-lantic thermohaline circulation, Geophys. Res. Lett., 30, 1096, doi:10.1029/2002GL015513, 2003.
Thorpe, R. B., Gregory, J. M., Johns, T. C., Wood, R. A., and Mitchell, J. F. B.: Mechanisms determining the Atlantic Thermo-haline circulation response to Greenhouse Gas forcing in a non-flux-adjusted coupled climate model, J. Clim., 14, 3102–3116, 2001.
Vries, P. de and Weber, S. L.: The Atlantic freshwater budget as a diagnostic for the existence of a stable shut-down of the merid-ional overturning circulation, Geophys. Res. Lett., 32, L09606, doi:10.1029/2004GL021450, 2005.
Weaver, A. J., Eby, M., Wiebe, E. C., Bitz, C. M., Duffy, P. B., Ewen, T. L., Fanning, A. F., Holland, M. M., MacFadyen, A., Matthews, H. D., Meissner, K. J., Saenko, O., Schmittner, A., Wang, H., and Yoshimori, M.: The UVic Earth System Climate Model: Model description, climatology and application to past, present and future climates, Atmosphere-Ocean, 39, 361–428, 2001.
Weijer, W., de Ruijter, W. P. M., Dijkstra, H. A., and van Leeuwen, P. J.: Impact of interbasin exchange on the Atlantic overturning circulation, J. Phys. Oceanogr., 29, 2266–2284, 1999.
Wunsch, C.: Abrupt climate change: an alternative view, Quatern. Res., 65, 191–203, 2006.
Zahn, R. and Mix, A. C.: Benthic foraminiferal δ18O in the ocean’s temperature-salinity-density field: constraints on the ice age ther-mohaline circulation, Paleoceanography, 6, 1–20, 1991.
![Table 3. Overview of the scaling relationships between 19 max (the response in the AMOC strength) and 1[E net ] (the response in net evaporation), 1ρ Atl (the response in the Atlantic north-south density contrast) and 1ρ SN (the response in the density con](https://thumb-eu.123doks.com/thumbv2/123doknet/14778531.595097/13.892.76.423.263.504/overview-relationships-response-strength-response-evaporation-response-atlantic.webp)
