HAL Id: hal-00318282
https://hal.archives-ouvertes.fr/hal-00318282
Submitted on 8 Mar 2007
HAL is a multi-disciplinary open access
archive for the deposit and dissemination of
sci-entific research documents, whether they are
pub-lished or not. The documents may come from
teaching and research institutions in France or
abroad, or from public or private research centers.
L’archive ouverte pluridisciplinaire HAL, est
destinée au dépôt et à la diffusion de documents
scientifiques de niveau recherche, publiés ou non,
émanant des établissements d’enseignement et de
recherche français ou étrangers, des laboratoires
publics ou privés.
during conjunction
J. D. Menietti, R. A. Frahm, A. Korth, F. S. Mozer, Y. Khotyaintsev
To cite this version:
J. D. Menietti, R. A. Frahm, A. Korth, F. S. Mozer, Y. Khotyaintsev. Polar and Cluster observations
of a dayside inverted-V during conjunction. Annales Geophysicae, European Geosciences Union, 2007,
25 (2), pp.543-555. �hal-00318282�
www.ann-geophys.net/25/543/2007/ © European Geosciences Union 2007
Annales
Geophysicae
Polar and Cluster observations of a dayside inverted-V during
conjunction
J. D. Menietti1, R. A. Frahm2, A. Korth3, F. S. Mozer4, and Y. Khotyaintsev5
1University of Iowa, Department of Physics and Astronomy, Iowa City, IA, USA
2Southwest Research Institute, 6220 Culebra Road, San Antonio, TX, USA
3Max-Planck-Institut fur Sonnensystemforschung, Katlenburg-Lindau, Germany
4Space Science Lab, University of California, Berlekey, CA, USA
5Institutet fur rymdfysik (IRFU), Uppsala, Sweden
Received: 22 August 2006 – Revised: 13 February 2007 – Accepted: 13 February 2007 – Published: 8 March 2007
Abstract. We investigate particle and fields data during a conjunction of the Polar and Cluster spacecraft. This con-junction occurs near the dayside cusp boundary layer when a dayside inverted-V was observed in the particle data of both satellites. Electron, ion, electric field, and magnetic field data from each satellite confirm that the dayside inverted-V (DSIinverted-V) structure is present at the location of both satel-lites and the electric fields persist from the altitude of the Polar (lower) spacecraft to the altitude of the Cluster space-craft. We observe accelerated, precipitating electrons and upward ions along the magnetic field. In addition, large am-plitude electric fields perpendicular to the ambient magnetic field seen by Polar and by Cluster suggest significant paral-lel electric fields associated with these events. For similar DSIV events observed by the Polar spacecraft, plasma waves (identified as possible Alfv´en waves) have been observed to propagate in both directions along the magnetic field line. Future conjunctions will be necessary to confirm that DSIVs are associated with reconnection sites.
Keywords. Magnetospheric physics (Auroral phenomena; Energetic particles, precipitating; Magnetopause, cusp, arid boundary layers)
1 Introduction and background
The term “Inverted-V” is used to describe the signature of auroral electron precipitation as observed on energy-vs-time spectrograms seen on both the nightside and dayside of the Earth. In the satellite frame, intense electron flux is first seen to increase to a maximum and then decrease forming the characteristic inverted-V on an energy-time spectrogram of particle flux. On the dayside Lin and Hoffman (1982)
Correspondence to: J. D. Menietti
long ago reported the occurrence rates of inverted-Vs in a sta-tistical study using the Atmospheric Explorer-D data. They found that the likelihood of observing inverted-Vs is a max-imum in the region between about 10 h<MLT< 12 h and
in-variant latitude <80◦. We refer to inverted-Vs in this region
as dayside inverted-Vs, (DSIVs). Lin and Hoffman also re-ported that DSIVs are shorter in spatial extent than those in the evening sector and DSIVs have a peak energy of only about 1 keV compared to about 5 keV for the evening hours from 19:00 to 01:00 MLT.
Following that early study, Burch et al. (1990) conducted a study of currents associated with DSIVs in the morning sec-tor of the Earth. These authors found DSIVs typically exhibit acceleration potentials about ten times smaller than accel-eration potentials exhibited by DSIVs found on the Earth’s nightside. Burch et al. found that the DSIVs are not perma-nent features of the dayside auroral region, but typically oc-cur just equatorward of the cusp or cleft in a region which contains trapped electrons and is believed to map to the boundary layer, i.e., on closed field lines just equatorward of the cusp. Downward region-1 currents are observed either just poleward of the trapping boundary in the equatorward part of the cusp or sometimes within the same flux tubes as the inverted-V events. Lin and Winske (1987) and Lin et al. (1986) have defined the region consisting of mixed plasma from both the cusp and the dayside auroral region as the cusp boundary layer. In the reconnection model (cf. the review by Vasyliunas, 1975), interplanetary magnetic field lines at a dayside neutral point, or multiple points reconnect to terres-trial magnetic field lines in the current layer of the magne-topause, force the merging plasma to flow or accelerate into the boundary layer. In this model, the boundary layer is a re-gion of partially open and closed magnetic field lines which convects anti-sunward for southward IMF conditions. Mag-netosheath plasma is observed in the boundary layer. After merging with solar wind field lines, cusp magnetic field lines
initially have a significant east/west motion due to field line tension. This motion eventually becomes antisunward due to drag by the magnetosheath flow (Saunders, 1989).
Menietti and Smith (1993) presented several examples of dayside inverted-Vs in which ion convection and energy dis-persion appeared to span the region of both open and closed
field lines. All of their examples occurred for negative Bz
within the region generally called the low latitude boundary layer, or the cusp boundary layer, and suggest a connection between closed field lines of the dayside auroral region and open field lines of the dayside cusp. One explanation is that plasma in the cusp boundary layer on closed field lines con-vects across field lines (in unusually smooth fashion) into the cusp. Such cross-field line convection may be possible in regions of finite conductivity and strong currents, where the field can diffuse through the plasma. Another explanation is the mid-altitude manifestation of merging at the dayside magnetopause causing the opening of previously closed field lines.
It is widely known that for conditions of negative Bz
mag-netic reconnection plays an important role in the dynamics of the solar wind magnetosphere-ionosphere coupling pro-cess (cf. Onsager and Fuselier, 1994; Scudder et al., 2002). There is also clear evidence for reconnection during north-ward IMF. Burch et al. (1980) reported “reverse-dispersion” of ions occurring during these purported cases at high lat-itude, poleward of the cusp. Onsager and Fuselier (1994) report evidence of reconnection for northward IMF equator-ward of the cusp. Reconnection for northequator-ward IMF takes place at higher magnetic latitudes (Reiff, 1984; Song and Russell, 1992; Russell et al., 2000) with a consequent for-mation of a low latitude boundary layer on closed field lines (cf. Le and Russell, 1996; Lockwood and Moen, 1999).
Transient reconnection may account for the particle popu-lation throughout the cusp (Smith and Lockwood, 1990; On-sager et al., 1993). In this scenario, reconnection is initi-ated at the dayside magnetopause. The reconnection poten-tial along the X-line will excite flows in the ionosphere. Ini-tially a flow in the east-west direction, dependent on the sign
of By, will occur due to field line tension. Later the solar
wind flow will pick up the field line and drive it antisunward. Cowley et al. (1991) and Smith et al. (1992) discuss, in ad-dition, an inductive effect which will move the merging line equatorward in the ionosphere, thus causing formerly closed field lines to become open.
The DSIV carries an upward current from the ionosphere (Burch et al., 1990) and may be a result of the reconnection process, but the plasma of the field lines still appears closed at the time and location of the observations by DE-1, be-cause the high-energy trapped plasma had not enough time to escape along the now open field lines. The region-1 cur-rents carried by the upward electrons observed just poleward of the DSIV and equatorward of the cusp may be due to cur-rent closure through the ionosphere (cf. Southwood, 1987; Saunders, 1989; Smith and Lockwood, 1990). It should be
noted that DSIVs are not observed on every satellite pass. The cusp or cusp boundary layer is often observed without the presence of a DSIV (cf. Burch et al., 1990). The source mechanism generating the DSIVs is thus transient.
The dayside inverted-V may signify a potential on a re-connecting field line, with the maximum energy signifying the instantaneous position of the reconnection line. The drop in high energy electrons poleward of the reconnection line signifies newly opened field lines. Thus the cusp bound-ary layer may be a transitional region with field lines that have just opened and still containing some magnetospheric plasma. As the region is opened it moves under tension.
For −By, the flux tube would move eastwards according to
the model of Southwood (1987) and Saunders (1989). As the magnetopause end moves it will communicate this to the ionosphere by stresses in the field line, i.e., field-aligned cur-rents. For the ionospheric footprint to move in the correct direction there must be a downward current on the poleward side and an upward current on the equatorward side. The poleward current can only be obtained from low-energy iono-spheric electrons. These electrons will collapse in pitch angle with altitude and be seen as beams as observed in the DE-1, Polar, and Cluster data.
1.1 Alfv´en waves
Goertz (1984) has discussed magnetosphere-ionosphere cou-pling due to Alfv´en waves on auroral field lines. In some reconnection scenarios, Alfv´en waves are believed to be present along magnetic field lines that connect to a reconnec-tion site. Using Dynamics Explorer particle and wave data, Gurnett et al. (1984) have discussed the efforts at observ-ing Alfv´en waves on nightside auroral field lines. Louarn et al. (1994), using FREJA data, have reported the existence of these waves for nightside aurora. More recently, Wygant et al. (2000) and Keiling et al. (2003a, b) have identified sig-nificant Poynting flux associated with intense Alfv´en waves observed in the nightside aurora by the Polar electric field instrument.
In the low latitude boundary layer (LLBL) and magne-topause there have also been observations of Alfv´en waves. These are summarized in review papers by LaBelle and
Treumann (1988) and by Tsurutani et al. (2003). These
waves are not as intense as those observed in the nightside auroral zone, and detailed analysis of these waves and the role they play in dayside reconnection needs further study.
Satellite observations have shown that field aligned cur-rents (FACs) are carried by Alfv´en waves along flux transfer events (FTEs) (Saunders et al., 1984). FTEs are considered time-dependent observations of reconnection at the dayside magnetopause (Russell and Elphic, 1978). Lee et al. (1988) have presented a mechanism by which the Alfv´en waves car-rying FACs propagate away from the magnetopause to the ionosphere. Ma and Lee (1999) have used MHD simulation studies of the dayside reconnection region with and without
an initial guide magnetic field (By). These authors have clearly demonstrated how Alfv´en waves propagate from the reconnection site downward toward the ionosphere and to-ward the sun. Alfv´en waves on closed magnetic field lines will reflect near the ionosphere to generate standing waves. This effect has been verified by ground observations (e.g., Lanzerotti et al., 1986).
Recently, Mozer et al. (2004, 2005) have reported obser-vations of large, impulsive electrostatic fields predominately perpendicular to the magnetic field. These fields are observed on the magnetospheric side of the magnetopause and have magnitudes up to 140 mV/m. They are observed within lo-cal minima of plasma density. Jovanovic et al. (2006) have argued that these impulsive signals are oblique cylindrical electron holes that can be related to the nonlinear evolution of the Buneman instability of lower-hybrid waves, driven by the parallel electric field that is generated by collisionless recon-nection. Lower hybrid waves are commonly observed along the magnetopause (cf. Andre et al., 2001; Bale et al., 2002; Menietti et al., 2004).
In this paper we investigate a DSIV observed by the Polar spacecraft during a higher altitude conjunction with the Clus-ter spacecraft. We analyze the particle and fields data from these spacecraft in an effort to determine the morphology and source of DSIV structures and their possible association with dayside reconnection.
2 POLAR instrumentation
The Polar spacecraft orbit provides an excellent opportu-nity to study the dayside magnetopause and cusp region. The plasma wave instrument on board this satellite obtained data from about 25 March 1996 to 16 September 1997. We have conducted an incomplete survey that identifies over 500 passes within the region of interest (e.g., where the maxi-mum of the DSIVs occur). Polar is the first satellite to have 3 orthogonal electric antennas (Eu, Ev, and Ez), 3 triaxial mag-netic search coils, and a magmag-netic loop antenna, as well as an advanced plasma wave instrument (Gurnett et al., 1995).
2.1 PWI
The Plasma Wave Instrument (PWI) on the POLAR space-craft is designed to provide measurements of plasma waves in the Earth’s polar regions over the frequency range from 0.1 Hz to 800 kHz. Five receiver systems are used to pro-cess the data: a wideband receiver, a high-frequency wave-form receiver (HFWR), a low-frequency wavewave-form receiver (LWFR), two multichannel analyzers, and a pair of sweep frequency receivers (SFR). Details of each of these receivers may be found in Gurnett et al. (1995).
2.2 HYDRA
The Electron and Ion Hot Plasma Instrument (HYDRA) (Scudder et al., 1995) is an experimental three-dimensional hot plasma instrument for the POLAR spacecraft. It consists of a suite of particle analyzers that sample the velocity space of electrons and ions between ∼2 keV/q to 35 keV/q in three dimensions. The time resolution for a complete 3-D phase space distribution is about 6 s. The instrument has been de-signed specifically to study accelerated plasmas such as those existing in the cusp and auroral regions.
2.3 EFI
The Electric Field Instrument (EFI) on the Polar spacecraft (Harvey et al., 1995) measures the three components of the ambient vector electric field and the thermal electron density. Spherical probes are used to obtain potential differences be-tween opposite sphere pairs mounted along booms in order to measure the three components of the electric field over the frequency range from DC to >20 kHz. The dynamic range is from 0.02 to 1 V/m. By measuring the floating point po-tential of the spacecraft, the plasma density may be obtained
from about 0.01 to over 10 cm−3.
2.4 MFI
The Polar Magnetic Fields Investigation (MFI) (Russell et al., 1995) is a high precision instrument that measures mag-netic fields in the magnetosphere using three ranges: 700, 5700, and 47 000 nT. The instrument consists of two triads of orthogonal fluxgate magnetometer sensors mounted on a 6 m boom. The data are now available at a sampling rate of about 54 vectors/s.
3 CLUSTER instrumentation
The Cluster II mission consists of four identical satellites in
a high-inclination orbit with a nominal apogee of 19.5 RE
and perigee of 4 RE. The mission objectives include studies
of the magnetopause and magnetotail reconnection sites of magnetospheric phenomena.
3.1 PEACE
The PEACE (Plasma Electron and Current Experiment) is designed to measure the electron distribution function in the energy range from 0.6 eV to ∼26 keV (Johnstone et al., 1997). PEACE has many operational and telemetry modes. For this study, (gyrotropic) pitch angle distributions (PAD) generated from spectra containing the magnetic field dur-ing each spacecraft spin (∼4 s) were used. The Low En-ergy Electron Analyzer (LEEA – 0.6 eV to 1 kev) and the High Energy Electron Analyzer (HEEA – 35 eV to 26 keV)
Polar
Figure 1
Fig. 1. Spectrograms of the Polar HYDRA electron and ion energy flux and the PWI electric field spectral density for a pass of the Polar
spacecraft on 2 April 1996. The top panel is the PWI data from the SFR which shows the typical signatures of cusp whistler mode hiss. The second panel is upward ion flux density and the bottom panel is Earthward electron flux density. Seen in this figure is the cusp signature of low energy, high density plasma that begins at about 18:52:30 UT and continues poleward.
are used to sample subsets of their energy range (93 logarith-mically spaced steps), which at times, overlap.
3.2 CIS
The Cluster Ion Spectrometer (CIS) experiment (R´eme et al., 1997) provides 3-D simultaneous ion distribution functions in the energy/charge range from 5 eV/e to ∼40 keV/e for the
major ion species (H+, He+, He++, and O+)with a time
resolution of ∼4 s (the satellite spin period). Two different instruments are used to cover the entire energy range. The CIS-2 instrument (a top-hat quadri-spherical analyzer) se-lects ions according to their energy per charge in the range from 5 eV/e to 32 keV/e. The CIS-1 instrument is the time-of-flight ion composition and distribution function analyzer, and the high resolution mass-resolving spectrometer operat-ing in the energy/charge range from ∼20 eV/e to ∼40 keV/e.
3.3 EFW
The Electric Field and Wave (EFW) instrument on Cluster (Andre et al., 2001) consists of 4 spherical probes, 8 cm in diameter, at the end of long wire booms in the spin plane. There are many modes of operation available associated with 4 output data rates and 5 low and high band pass filters. In
normal mode, two electric field components in the spin plane are low-pass filtered at 10 Hz and sampled at 25 samples/s. In the burst mode the data rates of 22 240 and 29 440 bits/s may be used to transfer 3 or 4 signals sampled at 450 samples/s.
4 Observations
Dayside inverted-Vs are observed by the Polar spacecraft not infrequently. By the time the Cluster science mission be-gan in 2001, the plasma wave instrument on board the Polar spacecraft was no longer in operation. Hence, there are no plasma wave data available from the Polar spacecraft during the Polar-Cluster conjunction period. However, it is instruc-tive to analyze a typical example of a DSIV during the time when the PWI was operating on the Polar spacecraft.
In Fig. 1 we show a spectrogram of the HYDRA elec-tron and ion energy flux and the PWI electric field spectral density for a pass of the Polar spacecraft on 2 April 1996. The top panel shows the PWI data from the SFR. Common signatures of cusp whistler mode hiss near 1 kHz and above are observed. The second panel shows the upward ion flux density and the bottom panel shows the Earthward electron flux density. These panels display the typical cusp signa-ture of low-energy, high-density plasma that begins at about
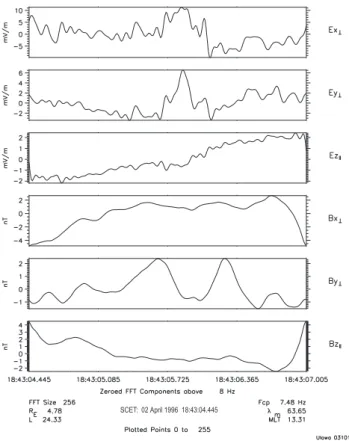
SCET: 02 April 1996 18:43:04.445 Figure 2a
Fig. 2a. The waveform from the PWI LFWR on board the Polar
spacecraft. This figure shows the 3 electric and 3 magnetic field measurements in field-aligned coordinates, and extends over a time interval of about 2.56 s. The fields have been filtered for frequencies below about 8 Hz. The proton cyclotron frequency at this time is about 7.7 Hz. Note the rather large electric fields reflected in the first two panels where the electric field is perpendicular to the ambient magnetic field, which we believe are signatures of an Alfv´en wave.
18:52:30 UT. The cusp boundary layer exists just equator-ward of the cusp in the time interval from about 18:39 UT to 18:52:30 UT. Within the cusp boundary layer, an inverted-V (DSIinverted-V) is visible. This signature is characterized by an inverted-V structure in the energy distribution centered near 18:43 UT as observed in the electron energy flux for ener-gies less than 300 eV and in the upward accelerated ions, distinctive evidence that there exists a field-aligned electric field both above and below the spacecraft.
In Fig. 2a we show a plot of the waveform taken from the PWI LFWR on board the Polar spacecraft. This figure shows the 3 electric and 3 magnetic field measurements in field-aligned coordinates, and extends over a time interval of about 2.56 s. Oscillations in the fields have been filtered for frequencies below about 8 Hz. The proton cyclotron fre-quency at this time is about 7.7 Hz. Note the rather large electric fields in the first two panels where the electric field is perpendicular to the ambient magnetic field. These
Fig. 2b. A higher resolution plot of perpendicular electric and
mag-netic fields (first four panels) shown in Fig. 2a during the Alfv´en wave. In the bottom panel we plot the index of refraction.
nitudes are about an order of magnitude smaller than those sometimes seen in the nightside auroral region, but they are nevertheless significant and are probably due to an Alfv´en wave. For the time range covered in this figure, we have determined that the Poynting flux is propagating down the magnetic field line toward the Earth. At other times during this same satellite pass, we observe the Poynting flux is di-rected away from the Earth with about the same magnitude. This could be an example of a standing Alfv´en wave along the reconnecting magnetic field line.
We have investigated the measured ratio of cB/E from the data of Fig. 2a. During the interval of peak electric fields observed just after 18:43:05.724 UT, this ratio varies from about 20 to 65, with a median of about 44 (see Fig. 2b). We can compare this to the expected index of refraction for an Alfv´en wave using the local plasma parameters. At this time
we observe fci=7.48 Hz, so we can estimate the Alfv´en
ve-locity to be ∼.049c, or nA=20.4. This is within a factor of 2
of the measured index of refraction, thus consistent with our interpretation of an Alfv´en wave. We note that the presence of an Alfv´en wave does not preclude the presence of static field-aligned potentials within the dayside and nightside au-roral regions. The occurrence of such potentials are known
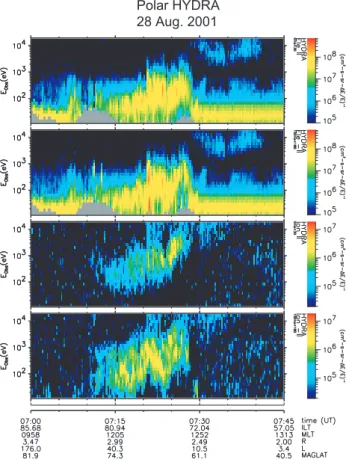
Polar HYDRA 28 Aug. 2001
Fig. 3. Spectrogram of the Polar HYDRA electron and ion energy
flux for the DSIV event of 28 August 2001. Beginning at the top, the panels shown are downward and upward electrons, and downward and upward ions. Inverted-V structures are observed in the interval from about 07:20 UT to 07:30 UT.
to exist in the auroral region even though Alfv´en waves have been observed as probable accelerators of electrons as well (cf. Ergun et al., 1998; Wright, 2005; Wygant et al., 2000).
4.1 Conjunction pass of 28 August 2001
In Fig. 3 we present observations from 28 August 2001, when Polar and Cluster spacecraft were in near conjunction in the Northern Hemisphere during a DSIV observed by the Polar spacecraft. At this time, the interplanetary magnetic field
(IMF) is in the range −4 nT<Bz<−2 nT. During this
obser-vation, the Polar spacecraft is moving away from the north-ern pole, while the Cluster spacecraft travel toward the pole. The Cluster C1, C2, and C4 spacecraft (C3 is not included in this study because there was no PEACE telemetry at this time) are separated by ∼1000 km in Geocentric Solar Eclip-tic (GSE) X, but are quite close in both GSE Z and Y. The order of trajectory is C4 first, then C2 followed by C1.
The Polar spacecraft observed the beginning of DSIV plasma at approximately 07:24 UT. At 07:26:45 UT, the Po-lar spacecraft detected the center of the inverted-V at
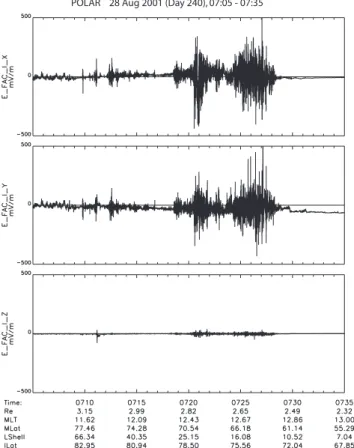
invari-- 1 5 0 - 1 0 0 - 5 0 0 5 0 B X T _ F A C n T E P O C H Y 2 0 0 0 P O L A R M F E - 1 5 0 - 1 0 0 - 5 0 0 5 0 B Y T _ F A C n T 0 0 7 : 0 5 0 7 : 1 5 0 7 : 2 5 0 7 : 3 5 28 Aug 2001
Fig. 4. The magnetometer data obtained by the MFE on board the
Polar spacecraft for the same time interval. The figure shows dBx
and dBy(perpendicular to ambient magnetic field) in field-aligned
coordinates. The characteristic signature of a field-aligned current is observed along with f ∼1/30 s fluctuations.
ant latitude, IL=74.4◦, r=2.6 RE, and magnetic local time,
MLT=12.99 h. By about 07:29 UT the Polar spacecraft has passed through the DSIV and is observed to enter the re-gion of trapped particle fluxes, characterized by higher en-ergy electrons and ions. During the inverted-V, the HYDRA
observes downward energy fluxes with Emax∼2 keV. Near
07:21 UT, HYDRA observes a narrow region of upward elec-tron flux and downward ion flux. This peak upward energy
flux also has an Emax∼2 keV.
In Fig. 4 we plot the magnetometer data obtained by MFE on board the Polar spacecraft for the same time interval. In
this figure, the two panels display dBx and dBy
(perpendic-ular to Bo)in field-aligned coordinates. The characteristic
signature of a field-aligned current is observed along with f∼1/30 s fluctuations. The presence of a field-aligned current (FAC) is indicated by reference to the E-field data provided by the Polar EFI and displayed in Fig. 5a. Clearly, significant
E⊥ fields are present in the interval 07:18–07:29 UT,
indi-cating a strong E||below the spacecraft. For a model current
slab assuming maximum Byto be parallel to the current wall,
we estimate that an upward current (downward electrons) of
J∼−0.27 µamps/m2 is present at this time. In Fig. 5b we
plot, over the shorter time interval 07:18 to 07:30, RE·dL
versus time where E is the electric field and dL is along the spacecraft velocity. There are a number of reversals of the electric field–a large one beginning after 07:20:30 indicat-ing a signficant change of electric potential from −25 kV to −15 kV. This time corresponds to the significant field-aligned electrons and ions observed at the same time on
POLAR 28 Aug 2001 (Day 240), 07:05 - 07:35
Fig. 5a. The presence of a field-aligned current (FAC) is indicated
by this electric field data provided by the Polar EFI. In this figure the 3 panels display the x, y, and z components of E with z parallel to B.
Fig. 3. A smaller reversal begins near 07:23:30, and one of intermediate size begins near 07:26:45. This latter re-versal extends from about −47.8 kV to −44.6 kV within the inverted-V structure identified previously.
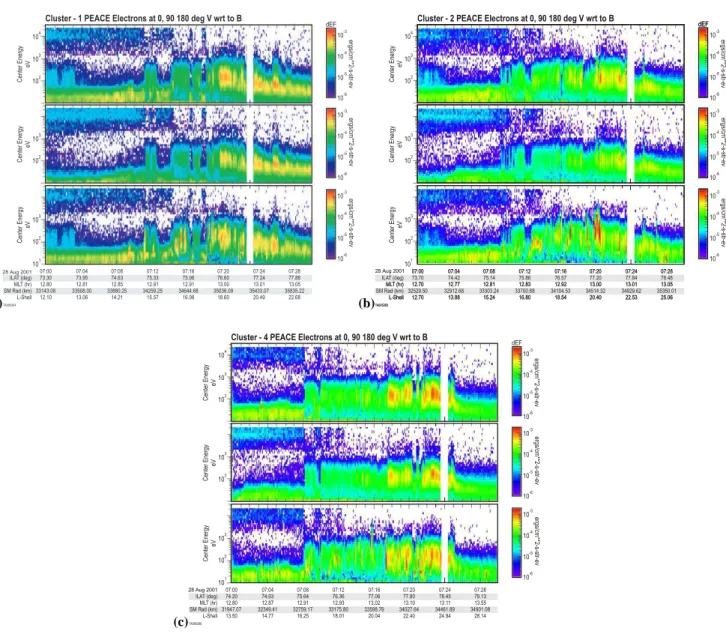
Cluster PEACE data for electrons are displayed in Figs. 6a–c for the approximate time interval 07:00 UT– 07:30 UT. The format for the panels (top to bottom) is
en-ergy flux for downward, trapped (90◦ pitch angle), and
up-ward electrons. In Fig. 6a we observe the C1 satellite exit-ing the dayside auroral region and enterexit-ing the cusp bound-ary layer in the time interval 07:14 UT to about 07:18 UT. Rather intense downward electrons (top panel) begin at about 07:19:30 UT, but a most distinctive feature of the C1 fluxes is the spiky upward electrons that are present throughout the cusp boundary layer. Both downward and upward electron
fluxes show Emax ∼900 eV. The electron fluxes on C4 are
similar to those of C1, and show a dominant downward elec-tron flux beginning about 07:17:30 UT. Elecelec-tron fluxes ob-served by C2 are most dominate in the downward direction, but intense upward electron fluxes near 07:20 UT with a
max-imum energy of Emax∼4 keV are also observed.
Fig. 5b. A plot of the integral ofRE·dL along the Polar spacecraft
trajectory. At least three regions of field reversal are seen.
A limited amount of EFW electric field data and ion (CIS) data was analyzed for these passes. In Fig. 7 we show a plot of the CIS data from C4. The top panel is an energy-vs-time
spectrogram with H+energy flux color-coded. The middle
and bottom panels display the pitch angle distribution for H+
and O+, respectively. The plot shows significant H+fluxes
beginning near 07:17:30 UT, in agreement with the PEACE
electron data of Fig. 6c. Periods of dominant upward H+
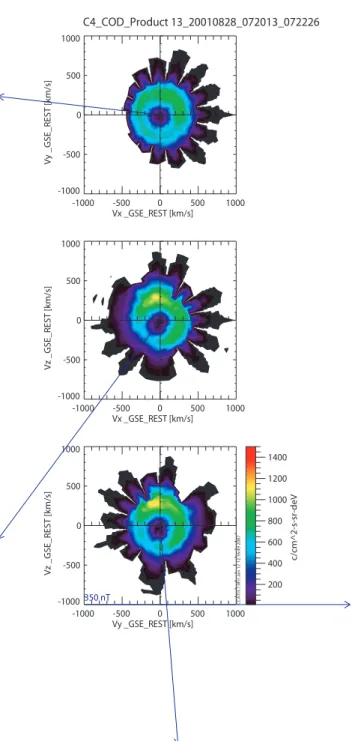
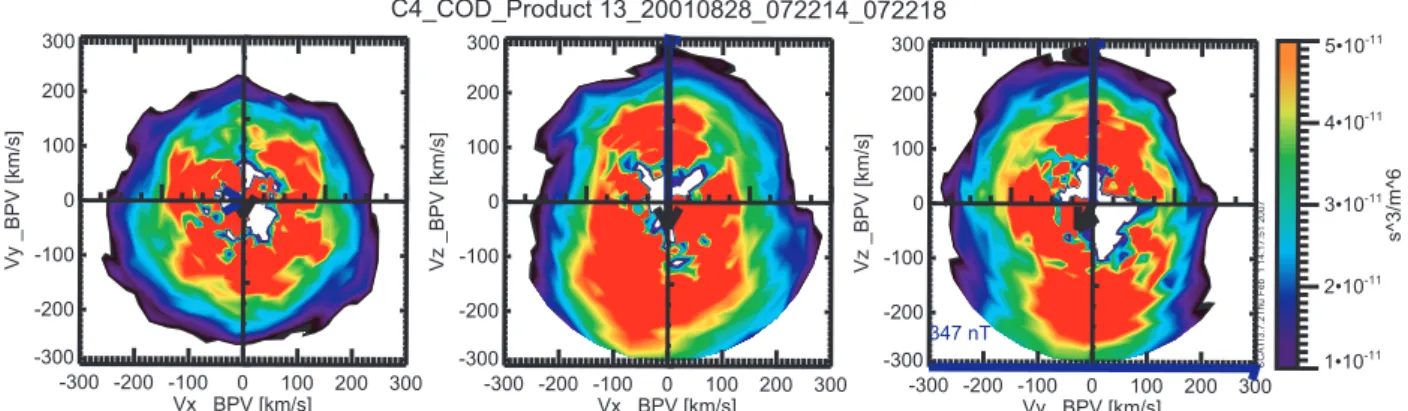
flux (pitch angles >90 degrees) occur in the approximate in-tervals 07:20:00 to 07:22:30 UT and after 07:24 UT. These periods would indicate an upward DC electric field beneath the satellite and therefore a region of inverted-V. In Fig. 8 we show three contours of differential energy flux integrated over the time interval 07:20:13 to 07:22:26 for the C4 space-craft. The coordinate system is GSE and the blue arrow indi-cates the direction of the magnetic field. It is apparent in the second and third panels that most flux is observed to move in the anti-Earthward (−B) direction with a median energy of over 300 eV. In Fig. 9 we show three contours of the distribu-tion funcdistribu-tion as measured by CIS on C4 with units shown on the color bar. The observation time is 07:22:14 to 07:22:18. The coordinate system is “B parallel V” or BPV, with the magnetic field in the +z direction. The center and right pan-els both include the z-axis and indicate dominant flux in the anti-Earthward direction with a maximum energy in excess of 350 eV.
In Fig. 10 we show a plot of EFW electric field intensity measured on C4 for the 3 spacecraft axes, with x and y nearly (within a few degrees) perpendicular to the magnetic field. The figure indicates rather significant perpendicular electric fields (up to 100 mV/m) near 07:20:20 UT and again centered near 07:21:20 UT. These fields are consistent with a parallel electric field between those time periods, agreeing with the
observation of upward H+ions observed during this time
(a)
Cluster - 1 PEACE Electrons at 0, 90 180 deg V wrt to B
dEF Center Energy eV Center Energy eV Center Energy eV ergs/cm**2-s-str -ev ergs/cm**2- s-st r-ev ergs/cm ** 2-s-str-ev TA005264 07:00 73.30 12.80 33143.08 12.10 07:04 73.95 12.81 33508.00 13.06 07:08 74.63 12.85 33880.25 14.21 07:12 75.33 12.91 34259.25 15.57 07:16 75.96 12.91 34644.68 16.98 07:20 76.60 13.00 35036.09 18.60 07:24 77.24 13.01 35433.07 20.49 07:28 77.88 13.05 35835.22 22.68 ILAT (deg) MLT (hr) SM Rad (km) L-Shell 4 10 3 10 3 10 3 10 2 10 2 10 2 10 1 10 -4 10 -3 10 -6 10 -4 10 -4 10 -3 10 -3 10 -5 10 -5 10 -5 10 -6 10 -6 10 28 Aug 2001 (b) Center Energy eV dEF Center Energy eV Center Energy eV ergs/cm**2-s-st r-ev ergs/cm**2- s-st r-ev ergs/cm ** 2-s-str-ev TA005265 07:00 73.70 12.70 32529.50 12.70 07:04 74.42 12.77 32912.68 13.88 07:08 75.14 12.81 33303.24 15.24 07:12 75.86 12.83 33700.68 16.80 07:16 76.57 12.92 34104.53 18.54 07:20 77.20 13.00 34514.32 20.40 07:24 77.84 13.01 34929.62 22.53 07:28 78.48 13.05 35350.01 25.06 ILAT (deg) MLT (hr) SM Rad (km) L-Shell dEF TA005265 07:00 73.70 12.70 32529.50 12.70 07:04 74.42 12.77 32912.68 13.88 07:08 75.14 12.81 33303.24 15.24 07:12 75.86 12.83 33700.68 16.80 07:16 76.57 12.92 34104.53 18.54 07:20 77.20 13.00 34514.32 20.40 07:24 77.84 13.01 34929.62 22.53 07:28 78.48 13.05 35350.01 25.06 ILAT (deg) MLT (hr) SM Rad (km) L-Shell
Cluster - 2 PEACE Electrons at 0, 90 180 deg V wrt to B 4 10 3 10 3 10 3 10 2 10 2 10 2 10 1 10 -4 10 -3 10 -6 10 -4 10 -4 10 -3 10 -3 10 -5 10 -5 10 -5 10 -6 10 -6 10 28 Aug 2001 (c)
Cluster - 4 PEACE Electrons at 0, 90 180 deg V wrt to B
Center Energy eV dEF Center Energy eV Center Energy eV ergs/cm**2-s-str -ev ergs/cm**2- s-st r-ev ergs/cm ** 2-s-str-ev TA005266 07:00 74.20 12.80 31947.07 13.50 07:04 74.93 12.87 32349.41 14.77 07:08 75.64 12.91 32759.17 16.25 07:12 76.36 12.93 33175.80 18.01 07:16 77.06 13.02 33598.79 20.04 07:20 77.80 13.10 34027.64 22.40 07:24 78.45 13.11 34461.89 24.94 07:28 79.13 13.55 34901.08 28.14 ILAT (deg) MLT (hr) SM Rad (km) L-Shell 4 10 3 10 3 10 3 10 2 10 2 10 2 10 1 10 -4 10 -3 10 -6 10 -4 10 -4 10 -3 10 -3 10 -5 10 -5 10 -5 10 -6 10 -6 10 28 Aug 2001
Fig. 6. Cluster C1, C2, and C4 PEACE electron data are displayed in panels (a–c) for the approximate time interval 07:00 UT–07:30 UT.
The format for the panels (top to bottom) is energy flux for downward, trapped (90◦pitch angle), and upward electrons.
Electric fields measured by EFW for each spacecraft of Cluster were obtained for times between 07:20 UT and 07:30 UT. The most significant perpendicular electric fields during this time were measured at the C2 space-craft near 07:20:30 UT with amplitudes of ±100 mV/m.
Strong E⊥, with magnitudes of ±100 mV/m, were
also measured at the C4 spacecraft with peaks in the
range −125 mV/m<E⊥<125 mV/m in the time interval
07:21:20 UT to 07:21:30 UT. These fields compare with peak
E⊥measured by the EFI on the Polar spacecraft of ∼400 to
500 mV/m, and are consistent with the conservation of the first adiabatic invariant. In Fig. 11 we have plotted the projec-tion along the spacecraft trajectory of the electric field mea-sured by EFW on C4 at a higher resolution over the reduced time interval from 07:20:00 to 07:23:00. The second panel
contains the potential integrated along the spacecraft trajec-tory. Note that there are two regions where the integrated po-tential curve flattens and becomes slightly positive in slope – once near 07:21:20 and also near 07:21:50. In each case the net change in potential is less than 150 volts. However, to obtain these data, since there is no direct measurement of
E||, the assumption is made that E||=0. It is therefore
possi-ble that a more significant increase in the potential is actually present than is calculated.
Field-aligned currents typically observed in the auroral re-gions and current layers are necessary precursors for recon-nection. The strongest downward currents for C1 occur in the time interval from about 07:19:30 UT to 07:20:30 UT with current densities calculated from the electron flux to
0.1 1.0 10.0 SC4 C OD Grnd_L1 H+ (k eV ) 0.1 1.0 10.0 104 105 106 107 eV/cm^2-s-sr-deV 0 45 90 135 180 SC4 C OD3D 0.03-40.00(k eV ) H+ P A (deg) 0 45 90 135 180 104 105 106 107 eV/cm^2-s-sr-deV 4.7 35.9 12.6 7.1 67.9 0710 4.8 41.1 12.7 8.4 69.8 0720 4.9 46.1 12.8 10.2 71.8 0730 0 45 90 135 180 SC4 C O D3D 0.03-40.00(k eV ) O+ P A (deg) 4.7 35.9 12.6 7.1 67.9 0710 4.8 41.1 12.7 8.4 69.8 0720 4.9 46.1 12.8 10.2 71.8 0730 0 45 90 135 180 104 105 106 eV/cm^2-s-sr-deV 3Dist (Re) 3MLat 3MLT 3L (Re) 3ILat hhmm UT C C A TI3.6.2W ed O c t 25 13:55:39 2006
Cluster 4 CIS 28 Aug. 2001
Fig. 7. A plot of the CIS data from C4. The top panel is an
energy-vs-time spectrogram with H+energy flux color-coded. The middle
and bottom panels display the pitch angle distribution for H+and
O+, respectively.
be compared to ∼−0.27 µamps/m2calculated at the altitude
of the Polar spacecraft. The C2 satellite records the largest upward currents due to the spiky, beam-like upward elec-trons observed near 07:20 UT as downward currents
(up-ward electrons) approaching 0.2 µamps/m2 for 2 bursts of
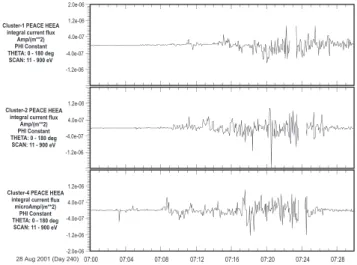
upward electrons are seen. We plot these current densities from PEACE electrons on the C1, C2, and C3 spacecraft in Fig. 12.
The time of nearest conjunction between the Polar space-craft and the Cluster-4 (Cluster-2, Cluster-1) spacespace-craft is ap-proximately 07:21 UT (07:24 UT, 07:25 UT). In Table 1 we list the coordinates of each spacecraft at these times.
At the same latitude position where the Polar spacecraft
measures the peak of the inverted-V (IL=74.4◦, 2.6 RE,
MLT=12.99 h at 07:26:45 UT), the Cluster-1 spacecraft at 07:06:39 UT (MLT=12.84 h), the Cluster-2 spacecraft at
C4_COD_Product 13_20010828_072013_072226 -1000 -500 0 500 1000 Vx _GSE_REST [km/s] -1000 -500 0 500 1000 Vy _GSE_REST [km/s] -1000 -500 0 500 1000 Vx _GSE_REST [km/s] -1000 -500 0 500 1000 Vz _GSE_REST [km/s] -1000 -500 0 500 1000 Vy _GSE_REST [km/s] -1000 -500 0 500 1000 Vz _GSE_REST [km/s] 350 nT 200 400 600 800 1000 1200 1400 c/cm^2-s-sr-deV CCATI3.7.0Fri Jan 12 12:16:49 2007
Fig. 8. Contours of the differential energy flux (units shown on the
color bar) observed by CIS on the C4 spacecraft integrated over the time interval 07:20:13 to 07:22:26. The axes are GSE coordinates and the blue arrow indicates the direction of the magnetic field.
07:03:56 UT (MLT=12.77 h), and the Cluster-4 spacecraft at 07:01:06 UT (MLT=12.82 h) all are measuring high energy plasma in the auroral region, equatorward of the cusp. The
DSIV is not observed by the Cluster satellites until IL∼76◦,
8 1 2 2 7 0 _ 4 1 2 2 7 0 _ 8 2 8 0 1 0 0 2 _ 3 1 t c u d o r P _ D O C _ 4 C 0 0 3 - -200 -100 0 100 200 300 ] s / m k [ V P B _ x V 0 0 3 -0 0 2 -0 0 1 -0 0 0 1 0 0 2 0 0 3 Vy _BPV [km/s] 0 0 3 - -200 -100 0 100 200 300 ] s / m k [ V P B _ x V 0 0 3 -0 0 2 -0 0 1 -0 0 0 1 0 0 2 0 0 3 Vz _BPV [km/s] 0 0 3 - -200 -100 0 100 200 300 ] s / m k [ V P B _ y V 0 0 3 -0 0 2 -0 0 1 -0 0 0 1 0 0 2 0 0 3 Vz _BPV [km/s] T n 7 4 3 0 1 • 1 -11 0 1 • 2 -11 0 1 • 3 -11 0 1 • 4 -11 0 1 • 5 -11 s^3/m^6 CCATI3.7.2Thu Feb 1 14:17:51 20 07
Fig. 9. Contours of the distribution function (units shown on the color bar) observed by CIS on C4 for the time interval 07:22:14 to 07:22:18.
The coordinate system is BPV (B-parallel-v) with the magnetic field along the +z axis.
100 0 100 E D S I [ m V /m ] E F W , C lus te r 4 07: 21 07:22 07:23 07: 24 07: 25 07:26 07: 27 07: 28 07:29 28 A ug 2001 X Y Z
Fig. 10. A plot of EFW electric field intensity for C4 for the 3 spacecraft axes, with x and y nearly perpendicular to the magnetic field. The
figure indicates rather significant perpendicular electric fields (∼100 mV/m) near 07:20:20 UT and again centered near 07:21:20 UT.
−100 0 100 E⊥ al o n g S C o rb it [ m V /m ] C lus ter 4, E F W , V S C=4.25 [−0.57 −0.36 0.74] km/s G S E −6 −4 −2 0 in te g ra te d E⊥ [k V ] 07:20:00 07:20:30 07:21:00 07:21:30 07:22:00 07:22:30 07:23:00 28−Aug−2001
Fig. 11. The top panel is the projection of the electric field measured
by EFW along the C4 spacecraft trajectory. The data are at a higher resolution than shown in Fig. 10. The second panel is the integral of this electric field along the spacecraft trajectory.
5 Summary and conclusions
An example of a cusp conjunction between the Polar and Cluster spacecraft during a dayside inverted-V has been pre-sented. The data indicate that significant field-aligned elec-tric fields and currents exist in the cusp boundary layer as
ob-served by the Polar spacecraft for r<3 RE. At the same time,
Table 1. Conjunction coordinates.
IL r MLT
Time Sat (degs) (RE) (h)
07:21 UT POLAR 77.8 2.79 12.77 07:21 UT C-4 77.8 5.35 13.10 07:24 UT POLAR 76.1 2.69 12.90 07:24 UT C-2 77.7 5.47 13.01 07:25 UT POLAR 75.5 2.60 12.93 07:25 UT C-1 77.4 5.58 13.02
the Cluster spacecraft, (for r>5 RE along the same or
near-conjunctive magnetic field line), observes electron accelera-tion with somewhat smaller energies and electric fields of the same sense as observed at lower altitudes by instruments on the Polar spacecraft. The electric field of the DSIV between the Polar and Cluster spacecraft appears to be directed up-ward with a magnitude of approximately 500 V<E<1.0 kV,
consistent with observed Emaxfor electrons observed by the
Polar HYDRA and the Cluster PEACE.
As observed most prominently at the C2 spacecraft, a re-gion of upward electrons in the cusp boundary layer is ob-served equatorward of the DSIV. The region is likely a re-turn current region that is observed at the Polar spacecraft,
poleward of the DSIV. This indicates that a complex 3-dimensional structure is intertwined throughout the region, which may also exhibit temporal effects.
Significant values of E⊥are observed by the EFI on board
the Polar spacecraft indicating a moderate E|| beneath the
spacecraft. The source of this electric field may be a recon-nection site located along the magnetic field at higher alti-tudes that at least partially closes near the Polar spacecraft and extends to lower altitude (cf. McFadden et al., 1999). Mozer et al. (2004) have observed large amplitude, extremely rapid, predominantly perpendicular electric field structures at the magnetopause that may be associated with reconnec-tion regions. It is possible that such strong localized electric fields map to lower altitudes and form the parallel and per-pendicular electric fields that are observed at Polar altitudes. Additionally, Alfv´en waves that may be associated with re-connection events have been identified by the Polar plasma wave instrument at some DSIVs (Figs. 1 and 2).
Ion data from the CIS confirm the location of the cusp boundary layer observed by the Cluster spacecraft.
Peri-ods of dominant upward H+flux (pitch angles >90 degrees)
occur in the approximate interval 07:20:00 to 07:22:30 UT, where precipitating electrons are also observed, thus indi-cating an upward DC electric field beneath the satellite and therefore a region of inverted-V. In addition, the CIS data measured from the C1 spacecraft (not shown) indicate an
on-set of predominately downward H+ flux and bi-directional
O+ flux at 07:19:30 UT. This gives way to predominately
upward H+ and O+ flux in the interval from 07:20 UT
to 07:21 UT when the PEACE electrons indicate enhanced downward electron flux.
Although the conjunction between the Polar and Cluster spacecraft is not perfect in time, it is close spatially. The cusp boundary layer (CBL) is encountered by the Polar spacecraft
at ∼07:28 UT at IL=73.5◦, MLT=13.02, while the C1
space-craft encounters this boundary near 07:18 UT at IL≈76◦,
MLT=13.07, over 10 min later. As shown by Marklund et al. (2004), significant changes in the region mapping to au-roral acceleration can occur over timescales of ∼200 s. The fact that the CBL is located at approximately the same MLT and IL, however, indicates the spatial boundary is approxi-mately steady. At the time of conjunction, the Polar
space-craft is between 2.5 and 3.0 RE below C1, C2, and C4. The
order of orbit of the Cluster spacecraft was C4, C2, and C1. The first significant plasma boundary of field-aligned electrons encountered by C4 occurred about 07:17:30 UT
(IL∼77.34◦). Flux levels were somewhat less intense, but
C2 encountered a similar plasma boundary near 07:17:00 UT
(IL∼76.73◦). C1 experienced significant upward electron
beams as early as 07:14:30 UT, and again near 07:18:30 UT, but enhanced, precipitating electrons were not encountered
until 07:19:30 UT (IL∼76.52◦). It appears that the plasma
boundary thus moved to lower invariant latitudes. Assum-ing the boundary experienced by C4 at 07:17:30 UT was the same (moving) boundary experienced by C4 at 07:19:30 UT,
-1.2e-06 -4.0e-07 4.0e-07 1.2e-06 2.0e-06
Cluster-1 PEACE HEEA integral current flux
Amp/(m**2) PHI Constant THETA: 0 - 180 deg
SCAN: 11 - 900 eV
Cluster-2 PEACE HEEA integral current flux
Amp/(m**2) PHI Constant THETA: 0 - 180 deg SCAN: 11 - 900 eV
Cluster-4 PEACE HEEA integral current flux
microAmp/(m**2) PHI Constant THETA: 0 - 180 deg SCAN: 11 - 900 eV -1.2e-06 -4.0e-07 4.0e-07 1.2e-06 -2.0e-06 -1.2e-06 -4.0e-07 4.0e-07 1.2e-06 07:00 07:04 07:08 07:12 07:16 07:20 07:24 07:28 28 Aug 2001 (Day 240)
Fig. 12. Current densities determined from the C1, C2, and C4
PEACE electron data. The units are amps/m2.
we estimate the velocity of this boundary to be about 4 km/s equatorward. Based on spacecraft velocity at the time of con-junction, the inverted-V encountered by Polar had an approx-imate extent perpendicular to the magnetic field of 900 km. Spacecraft C4 encountered an inverted-V region (between 07:20–07:22:30 UT) with a perpendicular extent of about 400 km. We conclude that a parallel electric field extends between the Polar and Cluster satellites. While reconnection likely takes place at higher altitude along field lines that may map to the DSIV, there is no clear evidence from the data ex-amined here that such a mapping exists. It will be important in the future to find an example of Cluster within a reconnec-tion site and a conjugate satellite at much lower altitude.
Unfortunately small changes in time and space for these conjunctions can lead to significant effects in mapping the magnetic field lines, particularly when the two spacecraft are well separated in altitude. We look forward to examining additional data for conjunctions between Cluster and Polar to determine a possible relationship of the dayside inverted-Vs to reconnection regions.
Acknowledgements. We wish to thank all the investigators who
have contributed data to this study: J. D. Scudder (Polar HYDRA); H. R´eme (Cluster, CIS); A. Fazakerley (Cluster PEACE); M. Andre (Cluster EFW); C. T. Russell (Polar MFI); and E. Lucek (Cluster FGM). We also thank J. Hospodarsky for clerical assistance. This work was supported at Iowa by NSF grant ATM 04-43531 and at SwRI under NASA grant NNG04GM5YG.
Topical Editor I. A. Daglis thanks two referees for their help in evaluating this paper.
References
Andre, M., Behlke, R., Wahlund, J.-E., Vaivads, A., Eriksson, A.-I, Tjulin, A., Carozzi, T. D., Cully, C., Gustafsson, G., Sundkvist, D., Khotyaintsev, Y., Cornilleau-Wehrlin, N., Rezeau, L., Maksi-movic, M., Lucek, E., Balogh, A., Dunlop, M., Lindqvist, P.-A., Mozer, F., Pedersen, A., and Fazakerley, A.: Multi-spacecraft ob-servations of broadband waves near the lower hybrid frequency at the Earthward edge of the magnetopause, Ann. Geophys., 19, 1471–1481, 2001,
http://www.ann-geophys.net/19/1471/2001/.
Bale, S. D., Mozer, F. S., and Phan, T.: Observation of lower hybrid drift instability in the diffusion region at a reconnecting magne-topause, Geophys. Res. Lett., 29, 33–36, 2002.
Burch, J. L., Reiff, P. H., Heelis, R. A., Spiro, R. W., and Fields, S. A.: Cusp region particle precipitation and ion convection for northward interplanetary magnetic field, Geophys. Res. Lett., 7, 393–396, 1980.
Burch, J. L., Menietti, J. D., and Slavin, J. A.: Dayside auroral par-ticle acceleration mechanisms derived from Dynamics Explorer data, J. Geomag. Geoelectr., 42, 1365–1378, 1990.
Cowley, S. W. H., Freeman, N. P., Lockwood, M., and Smith, M. F.: The ionospheric signature of flux transfer events, Proceedings of the Cluster Symposium, at Longyearbyen, ESASP-330, Estec, Noordwijk, and Holland, 1991.
Ergun, R. E., Carlson, C. W., McFadden, J. P., Mozer, F. S., De-lory, G. T., Peria, W., Chaston, C. C., Temerin, M., Elphic, R., Strangeway, R., Pfaff, R., Cattell, C. A., Klumpar, D., Shelley, E., Peterson, W., Moebius, E., and Kistler, L.: FAST satellite observations of electric field structures in the auroral zone, Geo-phys. Res. Lett., 25, 2025–2028, 1998.
Goertz, C. K.: Kinetic Alfv´en waves on auroral field lines, Planet. Space Sci., 32, 1387–1392, 1984.
Gurnett, D. A., Huff, R. L., Menietti, J. D., Burch, J. L., Winning-ham, J. D., and Shawhan, S. D.: Correlated low-frequency elec-tric and magnetic noise along the auroral field lines, J. Geophys. Res., 89, 8971–8985, 1984.
Gurnett, D. A., Persoon, A. M., Randall, R. F., Odem, D. L., Rem-ington, S. L., Averkamp, T. F., DeBower, M. M., Hospodarsky, G. B., Huff, R. L., Kirchner, D. L., Mitchell M. A., Pham, B. T., Phillips, J. R., Schintler, W. J., Sheyko, P., and Tomash, D. R.: The Polar plasma wave instrument, Space Science Reviews, 71, 597–622, 1995.
Harvey, P., Mozer, F. S., Pankow, D., Wygant, J., Maynard, N. C., Singer, H., Sullivan, W., Anderson, P. B., Pfaff, R., Aggson, T., Pedersen, A., Falthammar, C.-G., and Tanskannen, P.: The elec-tric field instrument on the Polar satellite. Space Sci. Rev., 71, 583–596, 1995.
Johnstone A. D., Alsop, C., Burge, S., Carter, P. J., Coates, A. J., Coker, A. H., Fazakerley, A. N., Grande, M., Gowen, R. A., Gur-giolo, C., Hancock, B. K., Narheim, B., Preece, A., Sheather, P. H., Winningham, J. D., and Woodliffe, R. D.: PEACE: A Plasma electron and current experiment, Space Sci. Rev., 79, 351–398, 1997.
Jovanovic, D., Shukla, P. K., and Morfill, G. E.: Cylindrical lower-hybrid electron holes at the Earth’s dayside magnetopause, J. Geophys. Res., 111, A03210, doi:10.1029/2005JA011227, 2006. Keiling, A., Wygant, J. R., Cattell, C. A., Mozer, F. S., and Russell, C. T.: The global morphology of wave Poynting flux: Powering the aurora, Science, 299, 383–386, 2003a.
Keiling, A., Kim, K.-H., Wygant, J. R., Cattell, C., Russell, C. T., and Kletzing, C. A.: Electrodynamics of a substorm-related field line resonance observed by the Polar satellite in compar-ison with ground Pi2 pulsations, J. Geophys. Res., 108, 1275, doi:10.1029/2002JA009340, 2003b.
LaBelle, J. and Treumann, R. A.: Plasma waves at the dayside mag-netopause, Space Sci. Rev., 47, 175–202, 1988.
Lanzerotti, L. J., Lee, L. C., Maclennan, C. G., Wolfe, A., and Med-ford, L. V.: Possible evidence of flux transfer events in the polar ionosphere, Geophys. Res. Lett., 13, 1089–1092, 1986. Le, G. and Russell, C. T.: ISEE observations of low-latitude
bound-ary layer for northward interplanetbound-ary magnetic field: Impli-cations for cusp reconnection, J. Geophys. Res., 101, 27 239– 27 249, 1996.
Lee, L. C., Shi, Y., and Lanzerotti, L. J.: A mechanism for genera-tion of cusp region hydromagnetic waves, J. Geophys. Res., 93, 7578–7585, 1988.
Lin, C. S. and Hoffman, R. A.: Observations of inverted-V electron precipitation, Space Sci. Rev., 33, 415–457, 1982.
Lin, C. S. and Winske, D.: Simulation of the electron acoustic in-stability for a finite-size electron beam system, J. Geophys. Res., 92, 7569–7580, 1987.
Lin, C. S., Burch, J. L., and Winningham, J. D.: Near-conjugate observations of polar cusp electron precipitation using DE 1 and DE 2, J. Geophys. Res., 91, 11 186–11 202, 1986.
Lockwood, M. and Moen J.: Reconfiguration and closure of lobe flux by reconnection during northward IMF: Evidence for signa-tures in cusp/cleft auroral emissions, Ann. Geophys., 17, 996– 1011, 1999,
http://www.ann-geophys.net/17/996/1999/.
Louarn, P., Wahlund, J. E., Chust, T., de Feraudy, H., Roux, A., Holback, B., Dovner, P. P., Eriksson, A. I., and Holmgren, G.: Observation of kinetic Alfv´en waves by the FREJA spacecraft, Geophys. Res. Lett., 21, 1847–1850, 1994.
Ma, Z. W. and Lee, L. C.: A simulation study of generation of field-aligned currents and Alfv´en waves by three-dimensional mag-netic reconnection, J. Geophys. Res., 104, 10 177–10 189, 1999. Marklund, G. T., Karlsson, T., Figueiredo, S., Johansson, T., Lindqvist P.-A., Andre, M., Buchert, S., Kistler, L. M., and Faza-kerley, A.: Characteristics of quasi-static potential structures ob-served in the auroral return current region of Cluster, Nonlin. Processes Geophys., 11, Issue 5/6, 709–720, 2004.
McFadden, J. P., Carlson, C. W., and Ergun, R. E.: Microstructure of the auroral acceleration region as observed by FAST, J. Geo-phys. Res., 104(A7), 14 453–14 480, 1999.
Menietti, J. D. and Smith, M. F.: Inverted Vs spanning the cusp boundary layer, J. Geophys. Res., 98, 11 391–11 400, 1993. Menietti, J. D., Pickett, J. S., Hospodarsky, G. B., Gurnett, D. A.,
and Scudder, J. D.: Polar observations of plasma waves in and near the dayside magnetopause/magnetosheath, Planet. Space Sci., 52, 1321–1337, 2004.
Mozer, F. S., Bale, S. D., and Scudder, J. D.: Large
am-plitude, extremely rapid perpendicular electric field struc-tures at the magnetopause, Geophys. Res. Lett., 31, L15802, doi:10.1029/2004GL020062, 2004.
Mozer, F. S., Bale, S. D., McFadden, J. P., and Torbert, R. B.: New features of electron diffusion regions observed at subsolar mag-netic field reconnection sites, Geophys. Res. Lett., 32, L24102, doi:10.1029/2005GL024092, 2005.
Onsager, T. G. and Fuselier, S. A.: The location of magnetopause reconnection for northward and southward interplanetary mag-netic field, in: Solar System Plasmas in Space and Time, edited by: Burch, J. L. and Waite Jr., J. H., Geophys. Mono. 84, Amer-ican Geophysical Union, Wash. D.C., p. 183, 1994.
Onsager, T. G., Kletzing C. A., Austin, J. B., and MacKiernan, H.: Model of magnetosheath plasma in the magnetosphere: Cusp and mantle particles at low altitudes, Geophys. Res. Lett., 20, 479– 482, 1993.
Reiff, P. H.: Evidence of magnetic merging from low-altitude spacecraft and ground-based experiments, in: Magnetic Recon-nection in Space and Laboratory Plasmas, edited by: Hones, E. W., AGU Geophys Mon. 30, 103–113, AGU, Washington, D. C., 1984.
R´eme H., Bosqued, J. M., Sauvaud, J. A., Cros, A., Dandouras, J., Aoustin, C., Bouyssou, J., Camus, T., Cuvilo, J., Martz, C., M´edale, J. L., Perrier, H., Romefort, D., Rouzaud, J., d’Uston, C., M¨obius, E., Crocker, K., Granoff, M., Kistler, L. M., Popecki, M., Hovestadt, D., Klecker, B., Paschmann, G., Scholer, M., Carlson, C. W., Curtis, D. W., Lin, R. P., McFadden, J. P., Formisano, V., Amata, E., Bavassano-Cattaneo, M. B., Baldetti, P., Belluci, G., Bruno, R., Chionchio, G., DiLellis, A., Shelley, E. G., Ghielmetti, A. G., Lennartsson, W., Korth, A., Rosenbauer, H., Lundin, R., Olsen, S., Parks, G. K., McCarthy, M., and Bal-siger, H.: The Cluster Ion Spectrometry (CIS) experiment, Space Sci. Rev., 79, 303–350, 1997.
Russell, C. T. and Elphic, R. C.: Initial ISEE magnetometer results: Magnetopause observations, Space Sci. Rev., 22, 681–715, 1978. Russell C. T., Snare, R. C., Means, J. D., Pierce, D., Dearborn, D., Larson, M., Barr, G., and Le, G.: The GGS/Polar Magnetic Fields Investigation, Space Sci. Rev., 71, 563–582, 1995. Russell, C. T., Le, G., and Petrinec, S. M.: Cusp observations of
high- and low-latitude reconnection for northward IMF: An al-ternate view, J. Geophys. Res., 105, 5489–5495, 2000.
Saunders, M. A., Russell, C. T., and Sckopke: N.: Flux transfer events: Scale and interior structure, Geophys. Res. Lett., 11, 131–134, 1984.
Saunders, M. A.: Origin of the cusp Birkeland currents, Geophys. Res. Lett., 16, 151–154, 1989.
Scudder, J., Hunsackerx, F., Miller G., Lobell, J., Zawistowski, T., Ogilvie, K., Keller, J., Chornay, D., Herrero, F., Fitzenreiter, R., Fairfield, D., Needell, J., Bodet, D., Googins, J., Kletzing, C., Torbert, R., Vandiver, J., Bentley, R., Fillius, W., McIlwain, C., Whipple, E., and Korth, A.: Hydra–A 3-dimensional electron and ion hot plasma instrument for the Polar spacecraft of the GGS mission, Space Science Reviews, 71, 459–495, 1995. Scudder, J. D., Mozer, F. S., Maynard, N. C., and Russell, C. T.:
Fingerprints of collisionless reconnection at the separator: I. Ambipolar-Hall Signatures, J. Geophys. Res., 107(A10), 1294, doi:10.1029/2001JA000126, 2002.
Smith, M. F. and Lockwood, M.: The pulsating cusp, Geophys. Res. Lett., 17, 1069–1072, 1990.
Smith, M. F., Lockwood, M., and Cowley, S. W. H.: The statistical cusp: A simple flux transfer event model, Planetary Space Sci., 40, 1251–1268, 1992.
Song, P. and Russell, C. T.: Model of the formation of the low-latitude boundary layer for strongly northward interplanetary magnetic field, J. Geophys. Res., 97, 1411–1420, 1992. Southwood, D. J.: The ionsopheric signature of flux transfer events,
J. Geophys. Res., 92, 3207–3213, 1987.
Tsurutani, B. T., Lakhina, G. S., Zhang, L., Pickett, J. S., and Kasa-hara, Y.: ELF/VLF plasma waves in the low latitude boundary layer, in: Earth’s Low Latitude Boundary Layer, Geophys. Mon. 133, American Geophysical Union, pp. 189–203, 2003. Vasyliunas, V. M.: Theoretical models of magnetic field line
merg-ing, 1, Rev. Geophys. Space Phys., 13, 303–336, 1975.
Wright, A. N.: Energy sources of field-aligned currents: Au-roral electron energization, J. Geophys. Res., 110, A10S08, doi:1029/2004JA010609, 2005.
Wygant, J. R., Keiling, A., Cattell, C. A., Johnson, M., Lysak, R. L., Temerin, M., Mozer, F. S., Kletzing, C. A., Scudder, J. D., Pe-terson, W., Russell, C. T., Parks, G., Brittnacher, M., Germany, G., and Spann, J.: Polar spacecraft based comparisons of in-tense electric fields and Poynting flux near and within the plasma sheet-tail lobe boundary to UVI images: An energy source for the aurora, J. Geophys. Res., 105, 18 675–18 692, 2000.