HAL Id: hal-01214421
https://hal.archives-ouvertes.fr/hal-01214421
Submitted on 18 Nov 2020
HAL is a multi-disciplinary open access
archive for the deposit and dissemination of
sci-entific research documents, whether they are
pub-lished or not. The documents may come from
teaching and research institutions in France or
abroad, or from public or private research centers.
L’archive ouverte pluridisciplinaire HAL, est
destinée au dépôt et à la diffusion de documents
scientifiques de niveau recherche, publiés ou non,
émanant des établissements d’enseignement et de
recherche français ou étrangers, des laboratoires
publics ou privés.
Distributed under a Creative Commons Attribution - NoDerivatives| 4.0 International
photochemical sources in cloud waters collected at the
puy de Dome station - experimental versus modelled
formation rates.
A. Bianco, M. Passananti, H. Perroux, G. Voyard, C. Mouchel-Vallon, N.
Chaumerliac, Gilles Mailhot, Laurent Deguillaume, M. Brigante
To cite this version:
A. Bianco, M. Passananti, H. Perroux, G. Voyard, C. Mouchel-Vallon, et al.. A better understanding
of hydroxyl radical photochemical sources in cloud waters collected at the puy de Dome station
- experimental versus modelled formation rates.. Atmospheric Chemistry and Physics, European
Geosciences Union, 2015, 15, pp.9191-9202. �10.5194/acp-15-9191-2015�. �hal-01214421�
www.atmos-chem-phys.net/15/9191/2015/ doi:10.5194/acp-15-9191-2015
© Author(s) 2015. CC Attribution 3.0 License.
A better understanding of hydroxyl radical photochemical sources
in cloud waters collected at the puy de Dôme station – experimental
versus modelled formation rates
A. Bianco1,2,*, M. Passananti1,2,*, H. Perroux3,4, G. Voyard1,2, C. Mouchel-Vallon3,4, N. Chaumerliac3,4, G. Mailhot1,2, L. Deguillaume3,4, and M. Brigante1,2
1Université Clermont Auvergne, Université Blaise Pascal, Institut de Chimie de Clermont-Ferrand, BP 10448,
63000 Clermont-Ferrand, France
2CNRS, UMR 6296, ICCF, 63171 Aubiere, France
3Université Clermont Auvergne, Université Blaise Pascal, Laboratoire de Météorologie Physique, BP 10448,
63000 Clermont-Ferrand, France
4CNRS, UMR 6016, LaMP, 63171 Aubiere, France *These authors contributed equally to this work.
Correspondence to: L. Deguillaume ([email protected])
and M. Brigante ([email protected])
Received: 15 April 2015 – Published in Atmos. Chem. Phys. Discuss.: 18 May 2015 Revised: 15 July 2015 – Accepted: 30 July 2015 – Published: 19 August 2015
Abstract. The oxidative capacity of the cloud aqueous phase is investigated during three field campaigns from 2013 to 2014 at the top of the puy de Dôme station (PUY) in France. A total of 41 cloud samples are collected and the correspond-ing air masses are classified as highly marine, marine and continental. Hydroxyl radical (HO q) formation rates (RHOf q) are determined using a photochemical setup (xenon lamp that can reproduce the solar spectrum) and a chemical probe cou-pled with spectroscopic analysis that can trap all of the gen-erated radicals for each sample. Using this method, the ob-tained values correspond to the total formation of HO q with-out its chemical sinks. These formation rates are correlated with the concentrations of the naturally occurring sources of HO q, including hydrogen peroxide, nitrite, nitrate and iron. The total hydroxyl radical formation rates are measured as ranging from approximately 2 × 10⁻¹¹ to 4 × 10⁻¹⁰M s−1, and the hydroxyl radical quantum yield formation (8HOq)
is estimated between 10−4 and 10−2. Experimental values
are compared with modelled formation rates calculated by the model of multiphase cloud chemistry (M2C2), consider-ing only the chemical sources of the hydroxyl radicals. The comparison between the experimental and the modelled re-sults suggests that the photoreactivity of the iron species as a source of HO q is overestimated by the model, and H2O2
photolysis represents the most important source of this radi-cal (between 70 and 99 %) for the cloud water sampled at the PUY station (primarily marine and continental).
1 Introduction
In the atmosphere, many trace gases are transformed by the hydroxyl radical (HO q), which is considered the most effi-cient environmental oxidant (e.g. Seinfeld and Pandis, 2006). Evaluating the production of this short-lived species is cru-cial because it determines the fate of many chemical com-pounds. In atmospheric water drops and aqueous particles, the hydroxyl radical also controls the fate of inorganic and or-ganic species (Herrmann et al., 2010). The HO q-mediated ox-idation of organic compounds in the aqueous phase can lead to the formation of shorter but often multifunctional organic species and, ultimately, to complete mineralization (Char-bouillot et al., 2012). Complex chemical reactions catalysed by HO q can also occur in the aqueous phase forming accre-tion products such as oligomers (Altieri et al., 2008; Carl-ton et al., 2007; Perri et al., 2009; Tan et al., 2012; Ervens and Volkamer, 2010; De Haan et al., 2009). These alternative
chemical pathways are efficient processes to convert organic compounds into secondary organic aerosols (SOAs) (Ervens et al., 2011).
The sources of hydroxyl radicals in the aqueous phase strongly differ from those in the gas phase because of the presence of ionic species and metal ions. Aqueous phase re-actants that produce HO q present high concentrations in wa-ter drops and aqueous particles, likely enhancing the HO q photochemical production in the condensed phase. This rad-ical can be generated in the aqueous phase by direct photol-ysis of hydrogen peroxide (H2O2)(Herrmann et al., 2010;
Yu and Barker, 2003), iron complexes (Deguillaume et al., 2005), nitrate (NO−3)(Zellner et al., 1990) and nitrite ions (NO−2)(Zafiriou and Bonneau, 1987). The other significant source of HO q in cloud water is the uptake from the gas phase (Arakaki and Faust, 1998). The relative importance of the different hydroxyl radical sources depends on the chemi-cal composition of the aqueous phase, which is also strongly variable (Deguillaume et al., 2014). HO q is further scavenged in the aqueous phase, primarily by dissolved organic com-pounds. Evaluation of this sink is difficult because the dis-solved organic matter is diverse, complex and poorly charac-terized (Herckes et al., 2013).
Uncertainties in HO q sinks and sources make its concen-trations in atmospheric water highly difficult to estimate. For this estimation, models describing the multiphase cloud chemistry have been developed and have considered the re-activity in the gas and aqueous phases along with the mass transfer between the two phases (Ervens et al., 2014; Long et al., 2013; Tilgner and Herrmann, 2010). These numeri-cal tools allow for the estimation of the steady-state concen-tration of HO q ([HO q]ss), which is a crucial quantity to
un-derstand the fate of atmospheric pollutants (Arakaki et al., 2013). The range of the maximal HO q concentration varies from 10−16 to 10−12M, depending on the “chemical sce-nario” (i.e. emission/deposition and the initial chemical con-ditions) used in the modelling study. The amounts of organic matter and iron are key parameters controlling the [HO q]ss.
These models are expected to underestimate the radical sinks because organic scavengers cannot be exhaustively described in the aqueous chemical mechanism (Arakaki et al., 2013).
In this study, we propose the investigation of the hydroxyl radical formation in real cloud water sampled at the puy de Dôme (PUY; France). The hydroxyl radical formation rate is quantified for 36 cloud water samples collected during three field campaigns (2013–2014). Because the main pho-tochemical sources (hydrogen peroxide, iron, nitrite and ni-trate) are also quantified, we can calculate their relative con-tributions to the production of the hydroxyl radicals. For this purpose, the contribution to the hydroxyl radical formation rate of more concentrated inorganic photochemical sources is investigated separately in a synthetic solution. In parallel, the model of multiphase cloud chemistry (M2C2) is used to simulate HO q formation rates. This model considers explicit
aqueous chemical mechanisms, and a “simplified” version of the model is used to reproduce the bulk water irradiation ex-periments (lamp spectrum) under variable physico-chemical conditions (pH, initial concentrations of HO q sources) cor-responding to the cloud water samples. The comparison be-tween the modelled and experimental HO q production rates facilitates quantification of the various HO q sources and en-ables validation of the model to reproduce the oxidative ca-pacity of the atmospheric aqueous phase.
2 Materials and methods 2.1 Chemicals
Hydrogen peroxide (30 % in water, not stabilized), sodium nitrate (purity > 99 %) and ferrozine (purity > 97 %) were obtained from FLUKA, while sodium nitrite (purity > 98 %) and terephthalic disodium salt (purity > 99 %) were pur-chased from Prolabo and Alfa Aesar, respectively. All of the other chemicals (purity reagent grade) used for the analysis were obtained from Sigma-Aldrich.
Solutions are prepared with deionized ultra-pure aerated Milli-Q water from Millipore (resistivity = 18.2 M cm) un-der a laminar flux hood. Moreover, glass containers and in-jection material are washed 3 times with ultrapure water be-fore use. If necessary, the pH values are adjusted with per-chloric acid (1 N) and NaOH (1 N) using a Jenway 3310 pH meter within ±0.01 pH units. All of the solutions are stored under dark conditions and the final preparations are performed in a room equipped with a sodium lamp (589 nm emission).
2.2 Cloud water sampling
Cloud water is sampled at the PUY station (48◦N, 2◦E; 1465 m a.s.l.) in the Massif Central region (France). Three campaigns occurred during autumn 2013 from 14 October to 6 November, during spring and autumn 2014 from 22 March to 5 April and from 4 to 19 November. During these peri-ods, the station was primarily located in the free troposphere; thus, the air masses from various origins were not influenced by the local pollution (Hervo, 2013).
The cloud droplet sampling is performed by a one-stage cloud droplet impactor (Deguillaume et al., 2014). With the air flux used, the lower limit of the aerodynamic diameter is approximately 7 µm (Brantner et al., 1994). The impactor used for this study is constructed of stainless steel and alu-minum, and cloud droplets are collected by impaction onto a rectangular aluminum plate with an average sampling time of 2 h. Cloud water samples are filtered using a 0.45 µm PTFE (polytetrafluoroethylene) filter within 10 min after sampling to eliminate all of the microorganisms and particles that can interfere with the spectroscopic analysis.
Measurements performed immediately after cloud collec-tion are conductivity, redox potential, pH, UV–visible
spec-troscopy, H2O2 and iron concentrations. Ion
chromatogra-phy (IC), total organic carbon (TOC), and nitrite analysis are determined less than 24 h after sampling. At each stage, sampling and analyses are performed with the greatest pre-caution to minimize all possible external contaminations and the solutions are stored at 277 K under dark conditions. Hy-droxyl radical formation rates (RfHOq) and polychromatic quantum yields (8HOq) are calculated using polychromatic
wavelengths.
2.3 Physico-chemical measurements
Different parameters are monitored, including pH, conduc-tivity and redox potential, which are measured using a Hanna multiparameter instrument. The UV–visible spectrum of the collected cloud water is determined with an Agilent Tech-nologies Cary 60 UV–visible spectrophotometer. The TOC concentration is determined with a TOC 5050A analyser (Shimadzu). Hydrogen peroxide concentration is estimated using p-hydroxyphenylacetic acid (HPAA, purity > 98 %) and horseradish peroxidase (POD) (solid containing 150– 200 units per milligram), according to the spectrofluorimet-ric quantification method (Miller and Kester, 2002). The formation of the dimer of HPAA is correlated with the concentration of hydrogen peroxide and is detected using a Varian Cary Eclipse fluorescence spectrophotometer set-ting excitation wavelengths at 320 nm, while emission is registered from 340 and 500 nm. The maximum signal is quantified at 408 nm. The scan rate is 600 nm min−1, and a bandpass of 10 nm is set for excitation and emission. The nitrite ions concentration is determined by derivatization with 2,4-dinitrophenylhydrazine (DNPH) (purity > 97 %), in acidic solution (HCl 37 %). The UV-absorbing derivative (2,4-dinitrophenilazide) is detected by HPLC. The HPLC system (Waters Alliance) equipped with a diode array de-tector is used with an Eclipse XDB-C18 column (Agilent, 4.6 × 150 mm, 5 µm) and an isocratic method is adopted using 40 % acidified water (0.1 % phosphoric acid) and 60 % methanol. The flow rate is 1 mL min−1, and 2,4-dinitrophenilazide) is eluted with a retention time of 4.1 min (Kieber and Seaton, 1995) and detected at 307 nm. Fe(II) and Fe(III) concentrations are determined by the spec-trophotometric method by complexation with ferrozine (pu-rity > 97 %), as described by Stookey (1970). Fe(II) and Fe(III) represent the oxidative state of the iron species. The adopted complexation method allows us to determine all Fe(II) and Fe(III) species present in solution (i.e. considered as free, aqua complexes and as complex with other organic molecules). Ascorbic acid (purity reagent grade) is used as the reducing agent to determine total iron. The complex ab-sorption is measured with a Varian Cary 300 scan spec-trophotometer at 562 nm.
It has been previously demonstrated that filtration does not modify the soluble iron quantification in natural cloud water samples (Parazols et al., 2006; Vaitilingom et al., 2013). It
is not possible to measure particulate iron because the fer-rozine method cannot solubilize solid phase-iron (the con-tact time between acidic reagents and particulate iron is too short). Moreover, the iron particle is expected to be less reac-tive than the solubilized iron; consequently, its contribution can be neglected (Arakaki and Faust, 1998).
Ion chromatography (IC) analysis is performed employing a Dionex DX-320 equipped with an IonPac AG11 (guard-column 4 × 50 mm) and an IonPac AS11 (analytical (guard-column 5 × 250 mm) for anions and a Dionex ICS-1500 equipped with an IonPac CG16 (guard-column 4 × 50 mm) and an Ion-Pac CS16 (analytical column 5 × 250 mm) for cations.
2.4 Statistical analysis
The principal component analysis (PCA) and hierarchical clustering analysis (HCA) are performed with R 3.1.2 soft-ware (R Core Team, 2013) using the FactoMineR package (version 1.28; Lê et al., 2008). This statistical analysis pro-vides a synthetic representation of experimental data as a function of the correlations between variables considered and similarities present among the analysed samples. This tech-nique allows for the determination of information contained in a set of multivariate data, summarizing it in a few linear combinations of the variables (Deming et al., 1988). HCA data are grouped by similarity, considering all of the infor-mation contained in the data set. HCA is a statistical method to qualitatively study the composition of cloud water and can be used to identify the grouping variables that are not well detectable using only PCA.
2.5 Irradiation experiments
To evaluate the contribution of each possible photochemical source (nitrate, nitrite or hydrogen peroxide) to the hydroxyl radical formation in cloud water, synthetic solutions doped with a single source of oxidant are irradiated to quantify their contribution to the total generation of hydroxyl radicals in a more complex medium.
The photochemical device is composed of a xenon lamp equipped with a water cooler to avoid the increase of temper-ature due to the infrared radiations and a mirror to reflect the light vertically. A Pyrex filter was located before the reactor to filter light at wavelengths below 290 nm, corresponding to the lowest wavelengths of the solar emission spectrum. The reactor is a 40 mL cylindrical Pyrex container cooled by wa-ter circulation at a temperature of 278 ± 2 K to limit thermal reactions. Samples are continuously stirred with a magnetic stirrer using a Teflon bar to ensure homogeneity.
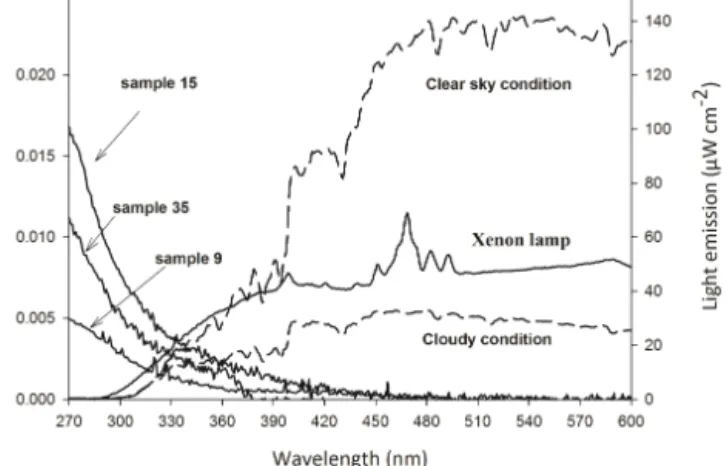
In Fig. 1, the emission spectrum of the lamp recorded us-ing fiber optics coupled with a charge-coupled device (CCD) spectrophotometer (Ocean Optics USD 2000+UV-VIS) is reported. The energy was normalized with the actinometry results using a paranitroanisole (PNA)/pyridine actinometer (Dulin and Mill, 1982). Over the wavelength range of 290–
Figure 1. Absorption spectra of different cloud water samples on the left axis; the right axis shows the emission spectrum of the adopted xenon lamp reaching solutions over the range of 290– 600 nm (total flux intensity = 157 W m−2)compared with the sun emission spectrum (dashed line) for a sunny (353 W m−2)and a cloudy day (90 W m−2)in October 2013.
600 nm, a total flux of 157 W m−2is measured. The intensity values of the sun’s emissions under clear-sky and cloudy con-ditions at puy de Dôme in autumn 2013 are also presented in Fig. 1.
2.6 Hydroxyl radical formation rate and quantum yield determination
The hydroxyl radical formation rate is determined us-ing terephthalate (TA) (terephthalic disodium salt, pu-rity > 99 %) as a probe (Charbouillot et al., 2011). Forma-tion of hydroxyterephthalate (TAOH) is quantified using a Varian Cary Eclipse fluorescence spectrophotometer, setting excitation wavelengths at 320 nm while the emission maxi-mum is measured at 420 nm. The scan rate is 600 nm min−1 and a bandpass of 10 nm is set for excitation and emission. Terephthalate is a useful probe because it allows for the de-termination of hydroxyl radical formation rates in the pres-ence of fluorescent dissolved organic matter. The concentra-tion of the probe is in a large excess (2 mm) compared with the concentration of organic matter to trap all of the photo-generated hydroxyl radicals and then to estimate a value for the hydroxyl radical formation rate not affected by depletion of HO q by other sinks.
The reaction between TA and the hydroxyl radical leads to the formation of fluorescent TAOH and non-fluorescent secondary products (Reaction R1) as follows:
TA + HO q → TAOH + products. (R1)
The degradation rate of TA (RTAd )and formation rates of the hydroxyl radical (RfHOq) and TAOH (RTAOHf )can be
ex-pressed as follows: RHOf q ≈ RTAd ≈R f TAOH γ , (1) with RTAd =kHOq,TA[HO q] [TA] , (2)
where kHOq,TA=4.0 × 10⁹M−1s−1is the second-order rate
constant of the reaction between HO q and TA (Charbouillot et al., 2011), [TA] is the initial concentration of terephthalate and γ is the TAOH formation yield calculated as a function of solution pH. This value is found to be linearly correlated with the pH value and is estimated between the values of 0.15 and 0.25 over the pH range of 4–7.
Other radicals, such as sulfate (SO4q−) or chlo-rine/dichlorine (Cl q/ Cl2q−), can react with TA, leading to the H abstraction as first chemical reaction. However, their direct generation is nearly exclusively due to the electron transfer reaction from the corresponding anion (i.e. SO2−4 and Cl−, respectively) to the hydroxyl radical. Moreover, considering that the second-order rate constant of aromatic compounds with the dichloride radical anion and the sulfate radical is expected to be 1 or 2 orders of magnitude lower than that with the hydroxyl radical (Neta et al., 1988), and considering a relatively low concentration of sulfate and dichlorine radicals in our cloud samples, the TA reactivity can be attributed exclusively to the HO q.
The quantum yield of hydroxyl radical formation (8HO290−400 nmq )is defined as the ratio between the formation rate of HO q (RHOf q) and the number of absorbed photons in einstein per unit of time in the overlap range of 290–600 (λ1
and λ2)(Eq. 3).
This value evaluates the photochemical process efficiency independently of the experimental photochemical conditions.
8HO290-400 nmq =R
f HOq
Ia , (3)
where Iacan be calculated from the following equation:
Ia= λ2
Z λ1
I0(λ)(1 − 10−Abs(λ))dλ, (4)
where I0(photons m−2s−1)is the incident photon flux
cor-responding to the lamp emission and Abs is the absorption of cloud water (normalized considering the optical path length of 5 cm inside of the thermostated reactor).
2.7 Back-trajectory plots
Backward trajectories of collected air masses are calculated using the HYSPLIT (HYbrid Single-Particle Lagrangian Integrated Trajectory) model with the GDAS1 (Global
Data Assimilation System) meteorological data archive and the model of vertical velocity (http://ready.arl.noaa.gov/ HYSPLIT.php, HYSPLIT, 2012). Backward trajectories are calculated for 72 h.
2.8 Model description
The M2C2 combines detailed multiphase chemistry along with the parameterization of the microphysics (Leriche et al., 2001, 2000; Deguillaume et al., 2004). In particular, the de-tailed chemistry of HxOy, chlorine, carbonates, NOy, sulfur,
transition metal ions (iron, copper, manganese) and the ox-idation of volatile organic compounds (VOCs) is included. Photolysis rates are calculated in the gaseous and aqueous phases, and the pH is calculated following the H+ concentra-tion. Numerical results consist of following the time evolu-tion of the concentraevolu-tions of each chemical species and cal-culating at each time step the relative contribution of chemi-cal reactions in the production/destruction of chemichemi-cal com-pounds.
In this study, a simplified version of the model is used. The cloud chemical mechanism is restricted to inorganic chem-istry (HxOy, nitrogen, iron) that leads to the HO q formation
(see Table S1 in the Supplement for details about the con-sidered reactions). The complexation of iron by oxalate is also considered in the model because it can interfere with the HO q formation rates (Long et al., 2013). Laboratory ir-radiation experiments are simulated with the M2C2 model considering its chemical module and neglecting microphysi-cal processes and mass transfer parameterizations. Tempera-ture and pH remained constant during the simulation time. We set the pH for each cloud water sample to the values reported in Table S2 and the temperature is fixed at 278 K, which corresponds to the temperature of the irradiated so-lutions. The simulated irradiation intensity is held constant and homogenous throughout the experiment. The actinic flux of the experimental lamp is discretized in the tropospheric ultraviolet–visible (TUV) model in 156 non-regular inter-vals over a wavelength range of 120–750 nm (Madronich and Flocke, 1999). The photolysis rates of the chemical species are calculated in TUV according to the experimental quan-tum yields and absorption cross sections and are indicated in Table S1. Experimental chemical concentrations (Table S2) are used to initialize the model (H2O2, nitrite, nitrate, iron).
Moreover, oxalic acid is considered as an organic complexant during the Fe(II)/Fe(III) cycle. The formation rate of HO q is calculated by the model considering the modelled contribu-tion of each reaccontribu-tion producing HO q during 1 h of experi-ment.
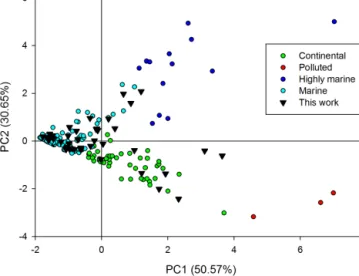
Figure 2. Scores plot obtained by PCA analysis of 137 sam-ples (corresponding to 73 cloud events) collected before 2013 and grouped in four classes in function of the previously described clas-sification (Deguillaume et al., 2014) and 41 samples (numbered from 80 to 120) collected during 2013 and 2014. These new data correspond to 15 cloud events and are indicated in black triangles. Statistical analysis is performed using six selected variables (pH, [Na+], [Cl−], [SO2−4 ], [NO−3], and [NH+4]). The scree plot ob-tained from autoscaled data shows two selected principal compo-nents (PCs) containing a total variance of about 81 %.
3 Results and discussion
3.1 Classification of cloud samples
Recently, physicochemical parameters and concentrations of the major organic and inorganic compounds of cloud samples collected over the last 10 years at the puy de Dôme are mea-sured and statistically analysed by PCA (Deguillaume et al., 2014). Along with the corresponding back-trajectory plots, four different categories of air masses reaching the summit of the PUY could be distinguished as polluted, continental, marine and highly marine. Highly marine clouds exhibited high concentrations of Na+and Cl−, and the marine category presented a lower concentration of ions but more elevated pH, while the two remaining clusters, classified as continen-tal and polluted, are characterized by the second-highest and highest levels of NH+4, NO−3, and SO2−4 , respectively.
In Table S2, the measured physico-chemical composition of the cloud water samples is reported for this study. We use the same statistical analysis to classify these cloud water samples as Deguillaume et al. (2014). PCA is performed us-ing the pH and the concentration of sulfate, nitrate, chloride, sodium and ammonium ions as variables. Figure 2 reports the scores plot for samples used for the previously reported clas-sification as a function of the attributed class and for the new samples. Three types are identified as (i) highly marine, (two samples) characterized by pH values of 5.0 and 5.6,
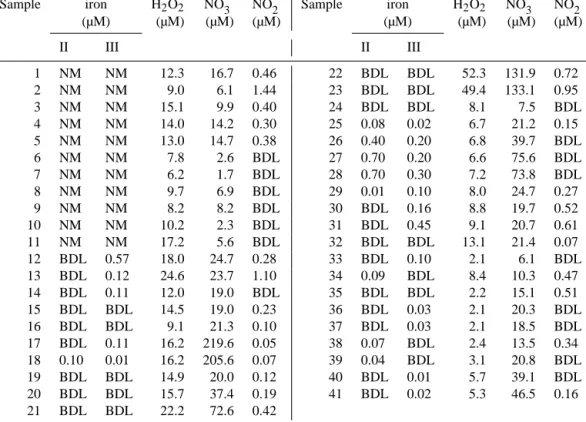
respec-Table 1. Concentration of main sources of hydroxyl radical in sampled clouds. A total of 41 samples have been analysed. BDL: below detection limit (0.01 µM for iron and 0.05 µM for NO−2). NM: not measured.
Sample iron H2O2 NO−3 NO − 2 Sample iron H2O2 NO−3 NO − 2 (µM) (µM) (µM) (µM) (µM) (µM) (µM) (µM) II III II III 1 NM NM 12.3 16.7 0.46 22 BDL BDL 52.3 131.9 0.72 2 NM NM 9.0 6.1 1.44 23 BDL BDL 49.4 133.1 0.95 3 NM NM 15.1 9.9 0.40 24 BDL BDL 8.1 7.5 BDL 4 NM NM 14.0 14.2 0.30 25 0.08 0.02 6.7 21.2 0.15 5 NM NM 13.0 14.7 0.38 26 0.40 0.20 6.8 39.7 BDL 6 NM NM 7.8 2.6 BDL 27 0.70 0.20 6.6 75.6 BDL 7 NM NM 6.2 1.7 BDL 28 0.70 0.30 7.2 73.8 BDL 8 NM NM 9.7 6.9 BDL 29 0.01 0.10 8.0 24.7 0.27 9 NM NM 8.2 8.2 BDL 30 BDL 0.16 8.8 19.7 0.52 10 NM NM 10.2 2.3 BDL 31 BDL 0.45 9.1 20.7 0.61 11 NM NM 17.2 5.6 BDL 32 BDL BDL 13.1 21.4 0.07 12 BDL 0.57 18.0 24.7 0.28 33 BDL 0.10 2.1 6.1 BDL 13 BDL 0.12 24.6 23.7 1.10 34 0.09 BDL 8.4 10.3 0.47 14 BDL 0.11 12.0 19.0 BDL 35 BDL BDL 2.2 15.1 0.51 15 BDL BDL 14.5 19.0 0.23 36 BDL 0.03 2.1 20.3 BDL 16 BDL BDL 9.1 21.3 0.10 37 BDL 0.03 2.1 18.5 BDL 17 BDL 0.11 16.2 219.6 0.05 38 0.07 BDL 2.4 13.5 0.34 18 0.10 0.01 16.2 205.6 0.07 39 0.04 BDL 3.1 20.8 BDL 19 BDL BDL 14.9 20.0 0.12 40 BDL 0.01 5.7 39.1 BDL 20 BDL BDL 15.7 37.4 0.19 41 BDL 0.02 5.3 46.5 0.16 21 BDL BDL 22.2 72.6 0.42
tively, high concentration of chloride and sodium and low concentrations of nitrate, nitrite and ammonium; (ii) marine cloud waters (28 samples), showing pH values between 4.7 and 7.6 and very low concentrations of anions and cations; and (iii) continental samples (11 samples), with pH values from 4.1 to 6.9 and a medium concentration of nitrates, sul-fates and ammonium, while sodium and chloride concentra-tions are very low. No sample could be classified as polluted cloud water because polluted cloud waters have been charac-terized by concentrations of nitrates, sulfates and ammonium higher than 350, 70 and 330 µM, respectively. This statistical analysis confirms that the majority of the collected samples are of marine origin. This statistical analysis is confirmed by the back-trajectory plots from the HYSPLIT model, showing that most of the air masses reaching the puy de Dôme arise from the west sector i.e. from the Atlantic Ocean.
3.2 Determination of the hydroxyl radical formation rates and photolysis rates
The concentration of the main photochemical sources of HO q for each sample is reported in Table 1. In particular, the Fe(II) and Fe(III) concentrations are below the detection limit (0.01 µM) for the majority of the collected samples. The highest value found for the Fe(II) concentration is 0.7 µM, while it is 0.6 µM for Fe(III), corresponding to typical values found for marine origin cloud waters (Parazols et al., 2006).
The H2O2concentration values range between 6 and 50 µM
and nitrate is evaluated between 2 and 220 µM, while the ni-trite concentration is between 0 and 1.4 µM.
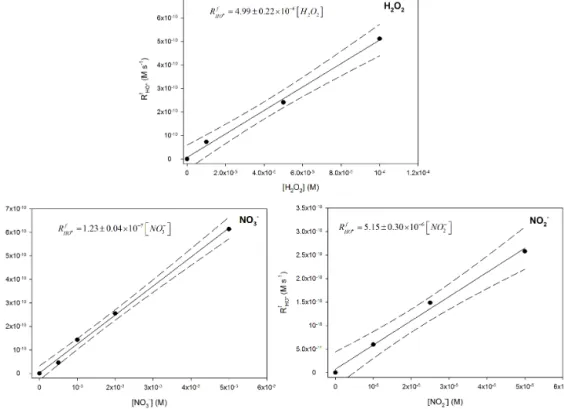
The RfHOq was measured in pure water doped with dif-ferent concentrations of hydrogen peroxide, nitrate and ni-trite on the same order of magnitude as the collected natural samples. The conditions were those used for natural cloud samples (see Sect. 2.6). A linear correlation between RfHOq and the concentrations of photochemical precursors is found (Fig. 3). The photolysis rate (J ) (s−1)is then estimated from the slopes and reported in Table 4. For H2O2, the J value is
half of the experimental slope because H2O2 provides two
HO q radicals.
RHOf q is determined for 36 samples, and its value is
esti-mated between 3.3 × 10⁻¹² and 4.2 × 10⁻¹⁰M s−1. Higher values are obtained for cloud water samples of continental origin, while the values found for marine and highly marine cloud waters are less than 1.4 × 10⁻¹⁰M s−1. The quantum yield of the formation of hydroxyl radicals under polychro-matic irradiation between 290 and 400 nm (8HO290−400 nmq ; see Eq. 3) is estimated as between 10−5and 10−2. (Table 2).
To our knowledge, only a scarce number of data are avail-able in the literature concerning measurements of RfHOq and formation quantum yield (8HOq)in real cloud waters (Ta-ble 3). Faust and Allen (1993) measured the photoformation rates of HO q (ranging from 1.3 to 8.3 × 10⁻¹⁰M s−1)under
Figure 3. Scatter plots of hydroxyl radical formation rates vs. hydrogen peroxide, nitrate and nitrite concentrations using 2 mm of TA at pH 5.0 under xenon lamp irradiation. The solid line is the linear fit and dashed lines denote the 90 % confidence of the linear fit.
Table 2. RHOf q(M s−1)and hydroxyl radical polychromatic quantum yield formation (8HOq(290-400 nm))values estimated from cloud water
samples. NM: not measured. Mar: Marine. H-Mar: Highly Marine. Cont: Continental influence. The errors on RfHOqare derived at the 1σ level simply from the scattering of experimental data.
Sample RfHOq(M s−1) 8290-400 nmHOq Class Sample RfHOq(M s−1) 8290-400 nmHOq Class 1 (3.30 ± 0.23) × 10−11 1.27 × 10⁻³ Mar 22 (3.37 ± 0.01) × 10−10 2.5 × 10⁻³ Cont 2 NM NM Mar 23 (4.16 ± 0.01) × 10−10 1.8 × 10⁻³ Cont 3 NM NM Mar 24 (5.10 ± 0.01) × 10−10 NM Mar 4 (1.40 ± 0.01) × 10−10 1.0 × 10⁻² H-Mar 25 (2.42 ± 0.08) × 10−11 1.9 × 10⁻⁴ Cont 5 (1.24 ± 0.02) × 10−10 6.0 × 10⁻³ H-Mar 26 (1.41 ± 0.01) × 10−10 3.4 × 10⁻³ Cont 6 (2.77 ± 0.01) × 10−11 1.5 × 10⁻⁴ Mar 27 (4.95 ± 0.01) × 10−11 1.5 × 10⁻⁴ Cont 7 (5.60 ± 0.06) × 10−11 9.0 × 10⁻³ Mar 28 NM NM Cont 8 (2.48 ± 0.01) × 10−11 2.9 × 10⁻³ Mar 29 (8.48 ± 0.04) × 10−11 1.3 × 10⁻⁴ Mar 9 (2.20 ± 0.02) × 10−11 1.8 × 10⁻³ Mar 30 (8.43 ± 0.02) × 10−11 1.2 × 10⁻⁴ Mar 10 (2.93 ± 0.02) × 10−11 2.4 × 10⁻³ Mar 31 (6.11 ± 0.21) × 10−11 5.1 × 10⁻⁵ Mar 11 (6.77 ± 0.02) × 10−11 2.7 × 10⁻³ Mar 32 NM NM Mar 12 (6.10 ± 0.19) × 10−11 1.7 × 10⁻⁴ Mar 33 (3.27 ± 0.23) × 10−12 1.3 × 10⁻⁵ Mar 13 (4.66 ± 0.01) × 10−11 1.5 × 10⁻⁴ Mar 34 (2.73 ± 0.01) × 10−11 8.5 × 10⁻⁴ Mar 14 (2.81 ± 0.01) × 10−11 2.0 × 10⁻⁴ Mar 35 (3.60 ± 0.30) × 10−11 6.0 × 10⁻⁴ Mar 15 (1.09 ± 0.04) × 10−11 9.0 × 10⁻⁵ Mar 36 (5.97 ± 0.12) × 10−11 9.6 × 10⁻⁵ Mar 16 NM NM Mar 37 (2.41 ± 0.04) × 10−11 8.4 × 10⁻⁵ Mar 17 (6.05 ± 0.44) × 10−11 4.1 × 10⁻⁵ Cont 38 (5.76 ± 0.13) × 10−11 2.7 × 10⁻⁴ Mar 18 (3.39 ± 0.20) × 10−11 3.2 × 10⁻⁵ Cont 39 (2.69 ± 0.04) × 10−11 1.1 × 10⁻⁴ Mar 19 (8.11 ± 0.02) × 10−11 1.9 × 10⁻⁴ Mar 40 (1.27 ± 0.01) × 10−10 2.6 × 10⁻⁴ Cont 20 (8.46 ± 0.01) × 10−11 8.4 × 10⁻³ Mar 41 (1.09 ± 0.01) × 10−10 5.1 × 10⁻⁴ Cont 21 (1.54 ± 0.01) × 10−10 1.5 × 10⁻³ Cont
Figure 4. Distribution of the bias error for all cloud water samples (black) and for cloud samples discretized as a function of different iron concentration ranges (in colour). The bias error is defined by the ratio (RHOf qmod −RfHOqexp) /RfHOqexp (in %). The number of samples analysed is indicated above each boxplot. The bottom and top lines correspond to the 25th and 75th percentiles, respectively. The full line represents the median values. The ends of the whiskers are the 10th and 90th percentiles.
monochromatic light (313 nm) and hydroxyl radical quan-tum yield (between ∼ 5 × 10⁻⁴ and 10−2)of six continen-tal cloud water samples. Anastasio and McGregor (2001) in-vestigated the photoreactivity of two cloud waters from the Tenerife Islands to compare the obtained values with fog waters. The authors found RfHOq ranging between 3.0 and 6.9 × 10⁻¹⁰M s−1, which are approximately 1 order of mag-nitude higher than those reported in this study for marine cloud waters, and the differences can be attributed to the air mass origin, as suggested by Faust and Allen (1993). The authors suggested that long-range terrestrial aerosol and gas transport in continental clouds could provide an additional source of hydroxyl radicals compared with other marine or remote clouds.
3.3 Modelling the hydroxyl radical formation rates We simulate the hydroxyl formation rate, RfHOq mod, us-ing the model along with the relative contribution (%) of each chemical source (Table S3). In Fig. 4, the differ-ences between the modelled and experimental HO q forma-tion rates are estimated calculating the bias error ((RHOf qmod
−RfHOqexp)/RfHOqexp in (%)). Globally, for the whole cloud
water samples (black boxplot), the model can reproduce the range of measured hydroxyl radical formation rates with a slight model underestimation (median of the bias error equal to −23 %). However, if the cloud samples are discretized as a function of different iron concentration ranges (boxplots in
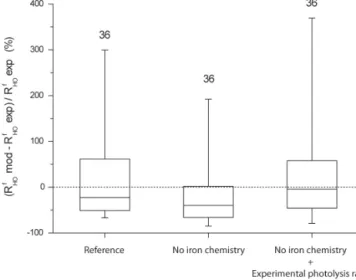
Figure 5. Distribution of the bias error for all cloud water samples for the reference case and for two sensitivity tests performed with the model: (i) with the iron chemistry (photolysis of Fe(III) and the Fenton reaction) neglected in the model; and (ii) with the iron chemistry neglected and the new photolysis rate constants obtained from experimental measurements implemented in the model. The bias error is defined by the ratio (RHOf qmod −RfHOqexp) /RHOf qexp (in %).The number of samples analysed is indicated above each boxplot. The bottom and top lines correspond to the 25th and 75th percentiles, respectively. The full line represents the median values. The ends of the whiskers are the 10th and 90th percentiles.
colour), then the model tends to overestimate the hydroxyl radical formation for iron concentrations (Fe(II) + Fe(III)) higher than 0.1 µM. For concentrations of iron between 0.1 and 0.4 µM (eight cloud samples), the median of the bias er-ror is 61 % whereas for iron concentrations over 0.4 µM (five cloud samples) the median reaches 260 %. For cloud sam-ples in which the iron concentration is 0.4 µM, the modelled contribution to the hydroxyl radical formation of iron (Fen-ton reaction and photolysis of aqua-complexes) can reach 80 % (Table S3). In the model, Fe(III) is partially complexed with oxalic acid but the majority of iron for these cloud samples is simulated as aqua-complexes (mainly Fe(OH)2+ and Fe(OH)+2). Therefore, iron can act as a significant HO q source due to its efficient photolysis (Reactions R7, R8, R9 in Table S1) and the Fenton reaction with H2O2(Reaction R11
in Table S1).
However, in atmospheric natural water, the chemical com-position of organic matter is still not very well character-ized (Herckes et al., 2013). Part of this organic matter is ex-pected to efficiently complex metals in cloud water (Okochi and Brimblecombe, 2002). Due to missing information about the iron speciation and complexation in natural cloud water, the model probably overestimates the free Fe(III). Moreover, iron organic complexes are not expected to directly gener-ate hydroxyl radicals but primarily contribute to the oxida-tive capacity via Fe(II) generation and the Fenton process.
Table 3. RHOf q(M s−1)and polychromatic quantum yield (8HOq)found in the literature and in this work.
RfHOq(M s−1) 8qOH References
Rain water 2.0–6.5 × 10⁻¹¹ Albinet et al. (2010)
Cloud water 1.3–8.3 × 10⁻¹⁰ 4.6 × 10⁻⁴−1.0 × 10⁻² at 313 nm Faust and Allen (1993)
Fog 0.9–6.9 × 10⁻¹⁰
Aqueous extracted aerosol particles 0.4–3.8 × 10⁻¹⁰ 3.0 × 10⁻⁴−1.7 × 10⁻³ Arakaki et al. (2006)
Cloud water 3.1–6.9 × 10⁻¹⁰ Anastasio and McGregor (2001)
Cloud water 0.3–5.9 × 10⁻¹⁰ 5.1 × 10⁻⁴−3.0 × 10⁻³ Arakaki and Faust (1998) Cloud water at the PUY station 0.2–4.2 × 10⁻¹⁰ 1.3 × 10⁻⁵−1.0 × 10⁻²polychromatic This work
Table 4. Modelled photolysis rates calculated by the model versus experimental photolysis rates obtained from experiments reported in Fig. 3.
Modelled photolysis rates J (s−1) Experimental photolysis rates J (s−1)
H2O2−→hν 2 HOq 1.52 × 10⁻⁶ (2.50 ± 0.11) × 10−6 HNO2 hν −→HOq+NOq 6.16 × 10⁻⁵ NO−2 +H2O hν −→HOq+NOq+HO− 9.98 × 10⁻⁶ (5.15 ± 0.30) × 10−6 NO−3 +H2O hν −→HOq+NO2q+HO− 6.71 × 10⁻⁸ (1.23 ± 0.04) × 10−7 Fe3++H2O hν −→HOq+Fe2++H+ 1.24 × 10⁻⁶ Fe(OH)2+ hν−→HOq+Fe2+ 2.81 × 10⁻⁴ Fe(OH)+2 −→hν HOq+Fe2++HO− 3.53 × 10⁻⁴
To evaluate this hypothesis, we decide to consider the iron as totally complexed by the organic matter present in natural cloud waters. As a first general approximation, we consider iron as not reactive in the model. The new simulations show that the majority of the simulated values (75 %) of the hy-droxyl radical formation rates are now underestimated by the model (median of the bias error equal to −40 %) (Fig. 5).
Based on the laboratory irradiation experiments (Sect. 2.6, Fig. 3), new photolysis rates from nitrite, nitrate and hydro-gen peroxide are previously estimated from the hydroxyl rad-ical formation rates (Table 4). For nitrate and H2O2, the
val-ues calculated by the model are lower than the experimental ones; the experimental photolysis rates are higher by a factor
∼1.5 for H2O2and ∼ 2 for nitrate. For nitrite, the
experi-mental photolysis rate is approximately half of the modelled value. These discrepancies should partially explain the un-derestimation of HO q formation by the model. Therefore, we consider the experimental photolysis rates in the model, and a new comparison of modelled HO q formation rates with ex-perimental values is shown in Fig. 5. The median of the bias error is −3 % with the 25th and 75th percentiles at −50 and 60 %, respectively. Table S4 reports the distribution of the relative contributions of H2O2, NO−3 and NO
−
2 photolysis
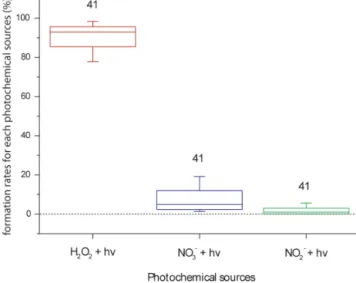
to the modelled RHOf q. While the median values of the
ni-trite and nitrate contributions are calculated by the model as equal to 1 and 5 %, respectively (Fig. 6), the main HO q con-tributor is H2O2photolysis (median value of 93 %, with the
25th and 75th percentiles at 85 and 96 %, respectively). This result suggests that H2O2 is the key compound that drives
the oxidative capacity of our cloud water samples when iron concentrations are relatively low or when iron is suggested to be totally complexed by organic matter.
4 Conclusions
In this study, we compare experimental and modelled HO q formation rates for 41 cloud water samples with contrast-ing chemical compositions dependcontrast-ing on the origin of the air masses. This approach helps to elucidate the complex aqueous photoreactivity of natural cloud water that is ex-pected to drive the oxidative capacity. Experimental data are obtained considering only the HO q formation sources with addition of an excess of the chemical probe leading to the measurements of total generated HO q. The first compari-son with the M2C2 model shows that the model can re-produce the order of magnitude of measured RHOf q (from 1.1 × 10⁻¹¹ to 4.2 × 10⁻¹⁰M s−1 and from 1.1 × 10⁻¹¹ to
Figure 6. Distribution of relative contributions of modelled HOq formations rates for each photochemical source (H2O2, NO−3 and
NO−2 photolysis) for all cloud water samples. Model outputs are obtained from the sensitivity test in which the iron chemistry is not considered, and new photolysis rate constants from experimental measurements are implemented in the model. The number of sam-ples analysed is indicated above each boxplot. The bottom and top lines correspond to the 25th and 75th percentiles, respectively. The full line represents the median values. The ends of the whiskers are the 10th and 90th percentiles.
2.4 × 10⁻¹⁰M s−1 for experimental and modelled values, respectively). Some discrepancies appear for samples con-taining iron concentrations over 0.4 µM in which the model overestimates the contribution of Fe(III)-aqua complexes to the HO q production rate. Ultimately, the aqueous chemical mechanism in the model was modified considering new pho-tolysis rates for H2O2, nitrite and nitrate estimated by
labo-ratory irradiation experiments. As a sensitivity test, iron re-activity was also suppressed in the model to account for the total complexation of iron. The modelled production rates of HO q with the updated mechanism are closer to the experi-mental values. This supports the hypothesis that iron could be strongly complexed by the organic matter in natural cloud water. These complexes could be more stable and less pho-toreactive, leading to less HO q production than that calcu-lated by theoretical models in which only the photochemistry of Fe(III) carboxylate is considered (Weller et al., 2014). In this context, evaluation of the complexation of iron by or-ganic compounds in the cloud aqueous phase and the pho-toreactivity of these complexes should be pursued in future. Their photoreactivity provides significant data to understand the specific role of iron species and, more generally, the oxi-dant capacity of this medium.
The Supplement related to this article is available online at doi:10.5194/acp-15-9191-2015-supplement.
Acknowledgements. The authors acknowledge the financial
sup-port from the Regional Council of Auvergne, from the Observatoire de Physique du Globe de Clermont-Ferrand (OPGC), from the Fédération de Recherche en Environnement through the CPER Environnement founded by Région Auvergne, the French ministry, and FEDER from the European community. This work on the analysis of the cloud water chemical composition is supported by the French Ministry and CNRS-INSU. The authors are very grateful to the Agence Nationale de la Recherche (ANR) for its financial support through the BIOCAP project (ANR-13-BS06-0004) and the CUMULUS project (ANR-10-BLAN-0617).
Edited by: N. L. Ng
References
Albinet, A., Minero, C., and Vione, D.: Photochemical generation of reactive species upon irradiation of rainwater: Negligible pho-toactivity of dissolved organic matter, Sci. Total Environ., 408, 3367–3373, 2010.
Altieri, K. E., Seitzinger, S. P., Carlton, A. G., Turpin, B. J., Klein, G. C., and Marshall, A. G.: Oligomers formed through in-cloud methylglyoxal reactions: chemical composition, properties, and mechanisms investigated by ultra-high resolution FT-ICR mass spectrometry, Atmos. Environ., 42, 1476–1490, 2008.
Anastasio, C. and McGregor, K. G.: Chemistry of fog waters in California’s Central Valley: 1. In situ photoformation of hy-droxyl radical and singlet molecular oxygen, Atmos. Environ., 35, 1079–1089, 2001.
Arakaki, T. and Faust, B. C.: Sources, sinks, and mechanisms of hydroxyl radical (OH) photoproduction and consumption in authentic acidic continental cloud waters from White-face Mountain, New York: The role of the Fe(r) (r = II, III) photochemical cycle, J. Geophys. Res., 103, 3487–3504, doi:10.1029/97jd02795, 1998.
Arakaki, T., Kuroki, Y., Okada, K., Nakama, Y., Ikota, H., Kinjo, M., Higuchi, T., Uehara, M., and Tanahara, A.: Chemical compo-sition and photochemical formation of hydroxyl radicals in aque-ous extracts of aerosol particles collected in Okinawa, Japan, At-mos. Environ., 40, 4764–4774, 2006.
Arakaki, T., Anastasio, C., Kuroki, Y., Nakajima, H., Okada, K., Kotani, Y., Handa, D., Azechi, S., Kimura, T., Tsuhako, A., and Miyagi, Y.: A general scavenging rate constant for reaction of hydroxyl radical with organic carbon in atmospheric waters, Environ. Sci. Technol., 47, 8196–8203, doi:10.1021/es401927b, 2013.
Brantner, B., Fierlinger, H., Puxbaum, H., and Berner, A.: Cloud-water chemistry in the subcooled droplet regime at Mount Sonnblick (3106 m a.s.l., Salzburg, Austria), Water Air Soil Pol-lut., 74, 363–384, 1994.
Carlton, A. G., Turpin, B. J., Altieri, K. E., Seitzinger, S., Reff, A., Lim, H.-J., and Ervens, B.: Atmospheric oxalic acid and SOA production from glyoxal: results of aqueous photooxidation ex-periments, Atmos. Environ., 41, 7588–7602, 2007.
Charbouillot, T., Brigante, M., Mailhot, G., Maddigapu, P. R., Minero, C., and Vione, D.: Performance and selectivity of the terephthalic acid probe for OH as a function of tem-perature, pH and composition of atmospherically relevant
aqueous media, J. Photochem. Photobiol. A, 222, 70–76, doi:10.1016/j.jphotochem.2011.05.003, 2011.
Charbouillot, T., Gorini, S., Voyard, G., Parazols, M., Brigante, M., Deguillaume, L., Delort, A.-M., and Mailhot, G.: Mecha-nism of carboxylic acid photooxidation in atmospheric aqueous phase: Formation, fate and reactivity, Atmos. Environ., 56, 1–8, doi:10.1016/j.atmosenv.2012.03.079, 2012.
Deguillaume, L., Leriche, M., Monod, A., and Chaumerliac, N.: The role of transition metal ions on HOxradicals in clouds: a
numerical evaluation of its impact on multiphase chemistry, At-mos. Chem. Phys., 4, 95–110, doi:10.5194/acp-4-95-2004, 2004. Deguillaume, L., Leriche, M., Desboeufs, K., Mailhot, G., George, C., and Chaumerliac, N.: Transition metals in atmospheric liquid phases: sources, reactivity, and sensitive parameters, Chem. Rev., 105, 3388–3431, doi:10.1021/cr040649c, 2005.
Deguillaume, L., Charbouillot, T., Joly, M., Vaïtilingom, M., Para-zols, M., Marinoni, A., Amato, P., Delort, A.-M., Vinatier, V., Flossmann, A., Chaumerliac, N., Pichon, J. M., Houdier, S., Laj, P., Sellegri, K., Colomb, A., Brigante, M., and Mailhot, G.: Clas-sification of clouds sampled at the puy de Dôme (France) based on 10 yr of monitoring of their physicochemical properties, At-mos. Chem. Phys., 14, 1485–1506, doi:10.5194/acp-14-1485-2014, 2014.
De Haan, D. O., Tolbert, M. A., and Jimenez, J. L.: Atmospheric condensed-phase reactions of glyoxal with methylamine, Geo-phys. Res. Lett., 36, L11819, doi:10.1029/2009gl037441, 2009. Deming, S. N., Michotte, Y., Massart, D. L., Kaufman, L., and
Van-deginste, B. G. M.: Chemometrics: A textbook, 1st Edn., Elsevier Science, doi:10.1016/0169-7439(89)80019-X, 1988.
Dulin, D. and Mill, T.: Development and evaluation of sun-light actinometers, Environ. Sci. Technol., 16, 815–820, doi:10.1021/es00105a017, 1982.
Ervens, B. and Volkamer, R.: Glyoxal processing by aerosol multi-phase chemistry: towards a kinetic modeling framework of sec-ondary organic aerosol formation in aqueous particles, Atmos. Chem. Phys., 10, 8219–8244, doi:10.5194/acp-10-8219-2010, 2010.
Ervens, B., Turpin, B. J., and Weber, R. J.: Secondary or-ganic aerosol formation in cloud droplets and aqueous parti-cles (aqSOA): a review of laboratory, field and model stud-ies, Atmos. Chem. Phys., 11, 11069–11102, doi:10.5194/acp-11-11069-2011, 2011.
Ervens, B., Sorooshian, A., Lim, Y. B., and Turpin, B. J.: Key parameters controlling OH-initiated formation of secondary or-ganic aerosol in the aqueous phase (aqSOA), J. Geophys. Res.-Atmos., 119, 3997–4016, doi:10.1002/2013jd021021, 2014. Faust, B. C. and Allen, J. M.: Aqueous-phase
photochem-ical formation of hydroxyl radphotochem-ical in authentic cloudwa-ters and fogwacloudwa-ters, Environ. Sci. Technol., 27, 1221–1224, doi:10.1021/es00043a024, 1993.
Herckes, P., Valsaraj, K. T., and Collett Jr., J. L.: A review of observations of organic matter in fogs and clouds: Ori-gin, processing and fate, Atmos. Res., 132–133, 434–449, doi:10.1016/j.atmosres.2013.06.005, 2013.
Herrmann, H., Hoffmann, D., Schaefer, T., Bräuer, P., and Tilgner, A.: Tropospheric aqueous-phase free-radical chemistry: radical sources, spectra, reaction kinetics and prediction tools, Chem. Phys. Chem., 11, 3796–3822, doi:10.1002/cphc.201000533, 2010.
Hervo, M.: Etude des propietés optiques et radiatives des aérosols en atmosphère réelle: Impact de l’hydroscopicité, PhD thesis, Blaise Pascal University, Aubiere, 2013.
HYSPLIT (HYbrid Single-particle Lagrangian Integrated Tra-jectory) Model Access via NOAA ARL READY Website, available at: http://ready.arl.noaa.gov/HYSPLIT.php (last access: 23 February 2015), 2012.
Kieber, R. J. and Seaton, P. J.: Determination of subnanomolar con-centrations of nitrite in natural waters, Anal. Chem., 67, 3261– 3264, doi:10.1021/ac00114a024, 1995.
Lê, S., Josse, J., and Husson, F.: FactoMineR: An R Package for Multivariate Analysis, J. Stat. Softw., 25, 1–18, 2008.
Leriche, M., Voisin, D., Chaumerliac, N., Monod, A., and Au-mont, B.: A model for tropospheric multiphase chemistry: appli-cation to one cloudy event during the CIME experiment, Atmos. Environ., 34, 5015–5036, doi:10.1016/S1352-2310(00)00329-0, 2000.
Leriche, M., Chaumerliac, N., and Monod, A.: Coupling quasi-spectral microphysics with multiphase chemistry: a case study of a polluted air mass at the top of the Puy de Dôme mountain (France), Atmos. Environ., 35, 5411–5423, doi:10.1016/S1352-2310(01)00300-4, 2001.
Long, Y., Charbouillot, T., Brigante, M., Mailhot, G., Delort, A.-M., Chaumerliac, N., and Deguillaume, L.: Evaluation of modeled cloud chemistry mechanism against laboratory irradiation exper-iments: The HxOy/iron/carboxylic acid chemical system, Atmos. Environ., 77, 686–695, doi:10.1016/j.atmosenv.2013.05.037, 2013.
Madronich, S. and Flocke, S.: The Role of Solar Radiation in Atmo-spheric Chemistry, in: Environmental Photochemistry, edited by: Boule, P., The Handbook of Environmental Chemistry, Springer Berlin Heidelberg, 1–26, 1999.
Miller, W. L. and Kester, D. R.: Hydrogen peroxide measurement in seawater by (p-hydroxyphenyl)acetic acid dimerization, Anal. Chem., 60, 2711–2715, doi:10.1021/ac00175a014, 2002. Neta, P., Huie, R. E., and Ross, A. B.: Rate constants for reactions
of inorganic radicals in aqueous solution, J. Phys. Chem. Ref. Data, 17, 1027–1284, doi:10.1063/1.555808, 1988.
Okochi, H. and Brimblecombe, P.: Potential trace metal-organic complexation in the atmosphere, Sci. World J., 2, 767–786, doi:10.1100/tsw.2002.132, 2002.
Parazols, M., Marinoni, A., Amato, P., Abida, O., Laj, P., and Mailhot, G.: Speciation and role of iron in cloud droplets at the puy de Dome station, J. Atmos. Chem., 54, 267–281, doi:10.1007/s10874-006-9026-x, 2006.
Perri, M. J., Seitzinger, S., and Turpin, B. J.: Secondary organic aerosol production from aqueous photooxidation of glycolalde-hyde: Laboratory experiments, Atmos. Environ., 43, 1487–1497, doi:10.1016/j.atmosenv.2008.11.037, 2009.
R Core Team: a language and invironment for statistical computing R, foundation for Statistical Computing, available at: http://www. R-project.org/ (last access: 17 January 2015), 2013.
Seinfeld, J. H. and Pandis, S. N.: Atmospheric Chemistry and Physics: From Air Pollution to Climate Change, 2nd Edn., 2006. Stookey, L. L.: Ferrozine – a new spectrophotometric reagent for iron, Anal. Chem., 42, 779–781, doi:10.1021/ac60289a016, 1970.
Tan, Y., Lim, Y. B., Altieri, K. E., Seitzinger, S. P., and Turpin, B. J.: Mechanisms leading to oligomers and SOA through
aque-ous photooxidation: insights from OH radical oxidation of acetic acid and methylglyoxal, Atmos. Chem. Phys., 12, 801–813, doi:10.5194/acp-12-801-2012, 2012.
Tilgner, A. and Herrmann, H.: Radical-driven carbonyl-to-acid conversion and acid degradation in tropospheric aqueous sys-tems studied by CAPRAM, Atmos. Environ., 44, 5415–5422, doi:10.1016/j.atmosenv.2010.07.050, 2010.
Vaitilingom, M., Deguillaume, L., Vinatier, V., Sancelme, M., Am-ato, P., Chaumerliac, N., and Delort, A.-M.: Potential impact of microbial activity on the oxidant capacity and organic car-bon budget in clouds, Proc. Natl. Acad. Sci., 110, 559–564, doi:10.1073/pnas.1205743110, 2013.
Weller, C., Tilgner, A., Brauer, P., and Herrmann, H.: Modeling the impact of iron-carboxylate photochemistry on radical budget and carboxylate degradation in cloud droplets and particles, Environ. Sci. Technol., 48, 5652–5659, doi:10.1021/es4056643, 2014.
Yu, X.-Y. and Barker, J. R.: Hydrogen peroxide photolysis in acidic aqueous solutions containing chloride ions. II. Quantum yield of HO(aq) radicals, J. Phys. Chem. A, 107, 1325–1332, doi:10.1021/jp026666s, 2003.
Zafiriou, O. C. and Bonneau, R.: Wavelength-dependent quantum yield of OH radical formation from photolysis of nitrite ions in water, Photochem. Photobiol., 45, 723–727, doi:10.1111/j.1751-1097.1987.tb07873.x, 1987.
Zellner, R., Exner, M., and Herrmann, H.: Absolute OH quantum yields in the laser photolysis of nitrate, nitrite and dissolved H2O2at 308 and 351 nm in the temperature range 278–353 K,