HAL Id: insu-00587331
https://hal-insu.archives-ouvertes.fr/insu-00587331
Submitted on 10 May 2011
HAL is a multi-disciplinary open access archive for the deposit and dissemination of sci-entific research documents, whether they are pub-lished or not. The documents may come from teaching and research institutions in France or abroad, or from public or private research centers.
L’archive ouverte pluridisciplinaire HAL, est destinée au dépôt et à la diffusion de documents scientifiques de niveau recherche, publiés ou non, émanant des établissements d’enseignement et de recherche français ou étrangers, des laboratoires publics ou privés.
The role of compaction contrasts in sediments in
décollement initiation in an accretionary prism
Hugues Raimbourg, Kohtaro Ujiie, Achim Kopf, Toshio Hisamitsu, Yozo
Hamano
To cite this version:
Hugues Raimbourg, Kohtaro Ujiie, Achim Kopf, Toshio Hisamitsu, Yozo Hamano. The role of com-paction contrasts in sediments in décollement initiation in an accretionary prism. Marine Geology, Elsevier, 2011, 282 (3-4), pp.188-200. �10.1016/j.margeo.2011.02.011�. �insu-00587331�
1
The role of compaction contrasts in sediments in décollement initiation in
an accretionary prism
Hugues Raimbourga-b, Kohtaro Ujiiea, Achim Kopfc, Toshio Hisamitsud, Yozo Hamanoa,
Saneatsu Saitoa, Masataka Kinoshitaa
(a) JAMSTEC, Yokosuka, Japan
(b) Institut des Sciences de la Terre d’Orleans, University of Orléans, France
(c) MARUM, Bremen, Germany
(d) Kochi Core Center, Japan
Corresponding author: [email protected]
Abstract
To understand how décollements develop into the pristine sedimentary succession
entering subduction zones, we have performed mechanical tests on samples from the
sediment column entering the Nankai accretionary prism, Japan (ODP site 1173). Both
poroelastic compliance and plastic shrinkage upon application of a large effective
pressure sharply decrease with depth in a -thick domain in the upper section of
2
location of the décollement near the toe of the prism. These property contrasts provide a
potential explanation for the outward migration of the décollement into the incoming
sediments.
When approaching the deformation front, a given material particle is affected by an
increase in stress, which has a component of vertical loading due to the deposition of
overburden trench sediment, but also a component of lateral compression transmitted
from the accretionary wedge. Depending on its initial mechanical state, the amount of
lateral shortening in the incoming Nankai sediment column varies with depth and
causes horizontal velocity gradients that concentrate into the mechanical transition zone
(upper section of the Lower Shikoku Basin at appx. 450-550m depth) into which the
décollement eventually propagates. Future work has to assess the role of this plastic
deformation relative to other governing factors such as friction coefficient and excess
pore pressure, both at Nankai and along other active margins.
1. Introduction
Convergent margins can be either non-accreting, where all the incoming sediment
sequence is underthrust by subduction, or accreting, where part of these sediments are
incorporated into a growing accretionary prism (Uyeda and Kanamori, 1979; Von
3
accreted to the overriding plate is controlled by the position of the décollement, which is
therefore a major factor in prism growth, dynamics and global mass balances.
The décollement can often be seismically imaged as a high amplitude, reverse polarity
reflector (e.g. Moore et al. (1990) in Nankai, Shipley et al. (1990) in Costa Rica),
interpreted as the interface separating high porosity/fluid pressure underthrust sediments
from low porosity/fluid pressure accretionary prism material (Tobin and Saffer, 2009).
The coexistence of these two independent hydrologic systems implies that the interface,
or décollement, has larger permeability than the material above and below (Henry and
Le Pichon, 1991). The décollement is therefore often considered as an highly fractured
horizon, where the pore pressure is relatively high compared to surrounding material, as
a result of channelized flow of deep fluid (Saffer and Bekins, 1998). In turn, high pore
fluid pressure reduces the effective stress and promotes further fracturing or fault
initiation.
Although there is an enhancement in deformation and fluid flow in a mature
décollement, it is unclear how this discontinuity in physical properties of the
seaward-migrating frontal thrust extends into material outboard of the deep-sea trench.
In Barbados prism, the presence of a high-porosity, radiolarian-rich horizon (Moore et
4
lithological heterogeneity is not relevant in Nankai area (Fig. 1), where both Upper
Shikoku Basin (U.S.B.) and Lower Shikoku Basin (L.S.B.) units consist dominantly of
hemipelagic silty mudstones (Shipboard Scientific Party, 2001b).
As detailed in section 2, alternative candidates for the controlling properties are
permeability (2.1), shear strength (2.2) or yield strength (2.3). The two latter factors
refer to the material mechanical state, which is usually assessed by geotechnical tests,
i.e. rather by the stress necessary to trigger plastic deformation/slip than by the amount
of strain for a given stress increment. In this manuscript we propose to reverse this point
of view and to consider the finite strain affecting incoming material upon arrival into the
prism. The amount of compaction versus depth constitutes a new possible controlling
factor for décollement localization when considering the horizontal compression in the
vicinity of prism toe. For the new model, we first consider the state of stress in the
vicinity of the prism toe and describe, based on the analogy with cutting tool processes,
how horizontal compression affects incoming material seaward of décollement tip and
deformation front (section 3). We then assess the material response to horizontal
compression using mechanical testing under isotropic loading conditions up to
maximum of twice in-situ effective stress (section 4). We finally define a model
5
mechanism of décollement localization based on the differential horizontal compaction
of a sedimentary column approaching the Nankai prism (section 5).
2. Décollement localization: state of the art
2.1. Permeability/pore fluid pressure hypothesis
As the décollement is the surface where the shear localizes, its propagation into
incoming material is favoured in horizons where the shear strength is reduced. The
presence of high pore fluid pressure, which lower the shear strength, is believed to
account for the formation of the protodécollement seaward of the Nankai prism toe (Le
Pichon and Henry, 1992; Le Pichon et al., 1993). In their model, the rapid loading of
low-permability hemipelagites by the deposition of high-permeability turbidites near the
trench results in the development of a minimum in effective pressure below the
turbidite-hemipelagite transition, which attracts décollement propagation (See also
Discussion 6.3).
2.2. Shear strength hypothesis
In Barbados, the décollement corresponds to a relatively broad zone with high smectite
content, while its lower limit coincide with a minimum in smectite (Deng and
Underwood, 2001). Smectite is characterized by a low friction coefficient, as evidenced
6 transect) (Brown et al., 2003).
For western Nankai (Muroto transect), Brown et al. (2003) linked smectite content and
low intrinsic friction with the location of the outward-growing frontal thrust. There is
indeed a maximum in smectite content in Site 1173 in the upper section of L.S.B., at
depths compatible with the décollement (Steurer and Underwood, 2005). Additional
ring shear experiments on samples from the two sites of this study (1173, 1174) reveal a
wide range of friction coefficients from µ = 0.32 - 0.47 in U.S.B. facies to values as low
as 0.14 – 0.16 in the décollement zone at site 1174 and 0.16 in the projected
décollement depth at site 1173 (Kopf, unpublished data). The extension along strike of
this minimum is nevertheless not completely clear, as in site 808 of the Muroto transect,
the smectite content (Underwood et al., 1993) as well as experimentally-determined
friction profiles (Kopf and Brown, 2003) are relatively smooth across the décollement.
2.3. Cementation hypothesis
Using site 1173 sediments as pristine material not yet affected by prism influence,
one-dimensional consolidation tests revealed large variations in mechanical strength,
possibly related to the presence of cement (Morgan and Ask, 2004; Spinelli et al., 2007).
Within the shallower U.S.B, consolidation tests and XRD analysis illuminated the
7
inferred from the unusually large porosity of these sediments for their depth. Due to the
increase in temperature with depth, this silica cement disappears at larger depths and
samples from the uppermost section of the L.S.B. (391 and 425 mbsf), were shown to
behave like uncemented sediment (Spinelli et al., 2007). Uniaxial (vertical)
consolidation tests carried out on L.S.B. sediments in Site 1173 (476 mbsf), as well as in
sites 1174 (Morgan and Ask, 2004) and 808 (Karig, 1993) below the décollement,
yielded peak strengths much larger than vertical effective stress for hydrostatic
conditions, interpreted as evidences of the presence of rock-strengthening cement of
authigenic illite (Morgan and Ask, 2004; Sunderland and Morgan, 2004). This
authigenic clay cement appears to disappear downward within the lower section of the
L.S.B. (Ujiie et al., 2003; Sunderland and Morgan, 2004).
The strength profile of incoming sediment appears therefore as complex, as there are
two cementing agents, silica and clays, distributed over distinct depth ranges, possibly
not overlapping. Furthermore, S.E.M. analysis show evidence of clay cementation
within material of the décollement in site 1174, which is absent in the deeper,
underthrust sediments (Ujiie et al., 2003). The connection between décollement and
material strength is therefore not straightforward.
8
While the mechanical state of incoming material is a priori a major control on
décollement localization, one important process is the large porosity reduction affecting
the sediment as it approaches the trench (e.g. Fig. 1) (Shipboard Scientific Party, 2001a;
Screaton et al., 2002). The principal factor governing compaction is the progressive
increase in overburden stress resulting from the deposition of a thick turbiditic trench
wedge sequence. In addition, compressive horizontal stress active in convergent
margins is likely to contribute also to compaction, although its amplitude and spatial
distribution is poorly constrained. The lateral shortening has nevertheless large
consequences on horizontal velocity and differential displacement of particles if
heterogeneously distributed with depth in the incoming sediment column. Horizontal
compaction constitutes therefore a potential new factor in décollement localization,
whose validation requires to assess how (i) horizontal compression affects incoming
material (section 3), (ii) the shortening resulting from this compression varies with
depth (section 4) and (iii) velocity variations relate with horizontal compaction
amplitude (section 5).
3 Change in stress conditions near the prism toe
3.1. Force balance near prism toe
9
into the accretionary prism or underthrust beneath it (Fig. 2A). The décollement, i.e. the
frontier between accreted and underthrust domains, is a mechanically weak zone,
possibly because of high pore fluid pressure, so transmitted shear stresses are of low
magnitude and the stress field is decoupled between accretionary prism and underthrust
sequence (Westbrook et al., 1982; Taira et al., 1992; Le Pichon et al., 1993). The state of
stress within the accretionary prism is at first order described by the critical Coulomb
wedge theory (Davis et al., 1983; Dahlen, 1984, 1990). The wealth of low angle thrust
faults visible on the seismic cross-sections of the outer wedge of Nankai accretionary
prism (Moore et al., 2001; Moore et al., 2009) supports the idea that the prism is, in the
long-term, in a critical compressional state with the maximum compressive stress close
to horizontal (volume “In” of Fig. 2A; see also results of mechanical testing of samples
from ODP site 808 (Feeser et al., 1993; Moran et al., 1993)), which sharply contrasts
with the underthrust sequence, either free of contraction (Taira et al., 1992) or even
stretched in the horizontal direction (Byrne and Fisher, 1990).
If the classical critical wedge solution accounts for many of prism features, it is not
clear how lateral compression in the toe extends seaward (volume “Close” of Fig. 2A).
In the vicinity of the prism toe, the principal forces at stake are: (1) Dragging by the
10
on the décollement and (3) compressive forces in the wedge. Because shear stresses on
the weak décollement are of limited magnitude, the forces in the wedge (in position “In”,
Fig. 2) must be transmitted seaward to be balanced by basal shear stresses, which
implies that horizontal compression affects material seaward of the décollement tip. The
second crucial point is that such compression must affect the whole sequence of
incoming material (volume “Close”) and not only its upper section, as it is balanced by
shear stresses on its base. Lateral compression vanishes far from the prism tip at the
same pace as basal shear stresses diminish, until a far-off state (volume “Far”,
corresponding to site 1173), where the influence of the prism is negligible.
3. 2 Analogy with metal-cutting process
Some insights on the stress state can be gained by regarding the analogy of classical
metal cutting (Drucker, 1949) (Fig. 2C). Although timescale and lengthscale, as well as
the mechanisms of deformation are completely different from granular materials
entering a subduction zone, the geometry and the kinematic boundary conditions of the
metal cutting process and frontal accretion are very similar. When considering the
tool+chip=accretionary prism and metal layer=incoming sediment sequence being
analogues, we find: (1) The velocity with respect to the tool is fixed as constant in the
11
constant convergence velocity all over the sediment sequence far off the trench and all
over its base, as a result of dragging by underlying lithosphere. (2) Upon arrival on the
tip (seaward end of the décollement) of the cutting tool (accretionary prism), an
incoming column is split into two sections. While the velocity of the lower section is
hardly affected, the upper section’s velocity changes sharply as the material is
incorporated into the chip (prism). In the sketches (Fig. 2B/C), the only difference lies
in the fact that chip and tools remain distinct entities in metal cutting but are a single
volume in prism accretion process.
From this analogy, a few essential insights on accretionary prism stress can be drawn
from the abundant literature about material processing:
- Shearing and splitting of incoming material column results in the formation of a zone
of high strain and stress, typically extending ahead of the tool (i.e. seaward of the
décollement tip) over a distance of the order of a few times the tool edge radius. When
taken into the subduction zone setting, this distance is equivalent to the thickness of
accreted layer (Drucker, 1949; Kim et al., 1999; Liu and Melkote, 2007; Wu and Liu,
2009).
- The stress field within this region includes, in addition to shear parallel to the
12
magnitude similar to the order of the shear stresses (cf. the amplitude of the quantity
labelled as “overpressures” in Woon et al. (2008)).
4. Mechanical experiments on Nankai Trough samples
4.1 Experimental Procedure
We sampled 12 small cylinders (diameter x height = 38 x 11~17 mm) in Hole 1173A,
orientated so that the cylinder base is vertical (i.e. parallel to the core axis) and the
height is horizontal (Fig. 1D). These samples span an interval of 250-660 mbsf (meters
below sea-floor), which includes the lower part of U.S.B. and most of the underlying
L.S.B. and comprises the stratigraphic equivalent of the décollement (390-420 mbsf)
(Fig. 1).
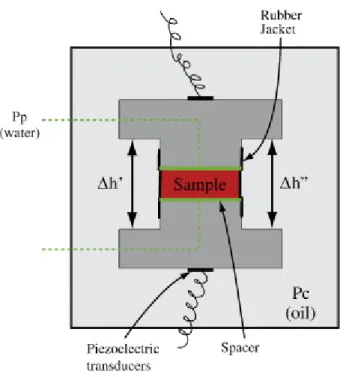
The mechanical tests consist of isotropic loading of the sample under controlled
conditions of confining ( : oil) and pore pressure ( : de-ionized water) and
monitoring the evolution of height using linear variable displacement transducers
(LVDTs) (precision~1 micron) (Fig. 3).
The isotropic loading conditions chosen for our tests do not enable us to derive all
mechanical (poroelastic and plastic) properties of the tested sample, hence we cannot
estimate precisely the sample response to different, more complex loading conditions,
13
other hand, our experimental results can be considered as coarse indicators of the
magnitude of the deformation to be expected, whatever the precise loading conditions,
and we use them in this sense in the following. This assumption is further supported by
our experimental measurements (Raimbourg et al., in press), showing that, at least in the
poroelastic field, the mechanical anisotropy is very limited, so that measurements done
in an arbitrary direction are to some extent representative of sample response in every
direction.
As we do not monitor the volume of fluid flow in and out of the sample, we cannot
precisely estimate pore volume changes and, hence, true compressibility. Nevertheless,
for isotropic behavior, total volume/porosity variations can be assessed from uniaxial
measurements of height variations as .
Each experiment can be divided into a first, poroelastic phase, where the effective
pressure ( ) applied was kept low, and a second phase, where large effective
pressures were applied to assess the plastic response of the material (Fig. 4).
For the sake of comparison between samples, every experiment lasted for two days,
including the re-saturation phase. Tests were conducted at room temperature using
de-ionized water. Changes in pore water composition may induce swelling of smectitic
14
only significantly large if smectite is the major constituent of the rock. In Hole 1173A,
smectite relative abundance is generally below 30% except in the upper section of L.S.B.
where it is in the range 30-40% (Brown et al., 2003). We thus consider this effect
negligible. Furthermore, for swelling of clay to be significant, a large portion of in-situ
pore water must be exchanged with external, de-ionized fluid – something we consider
unlikely given the experimental setup: In our experiments where poroelastic
deformation involves only a very small amount of porosity variations and fluid
exchange, the largest fluid flow corresponds to sample plastic shrinkage, but in this case
only expulsion of in-situ fluids rather than fluid exchange occurs (see also (Morgan and
Ask, 2004). On this basis, we suppose that the use of de-ionized water does not induce
large perturbations in the mechanical behavior of the tested samples, except maybe for
desorption at some clay mineral surfaces at the sample edges.
Thorough coupling between the entire sample face and the tubing is ensured by
channels cut within the holder end-caps and the insertion, on both sides of the sample,
of a perforated steel disk and a flexible steel mesh (noted as “spacers” on Fig. 3). Two
piezometers on both sides of sample holder monitor throughout the test the evolution in
P-wave velocity of the sample (Fig. 3).
15
In order to fully re-hydrate the samples in the oil-filled high-pressure vessel prior to
testing, the confining pressure and pore fluid pressure are conjointly increased
up to and effective pressure . The applied
effective pressure is set to a value well below the in-situ effective pressure,
estimated as
,
where is the vertical stress of the overlying rock column (calculated using the bulk
density profiles from shipboard moisture and density measurements (Shipboard
Scientific Party, 2001b)), z its thickness and the fluid density. The samples are
exposed to these conditions for 12h prior to the mechanical test.
This re-saturation procedure is similar to that of Morgan and Ask (2004), although there
is a large time lapse (~10 years) between core recovery and laboratory testing in our
case. Doubts concerning sample saturation and potential evaporation of pore water can
be almost excluded in spite of their long stay in the IODP core repository as:
- Height variations during this saturation phase are limited to a few tens of microns, i.e.
a few per mil
- Porosity measured using oven-drying to assess water content (Blum, 1997) and grain
16
same as on-board measurements carried out after coring (Fig. 5).
4.1.2 1st experimental stage
After the re-saturation phase, several steps of varying were applied within a range
below . We repeated these operations for several values of confining pressure,
both to check the reversibility of the deformation and to assess a potential effect of the
confining pressure on poroelastic moduli. In the range from 0.5 to 1.5 - 3 MPa
(the upper limit of the range is dictated by in situ conditions for shallow samples),
sample height variations are almost linear, enabling us to derive the poroelastic
compliance:
4.1.3 2nd experimental stage
During the second phase, was fixed to in situ conditions ( ) and we applied
cycles of first increasing in amplitude to a value , then of
decreasing amplitude back to initial conditions. This procedure of changing
through variations differs from typical experiments (e.g. Morgan and Ask (2004))
where changes in are controlled through variations for a fixed . Its
justification lies in the concomitant estimation of P-wave velocity using the piezometers
17 (in press).
In some of the samples, plastic yield, characterized by a large and rapid shrinkage, was
observed for in the range . To estimate this potential plastic
deformation, we assessed the extent of the height reduction as for each sample,
where is the initial height and is the height variation between and
.
The time necessary to reach “perfect” equilibrium is much larger than in a typical
experimental time-scale, because of slow plastic deformation. Upon application of a
large , we observed nevertheless a strong decrease in deformation rates, so that,
over a few hours, one can consider that some equilibrium, at least with respect to initial,
rapid deformation mechanisms, is reached. Similarly, for an initially large applied
while the volume of fluid in the external circuit connected to the sample is kept constant,
decreases exponentially towards an asymptotic value. We considered equilibrium
was reached based on such asymptotic evolution, resulting in durations of at most
a few hours for the largest increments in the slowest experiments. Based on the
above, we defined the duration of each test to be a full two days.
Upon application of large , we also checked that the time necessary for equilibrium
18
sample. The latter was estimated by a test similar to the pulse-decay method to
determine permeability (Brace et al., 1968), i.e. by applying a differential fluid pressure
between upper and lower sample surface and measuring its decrease with time.
4.2 Results and interpretation of the tests
4.2.1 Experimental mechanical state profile
The poroelastic compliance , determined in the horizontal direction, displays a
non-linear trend of decrease with depth (Fig. 6B). A large decrease in compliance by a
factor of >2, is concentrated in the depth interval 450~550 mbsf, while both 250~450
mbsf and 550~650 mbsf intervals have roughly constant properties.
The sample shrinkage for a large applied, i.e. , shows a similar trend of rapid
decrease in the 450~550 mbsf interval despite some scatter (Fig. 6A): While samples
from depths shallower than 450 mbsf are shortened by 2% to almost 10%, the
shortening of samples deeper than 550 mbsf is less than 1.5%. This shortening includes
both poroelastic and plastic deformation as is increased from to
. However, due to the overall relatively low values of both compliance and
, most of the sample shortening corresponds to plastic deformation. In
summary, both poroelastic compliance and plastic deformation amplitude expresses a
19 “transitional domain” (see below, and Fig. 6).
4.2.2 Comparison with previous results
Karig (1993) and Morgan and Ask (2004) carefully carried out uniaxial consolidation
tests of core samples from prism toe below the décollement (samples from ODP cores
808-74, 808-85, 1174-78), off the deformation front below the turbiditic deposits
(DSDP cores 582-68, 582-73) and further off the prism (ODP core 1173-51). These tests
enabled to measure and plot the evolution of differential stress with
increase in mean effective stress (Morgan and Ask, 2004), highlighting the
complexity of the compaction, i.e. post-yield behavior, decomposed into several distinct
phases.
All these experiments concern relatively deep samples with respect to the domains we
consider here, as the shallowest, core 1173-51 at 476 mbsf, is already in what we
defined as the transitional domain of depth, where plastic shrinkage gets limited (Fig. 6).
Some of their samples were recovered far off the prism or below the décollement at the
toe, so that the material has been variously affected by prism-related deformation and
consolidation and is difficult to be compared to our data. For four samples one can
nevertheless apply an approach similar to ours and consider the amount of strain for an
20
for hydrostatic pressure; see section 4.2.1 above). As a result, U.S.B. samples (DSDP
cores 582-68, 582-73) with high porosity (~50%) are affected by vertical strains of
6-8% (Karig, 1993), while samples with a lower porosity, 1173-51 (~45%) and 1174-78
(~38%) by 4.7% and 4%, respectively (Morgan and Ask, 2004). The contrast in vertical
strain is probably even larger, as actual (hence ) for sample 1174-78
is much lower than the value calculated assuming hydrostatic pore pressure (Morgan
and Ask, 2004), so that the strain (4%) is probably overestimated.
In summary, similarly to our study, the amplitude of the plastic shrinkage strongly
decreases with depth and is, in deeper and less porous samples, half of its value in
shallower and more porous material.
5. Model of differential horizontal compaction
5.1 Velocity reduction from horizontal shortening
Both the schematic stress analysis of the prism toe area as well as the analogy with
metal-cutting processes show that the sedimentary column approaching the prism toe is
affected by lateral compression ahead of the décollement tip. The lateral shortening
enhances porosity reduction in the sedimentary column, which is already affected by the
rapid loading of trench turbidites. The effect of lateral compression is nevertheless not
21
velocity (See Appendix). For mass conservation sake, in steady state regime, as the flux
of solid material through a given surface must be constant laterally (i.e. in the direction
parallel to convergence), horizontally shortened (hence denser) material at the trench
has to move more slowly than in its initial position far off the trench. In other words, the
change in porosity associated with lateral shortening has to be compensated by a
velocity decrease.
The porosity decrease associated with compaction as the sedimentary column
approaches prism toe can be defined as
where is the porosity decrease corresponding to the (virtual) case where only
vertical loading occurs and the additional decrease in porosity resulting from
lateral compression.
The progressive reduction in velocity associated with incipient lateral compression for
material moving from a position off the prism ( , , ) to the trench
( , , ) can be estimated as
Where is the (negative) porosity reduction from lateral shortening, assessed at
22
5.2 Application of differential compaction to Nankai Trough
Despite the fact that the loading conditions in experimental and actual settings are much
different, we postulate that the large differences obtained by isotropic loading are
somehow significant of some “general” material behavior and are to some extent
indicative of the material response to any loading path, in particular the complex,
3-dimensional loading active near prism toe.
Based on our results, the sedimentary column entering the trench can be modeled as
composed of a shallow domain (above 450 mbsf), easily compactable, a deep domain
(below 550 mbsf) more resistant to compaction, and a relatively thin transitional domain
around 450~550 mbsf, in the upper section of the L.S.B. unit, where mechanical
properties change sharply.
This bi-layered material, when affected by vertical loading and horizontal compression,
undergoes some lateral shortening scaled by its resistance to compaction: in the
lower layer can be neglected with respect to the upper one. Accordingly, velocity is
constant in the lower layer while it is reduced in the upper layer, resulting in differential
displacement and strain distribution in the transition layer (Fig. 7).
In order to estimate this strain, we make the following assumptions:
23
( )
- The porosity decrease associated with lateral shortening in the upper layer
over a distance of 1 km seaward of the décollement tip ( is of the order of
1%, for an initial porosity ( ).
Then the shear deformation accommodated by the transition layer can be estimated as
(See Appendix)
This large value shows that even a small component of “horizontal compaction”, of the
order of 1%, may result in large shear strain within the transition zone in the upper
section of L.S.B., which in turn may attract the décollement propagation.
6. Discussion
6.1 Rock properties: cementation and critical porosity
6.1.1 Cement distribution
The complex pattern of cement distribution in Nankai incoming sediments, as
highlighted by geomechanical testing and other data (see 2.3, Spinelli et al. (2007) and
Raimbourg et al. (in press)), appears at first sight at variance with our results: the porous
material of U.S.B. where we observed the most intense compaction, show evidences for
24
exceeding we applied, which may have triggered breakage of silica
intergranular bonds and, subsequently, favored porosity collapse. Broken bonds and
relative low porosity have already been described in décollement rocks of Site 1174
(Ujiie et al., 2003). In that respect, rather than showing variations in strength, the plastic
deformation we measured for high may indicate that the sample initial condition
is far from normal consolidation state, most likely owing to the presence of cement that
maintains the porosity at anomalously large value. Based on this hypothesis, shallow
samples with large plastic shrinkage have large initial porosities that result from the
presence of cement. The heterogeneous distribution of cement may also explain the
large scatter in experimental compaction of these shallow, deformable samples. On the
contrary, samples recovered at larger depth, where cement is absent or rare, have a
normal porosity with respect to their depth, so a much lower capacity to shrink once
large effective stresses are applied.
This apparent paradox, where our shallow deformable domain is actually the one where
cement is present, is compatible with the anisotropy of magnetic susceptibility (AMS)
profile (Fig. 8) that was related to bulk strain (Borradaile and Henry, 1997). The vertical
compaction fabrics, expressed by the magnetic parameter F (Hrouda, 1982), low
25
then starts increasing again. This reversal in compaction trends around 400 mbsf, may
somehow correspond to the lower limit of the cement zone within the L.S.B., with
deeper sediments much more affected by vertical compaction than shallower, more
resistant ones. Accordingly, the capacity to shrink in response to horizontal compression
when approaching the prism toe is much reduced in the uncemented, lower section of
the L.S.B. compared to shallower sediments. This inevitably results in the differential
strain patterns observed in the mechanical transition zone at the top of the L.S.B. – a
fact that very likely contributes to décollement localization in the incoming sequence.
6.1.2 Critical porosity and time-scale of compaction
The porosity corresponding to the transition in mechanical behavior spans a porosity
range of 42-46% (See Fig. 1 and Raimbourg et al. (in press)), i.e. close to the “critical
porosity” where physical properties strongly vary and close-packing of grains prevails
(Nur et al., 1998), although this value of the critical porosity is defined for sandstones
and may not apply directly to the clay-rich material considered here.
The compaction processes for a porosity exceeding close-packing structure require only
the displacement and rearrangement of individual grains, i.e. very little time. In contrast,
compaction and further porosity decrease for a material already closely packed is not
26
precipitation. The time-scale of compaction is, therefore, much longer for chemical
processes to operate and the porosity loss for a given stress increment is much lower.
6.2 Distribution of compaction near prism toe
6.2.1 Evidences for horizontal compaction
On the basis of the correlation of logging-while-drilling (LWD) signals between
adjacent sites, Hunze and Wonik (2007) were able to assess the porosity variations, for a
given sedimentary sequence, from a reference site far from the trench to positions
within the prism. As a result, the depth-averaged amplitude of the total (vertical and
lateral) porosity decrease is in the range of 10% in the Barbados prism (comparison of
Sites 1044 and 1045) and 25% and 15% for two distinct depth sections in Nankai prism
(comparison of Sites 1173 and 808). Moreover, discriminating within this reduction the
relative contribution of vertical/horizontal compaction, (Hunze and Wonik, 2007)’s
results show that porosity loss due to lateral shortening is as large as 5-10%, which
represents a major contribution to total loss and is found in agreement with Saito and
Goldberg (2001).
Similarly, quantitative rock fabric analysis, either based on anisotropy of magnetic
susceptibility (AMS) analysis (Owens, 1993; Housen et al., 1996; Ujiie et al., 2003),
27
of P-wave velocity analysis (Brückmann et al., 1993), attest the presence of a
component of lateral shortening parallel to the convergence velocity within the
accretionary prism (i.e. in the material located above the décollement).
Although such results demonstrate the presence of horizontal shortening within the
prism, they do not provide information as to how the lateral compressional field may
extend seaward of the décollement tip. Few studies have attempted to examine this
question. Along the Ashizuri transect in Nankai, seaward of the deformation front, there
is a large porosity decrease (from ~60% to ~50%) within the U.S.B. sediments between
ODP hole 1177 (Shipboard Scientific Party, 2001a), ~15 km from deformation front and
DSDP site 582 (Bray and Karig, 1986), ~3 km from deformation front. Although the
larger part of this porosity decrease is probably the result of loading by overlying trench
turbidites (~100m-thick in 1177 and ~550m-thick in site 582), there may be a
contribution of tectonic shortening, but it has not yet been estimated. Unfortunately, in
their kinematic model, Morgan et al. (1994) also assume that in the domain seaward of
the deformation front only vertical compaction operates, preventing the quantification
of horizontal shortening there.
The other example where two adjacent sites were drilled outboard of the décollement tip
28
(Shipboard Scientific Party, 1998) show that site 1048, located ~3 km from the frontal
thrust (assumed to roughly correspond to décollement tip), has not yet been affected by
compaction with respect to the reference site 1044, located ~6.5 km from tip. From this
single example, it should be assumed that the horizontal compression related to the
accretionary prism does not extend as far as 3 km from décollement tip, which is in
agreement with the comparison with metal-cutting processes, where the width of the
high-strain zone is shown to be of the order of a few times the off-scraped thickness,
roughly 200m in Barbados case.
The above examples do not provide unambiguous evidence with regard the assumption
of the model. An additional difficulty is the amplitude of the porosity variations: The
heterogeneous depth distribution, starting 1 km seaward of the décollement tip, of only
1% porosity decrease as a result of lateral shortening triggers large differential
displacement and strain (See 4.2.2). However, this small amount of compaction is well
within the range of scatter of porosity profiles determined either through core sample
measurement or from P-wave velocity-porosity relationships and is therefore hardly
detectable.
6.2.2 Origin of horizontal compaction in the wedge
29
to the strong contrast in fabrics between material from the prism and the underthrust
section (e.g. Westbrook et al. (1982), Taira et al. (1992) and Le Pichon et al. (1993)):
Such fabrics are usually interpreted in terms of stress decoupling by the décollement, i.e.
horizontal strain is only recorded above the décollement because only in this domain the
horizontal tectonic compression is large. In this interpretation the strain patterns are the
consequence of the décollement. As an alternative explanation we propose that these
strain patterns may be partially inherited from the compaction of the sediments off the
trench, where the décollement is not yet developed. In such a scenario, the décollement
is the consequence rather than the cause of such differences in deformation patterns
with depth.
6.3 Pore pressure variations related to differential compaction and décollement
localization
Excess pore pressure, i.e. pore pressure in excess of fluid hydrostatic pressure, is the
driving force for compaction. Its amplitude is the result of the competition between
sedimentary/tectonic loading (source of ) and outflow of fluid (sink of ), so that
large excess pore pressure are favored by rapid loading and hindered flow of fluids (Shi
and Wang, 1985, 1988). Pore pressure build-up in response to an increase in loading is
30
defined as easily deformable is unable to sustain a large increase in without
compacting, so that an increase in the bulk load (i.e. in ) is instantaneously entirely
converted into an increase in . On the other hand, the deep, hardly deformable
material of the lower section of L.S.B. can stand a large increase in without
compacting, which implies that an increase in the bulk load is only partially transmitted
to the pore fluid, resulting in a much smaller instantaneous pore pressure build-up. This
contrasted compaction behavior has presumably a large impact on the evolution of the
pore pressure profile during progressive loading, either vertical or horizontal. We
consider in the following only vertical, sedimentary loading, but the conclusions would
be qualitatively the same when taking horizontal compaction also into account.
Le Pichon and Henry (1992) and Le Pichon et al. (1993) interpreted the décollement
localization within incoming hemipelagic sediments as a consequence of their rapid
loading by more permeable trench turbidites, which results in the development of a high
pore pressure zone/low effective stress zone in a horizon below the limit between trench
and hemipelagic material.
Permeability profile is an essential feature of such model, as turbidites are required to be
much more permeable than underlying hemipelagites, so that the pore pressure gradient
31
sedimentary load (i.e. ) is transmitted to the pore fluid and converted into
increase. The simplest approach, adopted by Le Pichon and Henry (1992) and Le
Pichon et al. (1993) is to consider that the timescale of compaction is much smaller than
timescales of (i) loading by sedimentation and (ii) fluid flow. In such a case, adjustment
of the material porosity to the variations in the load as well as in the pore fluid
pressure is instantaneous. Throughout its evolution towards the accretionary prism,
all the points of the sedimentary column plot on a compaction curve
depending on the material. When assuming a rapid loading with respect to fluid outflow,
the increase in affecting a given rock volume in the hemipelagite section is first
entirely transmitted to the pore fluid (constant and , increase in ) before
outflow of fluid enables to increase and and to decrease (Fig. 9B).
Building from their model on, let’s assume that the behavior of the low-permeability
hemipelagite section with respect to compaction is not homogeneous and that it is
constituted of an easily deformable upper section and a hardly deformable lower
section.
When this column is submitted to a load increase resulting from rapid turbidite
deposition, within its shallower portion all the load increase is transmitted to the pore
32
succession, a significant fraction of is supported by the framework without being
transmitted to the pore fluid (Fig. 9C).
As a result, within the low permeability hemipelagite, the compaction behavior governs
the distribution of the pore pressure and the depth portion where is lowest is
localized where the material is more easily compactable. This effect is even amplified
within the U.S.B. part of the deformable section, as the anomalously large original
porosities observed at site 1173 ((Shipboard Scientific Party, 2001a), Fig. 1C), probably
related to silica cementation (Spinelli et al., 2007), provide a long-lasting source of pore
fluid pressure before equilibration on the compaction curve once the cement got
destructed by loading.
In conclusion, the difference in mechanical response to loading within the incoming
sediment sequence has large consequences on the evolution in the profile as
turbidites rapidly deposit on top of it. In the framework of the model developed by Le
Pichon and Henry (1992) and Le Pichon et al. (1993), we propose that the minimum in
, developed in response to rapid overlying load increase, should lie within the
highly porous and compactable U.S.B. material, therefore slightly offset with respect to
actual décollement localization, which would imply that this phenomenon is not the
33
7. Conclusion
As Nankai accretionary prism is not a perfect wedge, closed by an acute angle, the
horizontal compressive stresses active there must to some extent be transmitted seaward
of the decollement tip and affect diffusely the whole incoming sedimentary sequence.
As a consequence, the compaction affecting this material incorporates a part of
horizontal shortening.
The response of samples collected at different depths within the incoming sequence to
experimentally-imposed compaction show very contrasted behavior between shallower,
easily compactable material and deeper, hardly compactable material. As a result, the
amplitude of the horizontal shortening, as the sequence approaches the prism toe and is
increasingly affected by horizontal compression, varies with depth. This differential
horizontal shortening leads to differential displacement, hence strain, which localizes in
the transitionary domain between easily and hardly deformable domains. This strain
concentration eventually guides the propagation of the decollement within incoming
material.
8. Appendix
34
affected. To assess the effect of vertical and horizontal compaction, let’s consider
alternatively the simple cases where only vertical load or horizontal tectonic stresses
increase.
Vertical load increase:
The vertical load increase triggers some porosity decrease that depends on the
mechanical state of the material. As the material is laterally confined, for the sake of
solid mass conservation, the porosity decrease is completely compensated by a decrease
in thickness of the column without effect on the horizontal velocity (Fig. 10A).
Horizontal stress increase
Horizontal stress increase in the convergence direction also triggers a porosity decrease
that depends on the mechanical state of the material (Fig. 10B). On the contrary to
vertical compaction, the material is not confined in the vertical direction, so that
horizontal compression is likely to induce some vertical expansion. Nevertheless, its
extent is unknown, so as a minimum hypothesis we consider that the height of the
sedimentary column is constant (vertical thickening of the column would result in an
even larger velocity decrease than calculated hereafter).
35 where is the horizontal velocity.
For the sake of simplicity, we suppose that the porosity decrease (negative) is
linear over a length ( ):
If the variations in porosity are very low ( ), then mass conservation
equations simplifies as:
yielding, for the horizontal velocity decrease:
which can be approximated by
for .
In summary, the decrease in porosity associated with horizontal compaction is
accommodated by a decrease in horizontal velocity.
Double-layer horizontal compaction
Now consider a sedimentary column constituted of two superposed layers, the upper
one subjected to large plastic shrinkage when compressed, the lower one hardly
36
to horizontal compression, the upper material shrinks but the lower one does not,
resulting in difference in horizontal velocity: while the lower one keeps the same
velocity over , the upper material is progressively slowed down according to
the law above.
The time necessary for the material to reach is
, i.e.
for the lower layer and
for the upper layer, which simplifies to
for .
During the time , a material point in the upper layer has moved a distance ,
while a material point in the lower layer has moved a distance . As a
consequence, the differential displacement , null for x=0, increases up to, for
This differential displacement, accommodated within the transition layer of width ,
38
Figures
Figure 1: (A) Map (Moore et al., 2005) and (B) interpreted cross-section of the Nankai
trough off Muroto Cape (Morgan and Ask, 2004) showing locations of Sites 1173 and
1174. (C) Porosity profiles of Sites 1173 and 1174 (Shipboard Scientific Party, 2001a).
In Site 1174 is also shown the outline of the porosity profile of Site 1173, scaled to fit
the thickness variations between the 2 sites. (D) Distribution of samples from site 1173
used in mechanical tests, all cut as cylinders with horizontal revolution axis. U.S.B.
39
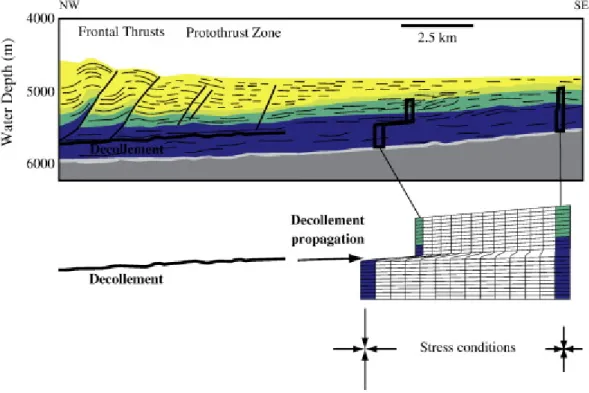
Figure 2: (A) Sketch of the forces applied on the mechanical discontinuities of the
margin, as well as on a sedimentary column located either “Far”, “Close” to the tip of or
“In” the wedge. Splitting and shearing of incoming material implies the application of
lateral compressive forces balanced by the basal shear related to dragging by the crust.
(B) Top: Same model, but with kinematic boundary conditions (velocity defined with
respect to the wedge): constant basal velocity imposed by plate convergence, null
velocity on the backstop of the wedge over the décollement. Bottom: Analogy with the
geometry and the kinematic boundary conditions (velocity defined with respect to the
tool) of metal cutting process. Splitting and shearing of the metal plate by the tool
results in the development of zone of high strain/deviatoric stress/pressure around and
41
Figure 3: Experimental device of isotropic loading, where we measure variations in
sample height following and evolution. Piezometers
placed on both holders’ ends enable simultaneous measurement of P-wave velocity (See
Raimbourg et al. (in press).
Figure 4: Typical evolutions of the sample height during one experiment, from to
: In the first, poroelastic phase of the test, we applied several cycles of
(=increasing then decreasing amplitude of ), while keeping to values smaller
than (vertical thick bar). During this phase, variations of sample height are
reversible and enable to derive the poroelastic compliance (=slope of height
variations). In the second phase of the test, upon application of a large , samples
42
for increase from to . is very limited in deep
sample (1173-55X) (A), while shallow sample (1173-28X) is affected by a rapid, very
large and irreversible shrinkage (B) when reaches the range .
Please note that the height decrease (“Inside resetup”) near for sample 1173A-55X
is for most an artifact due to holder and filter setup and does not correspond to sample
43
Figure 5: Comparison of on-board porosity determined just after sample recovery and
porosity measured on our experimental material (see text for methods).
Figure 6: Mechanical properties of sediments from site 1173 determined in the
horizontal direction: (A) Normalized height reduction for increase from
to and (B) poroelastic compliance , both expressing the
sharp variations in mechanical state of the samples in the 450-550 mbsf depth interval
(“mechanical transition zone” in dark gray), located within the upper section of the
L.S.B.. The multiple points for a given depth/sample in (A) correspond to measurements
of the compliance repeated for each cycle of increase/decrease within the
45
Figure 7: Model of décollement initiation based on the compaction of pristine,
far-from-the-trench sediments: The difference in the intensity of compaction by
horizontal tectonic compression between shallow, deformable sediments and deep,
resistant ones, results in differential displacement and deformation that localize in the
mechanical transition zone (upper section of L.S.B.) and control the décollement
46
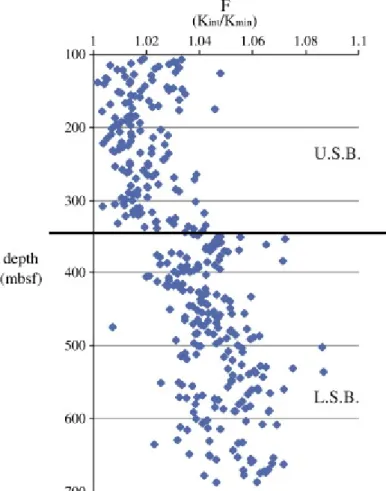
Figure 8: Evolution with depth of magnetic foliation parameter F in Site 1173. F,
defined as ( , 1=no magnetic foliation (Hrouda, 1982)), reflects the
bulk strain generated by compaction from vertical loading.
Figure 9: Evolution of (hence ) within a sedimentary column of hemipelagic
material (low permeability, dark gray) submitted to rapid loading by a layer of trench
turbidites (high permeability, light gray), inspired from the model by Le Pichon and
Henry (1992) and Le Pichon et al. (1993). (A) Initial pore pressure distribution in the
hemipelagic column (thick gray line), comprised between hydrostatic (dashed black
47
compaction in the hemipelagites (simplification of Le Pichon and Henry (1992) and Le
Pichon et al. (1993)’s model): Upon rapid loading by the turbidites at (thick black
curve), the low permeability of the hemipelagites strongly inhibits water outflow and
adjustement of the porosity. All the load is transmitted by the solid skeleton to the pore
fluid throughout the column, so that pore fluid pressure profile is simply translated
(grey arrows) and a minimum in effective pressure develops at the
turbidite-hemipelagite transition. Upward flow of water from the hemipelagites enables
progressive equilibration (e.g. , thick “dash-point” curve) and results in the
downward movement in the minimum in effective pressure at depth. (C) Combination
of the simple model B and our experimental results about material response to loading.
In this case, the material compaction is not instantaneous (as supposed in B): Upon
rapid loading by the turbidites at , although, like in (B), porosity adjustement is
strongly inhibited by the low permeability, the transmission of the load from the
framework to the pore fluid is variable with depth. In the shallow and easily deformable
domain of the hemipelagite section, all the load increase is instantaneously transmitted
to the fluid (long grey arrows) and the pore fluid pressure increases strongly, while in
the deep, hardly deformable domain the solid framework is able to sustain some
48
smaller transmission of the load increase to the pore fluid (small grey arrows) and lower
increase in pore fluid pressure. The time-evolution of the pore pressure profile is in this
case the result of the competition between water flow (controlled by permeability
profile) and time-dependent compaction (controlled by the mechanical properties of the
solid framework), but for slow compaction in the deeper domain of the hemipelagites,
the lowest effective pressure is localized in the more deformable upper domain.
Figure 10:
Evolution of sedimentary material (horizontal velocity, porosity, height) as it passes
through a zone of compaction, considered as fixed with respect to material moving from
right to left. (A) In the case of vertical compaction, the porosity decrease is
accommodated by a reduction in the height of the material column. (B) In the case of
horizontal compaction, the decrease in porosity is accompanied, for the sake of solid
49
horizontal compaction, the sediment column height is increased, then the velocity
decrease is even larger than in the “minimum” hypothesis chosen here of a column of
constant height. (C) If the incoming sediment column is composed of a compactable
upper layer, non-compactable lower layer and a transition domain, then the horizontal
compaction results in differences in horizontal velocity between lower and upper layers,
which lead to shear strain in the transition layer. For (a), (b) and (c), the yellow
rectangle corresponds to the initial shape of the column as it enters the zone of
51
References
Behrmann, J.H., Kopf, A., 1993. Textures and microfabrics in fine-grained muds and mudstones from site 808, Nankai accretionary prism, in: Hill, I.A., Taira, A., Firth, J.V. (Eds.), Proc. ODP, Sci. Results, Vol. 131, p. doi:10.2973/odp.proc.sr.2131.2106.1993.
Blum, P., 1997. Physical properties handbook: a guide to the shipboard measurement of physical properties of deep-sea cores. ODP Tech. Note 26,
http://www-odp.tamu.edu/publications/tnotes/tn26/INDEX.HTM.
Borradaile, G.J., Henry, B., 1997. Tectonic applications of magnetic susceptibility and its anisotropy. Earth Sci. Rev. 42, 49-93.
Brückmann, W., Moran, K., Taylor, E., 1993. Acoustic anisotropy and microfabric development in accreted sediments from the Nankai Trough, in: Hill, I.A., Taira, A., Firth, J.V. (Eds.), Proc. ODP, Sci. Results, Vol. 131, pp. 221-233. doi:210.2973/odp.proc.sr.2131.2121.1993.
Brace, W.F., Walsh, J.B., Frangos, W.T., 1968. Permeability of granite under high pressure. J. Geophys. Res. 80, 2225-2236.
Bray, C.J., Karig, D.E., 1986. Physical properties of sediments from the Nankai Trough, Deep Sea Drilling Project, Leg 87A, Sites 582 and 583, in: Kagami, H., Karig, D.E., Coulbourn, W.T., et al (Eds.), Init. Repts, DSDP, 87, p. doi:10.2973/dsdp.proc.2987.2128.1986.
Brown, K.M., Kopf, A., Underwood, M.B., Weinberger, J.L., 2003. Compositional and fluid pressure controls on the state of stress on the Nankai subduction thrust: A weak plate boundary. Earth Planet. Sci. lett. 214.
Byrne, T., Fisher, D., 1990. Evidence for a weak and overpressured decollement beneath sediment-dominated accretionary prisms. J. Geoph. Res. 95, 9081-9097.
Dahlen, F.A., 1984. Noncohesive Critical Coulomb Wedges - An Exact Solution. J. Geoph. Res. 89, 125-133.
Dahlen, F.A., 1990. Critical taper model of fold-and-thrust belts and accretionary wedges. Annual review of earth and planetary sciences 18, 55-99.
Davis, D., Suppe, J., Dahlen, F.A., 1983. Mechanics of fold-and-thrust belts and accretionary wedges. Journal of Geophysical Research 88, 1153-1172.
Deng, X., Underwood, M., 2001. Abundance of smectite and the location of a plate-boundary fault, Barbados accretionary prism. GSA Bull. 113, 495-507.
Drucker, D.C., 1949. An analysis of the mechanics of metal cutting. J. App. Phys. 20, 1013-1021.
52
behavior of sediment from the frontal part of the Nankai accretionary prism, in: Hill, I.A., Taira, A., Firth, J.V. (Eds.), Proc. ODP, Sci. Results, 131, pp. 261-273. doi:210.2973/odp.proc.sr.2131.2123.1993.
Henry, P., Le Pichon, X., 1991. Fluid flow along a decollement layer: A model applied to the 16°N section of the Barbados accretionary wedge. J. Geophys. Res. 96, 6507-6528.
Housen, B.A., Tobin, H.J., Labaume, P., Leitch, E.C., Maltman, A.J., ODP Leg 156 Shipboard Science Party, 1996. Strain decoupling across the decollement of the Barbados accretionary prism. Geology 24, 127-130.
Hrouda, F., 1982. Magnetic anisotropy of rocks and its application in geology and geophysics. Geophys. Surv. 5, 37-82.
Hunze, S., Wonik, T., 2007. Compaction in the Nankai and Barbados accretionary prisms: New insights from logging-while-drilling data. G-cubed 8, doi:10.1029/2006GC001277. Karig, D.E., 1993. Reconsolidation tests and sonic velocity measurements of clay-rich sediments from the Nankai Trough, in: Hill, I.A., Taira, A., Firth, J.V. (Eds.), Proc. ODP, Sci. Results, Vol. 131, pp. 247-260. doi:210.2973/odp.proc.sr.2131.2127.2199.
Kim, K.W., Lee, W.Y., Sin, H.C., 1999. A finite-element analysis of machining with the tool edge considered. J. Mater. Process. Tech. 86, 45-55.
Kopf, A., Brown, K.M., 2003. Friction experiments on saturated sediments and their implications for the stress state of the Nankai and Barbados subduction thrusts. Mar. Geol. 202, 193-210.
Le Pichon, X., Henry, P., 1992. Erosion and accretion along subduction zones: a model of evolution. Proc. Kon. Ned. Akad. v. Wetensch 95, 297-310.
Le Pichon, X., Henry, P., Lallemant, S., 1993. Accretion and erosion in subduction zones: The role of fluids. Annu. Rev. Earth Pl. Sc. 21, 307-331.
Liu, K., Melkote, S.N., 2007. Finite element analysis of the influence of tool edge radius on size effect in orthogonal micro-cutting process. Int. J. Mech. Sci. 49, 650-660.
Moore, G., Park, J.O., Bangs, N.L., Gulick, S.P., Tobin, H.J., Nakamura, Y., Saito, S., Tsuji, T., Yoro, T., Tanaka, H., Uraki, S., Kido, Y., Sanada, Y., Kuramoto, S., Taira, A., 2009. Structural and seismic stratigraphic framework of the NanTroSEIZE Stage 1 transect, in: Kinoshita, M., Tobin, H., Ashi, J., Kimura, G., Lallemant, S., Screaton, E.J., Curewitz, D., Masago, H., Moe, K.T., Expedition 314/315/316 Scientists (Eds.), Proc. IODP, 314/315/316. Integrated Ocean Drilling Program Management International, Inc., Washington, DC, pp. 1-46. doi:10.2204/iodp.proc.314315316.314315102.314312009.
Moore, G.F., Shipley, T.H., Stoffa, P.L., Karig, D.E., Taira, A., Kuramoto, S., Tokuyama, H., Suyehiro, K., 1990. Structure of the Nankai Trough accretionary zone from multichannel seismic-reflection data. J. Geophys. Res. 95, 8753-8765.
53
Moore, G.F., Taira, A., Klaus, A., Becker, L., Boeckel, B., Cragg, B.A., Dean, A., Fergusson, C.L., Henry, P., Hirano, S., Hisamitsu, T., Hunze, S., Kastner, M., Maltman, A.J., Morgan, J.K., Murakami, Y., Saffer, D.M., Sanchez-Gomez, M., Screaton, E.J., Smith, D.C., Spivack, A.J., Steurer, J., Tobin, H.J., Ujiie, K., Underwood, M.B., Wilson, M., 2001. New insights into deformation and fluid flow processes in the Nankai Trough accretionary prism: Results of Ocean Drilling Program Leg 190. Geochemistry Geophysics Geosystems 2, 2001GC000166. Moore, G.F., Mikada, H., Moore, J.C., Becker, K., Taira, A., 2005. Legs 190 and 196 synthesis: Deformation and fluid flow processes in the Nankai Trough accretionary prism, in: Mikada, H., Moore, G.F., Taira, A., Becker, K., Moore, J.C., Klaus, A. (Eds.), Proc. ODP, Sci. Results, 190/196, pp. 1-26. doi:10.2973/odp.proc.sr.190196.190201.192005.
Moore, J.C., Klaus, A., Bangs, N.L., Bekins, B.A., Bucker, C.J., Bruckman, W., Erickson, S.N., Hansen, O., Horton, T., Ireland, P., Olson Major, C., Moore, G.F., Peacock, S., Saito, S., Screaton, E.J., Shimeld, J.W., Henry Stauffer, P., Taymaz, T., Teas, P.A., Tokunaga, T., 1998. Consolidation patterns during initiation and evolution of a plate-boundary decollement zone: Northern Barbados accretionary prism. Geology 26, 811-814.
Moore, J.C., 2000. Synthesis of Results: Logging While Drilling, Northern Barbados Accretionary Prism, in: Moore, J.C., Klaus, A., Bangs, N.L., Bekins, B.A., Bruckman, W., Bucker, C.J., Erickson, S.N., Hansen, O. (Eds.), Proc. ODP,Sci. Results, 171A, p. doi:10.2973/odp.proc.sr.2171A.2101.2000.
Moran, K., Bruckmann, W., Feezer, V., Campanella, R.G., 1993. In-situ stress conditions at Nankai Trough, site 808, in: Hill, I.A., Taira, A., Firth, J.V. (Eds.), Proc. ODP, Sci. Results, Vol. 131, pp. 283-291. doi:210.2973/odp.proc.sr.2131.2129.1993.
Morgan, J.K., Karig, D.E., Maniatty, A., 1994. The estimation of diffuse strains in the toe of the western Nankai accretionary prism: A kinematic solution. J. Geophys. Res. 99, 7019-7032.
Morgan, J.K., Karig, D.E., 1995. Decollement processes at the Nankai accretionary margin, southeast Japan: Propagation, deformation and dewatering. J. Geophys. Res. 100, 15,221-215,231.
Morgan, J.K., Ask, M.V.S., 2004. Consolidation state and strength of underthrust sediments and evolution of the décollement at the Nankai accretionary margin: Results of uniaxial reconsolidation experiments. J. Geophys. Res. 109, doi:10.1029/2002JB002335.
Nur, A., Mavko, G., Dvorkin, J., Galmudi, D., 1998. Critical porosity: A key to relating physical properties to porosity in rocks. The Leading Edge, 357-362.
Owens, W.H., 1993. Magnetic fabric studies of samples from hole 808C, Nankai Trough, in: Hill, I.A., Taira, A., Firth, J.V. (Eds.), Proc. ODP, Sci. Results, Vol. 131, p. doi:10.2973/odp.proc.sr.2131.2130.1993.
54
Raimbourg, H., Hamano, Y., Saito, S., Kinoshita, M., Kopf, A., in press. Acoustic and mechanical properties of Nankai accretionary prism core samples. G-cubed, doi:10.1029/2010GC003169.
Saffer, D.M., Bekins, B.A., 1998. Episodic fluid flow in the Nankai accretionary complex: Timescale, geochemistry, flow rates and fluid budget. J. Geophys. Res. 103, 30,351-330,370. Saito, S., Goldberg, D., 2001. Compaction and dewatering processes of the oceanic sediments in the Costa Rica and Barbados subduction zones: estimates from in situ physical property measurements. Earth Planet. Sci. lett. 191, 283-293.
Screaton, E.J., Saffer, D.M., Henry, P., Hunze, S., Leg 190 Shipboard Party, 2002. Porosity loss within the underthrust sediments of the Nankai accretionary complex: Implications for overpressures. Geology 30, 19-22.
Shi, Y., Wang, C.-Y., 1985. High pore pressure generation in sediments in front of the Barbados ridge complex. Geoph. Res. Lett. 12, 773-776.
Shi, Y., Wang, C.-Y., 1988. Generation of high pore pressures in accretionary prisms: Inferences from the Barbados subduction complex. J. Geophys. Res. 93, 8893-8910.
Shipboard Scientific Party, 1998. Site 1048, in: Moore, J.C., Klaus, A., Bangs, N.L., Bekins, B.A., Bruckman, W., Bucker, C.J., Erickson, S.N., Hansen, O. (Eds.), Proc. ODP, Init. Repts., 171A, p. doi:10.2973/odp.proc.ir.2171a.2107.1998.
Shipboard Scientific Party, 2001a. Leg 190 Summary, in: Moore, G.F., Taira, A., Klaus, A., Becker, L., Boeckel, B., Cragg, B.A., Dean, A., Fergusson, C.L., Henry, P., Hirano, S., Hisamitsu, T., Hunze, S., Kastner, M., Maltman, A.J., Morgan, J.K., Murakami, Y., Saffer, D.M., Sanchez-Gomez, M., Screaton, E.J., Smith, D.C., Spivack, A.J., Steurer, J., Tobin, H.J., Ujiie, K., Underwood, M.B., Wilson, M. (Eds.), Proc. ODP, Init. Repts, College Station, TX (Ocean Drilling Program), p. doi:10.2973/odp.proc.ir.2190.2101.2001.
Shipboard Scientific Party, 2001b. Site 1173, in: Moore, G.F., Taira, A., Klaus, A., Becker, L., Boeckel, B., Cragg, B.A., Dean, A., Fergusson, C.L., Henry, P., Hirano, S., Hisamitsu, T., Hunze, S., Kastner, M., Maltman, A.J., Morgan, J.K., Murakami, Y., Saffer, D.M., Sanchez-Gomez, M., Screaton, E.J., Smith, D.C., Spivack, A.J., Steurer, J., Tobin, H.J., Ujiie, K., Underwood, M.B., Wilson, M. (Eds.), Proc. ODP, Init. Repts, College Station, TX (Ocean Drilling Program), pp. 1-147. doi:110.2973/odp.proc.ir.2190.2104.2001.
Shipley, T.H., Stoffa, P.L., Dean, D.F., 1990. Underthrust sediments, fluid migration paths, and mud volcanoes associated with the accretionary wedge off Costa Rica: Middle America Trench. J. Geophys. Res. 95, 8743-8752.
Spinelli, G., Mozley, P.S., Tobin, H.J., Underwood, M.B., Hoffman, N.W., Bellew, G.M., 2007. Diagenesis, sediment strength, and pore collapse in sediment approaching the Nankai Trough subduction zone. GSA Bull. 119, 377-390.
55
Steurer, J.F., Underwood, M., 2005. Clay mineralogy of mudstones from the Nankai Trough references sites 1173 and 1177 and frontal accretionary prism site 1174, in: Mikada, H., Moore, G.F., Taira, A., Becker, K., Moore, J.C., Klaus, A. (Eds.), Proc. ODP, Sci. Results, 190/196, pp. 1-37. doi:10.2973/odp.proc.sr.190196.190211.192003.
Sunderland, E.B., Morgan, J.K., 2004. Microstructural variations in sediments from the toe of the Nankai accretionary prism: Results of scanning electron microscope analysis, in: Mikada, H., Moore, G.F., Taira, A., Becker, K., Moore, J.C., Klaus, A. (Eds.), Proc. Ocean Drill. Program, Sci. Results [online], 190/196, pp. 1-27. doi:10.2973/odp.proc.sr.190196.190212.192004.
Taira, A., Hill, I., Firth, j., Berner, U., Briickmann, W., Byrne, T., Chabernaud, T., Fisher, A., Foucher, j.-p., Gamo, T., Gieskes, j., Hyndman, R., Karig, D., Kastner, M., Kato, Y., Lallemant, S., Lu, R., Maltman, A., Moore, G., Moran, K., Olaffson, G., Owens, W., Pickering, K., Siena, F., Taylor, E., Underwood, M., Wilkinson, C., Yamano, M., Zhang, J., 1992. Sediment deformation and hydrogeology of the Nankai Trough accretionary prism: Synthesis of shipboard results of ODP Leg 131. Earth Planet. Sci. Lett. 109, 431-450.
Tobin, H.J., Saffer, D.M., 2009. Elevated fluid pressure and extreme mechanical weakness of a plate boundary thrust, Nankai Trough subduction zone. Geology 37, 679-682.
Ujiie, K., Hisamitsu, T., Taira, A., 2003. Deformation and fluid pressure variation during initiation and evolution of the plate boundary decollement zone in the Nankai accretionary prism. J. Geophys. Res. 108, 2398.
Underwood, M.B., Pickering, K., Gieskes, J.M., Kastner, M., Orr, K., 1993. Sediment geochemistry, clay mineralogy, and diagenesis: A synthesis of data from Leg 131, Nankai Trough, in: Hill, I.A., Taira, A., Firth, J.V. (Eds.), Proc. ODP, Sci. Results, 131, p. doi:10.2973/odp.proc.sr.2131.2137.1993.
Uyeda, S., Kanamori, H., 1979. Backarc opening and the mode of subduction. J. Geophys. Res. 84, 1049-1106.
Von Huene, R., Scholl, D.W., 1991. Observations at convergent margins concerning sediment subduction, subduction erosion, and the growth of continental crust. Rev. Geophys. 29, 279-316.
Westbrook, G.K., Smith, M.J., Peacock, J.H., Poulter, M.J., 1982. Extensive underthrusting of undeformed sediment beneath the accretionary complex of the Lesser Antilles subduction zone. Nature 300, 625-628.
Woon, K.S., Rahman, M., Fang, F.Z., Neo, K.S., Liu, K., 2008. Investigations of tool edge radius effect in micromachining: A FEM simulation approach. J. Mater. Process. Tech. 195, 204-211.