HAL Id: inserm-00550264
https://www.hal.inserm.fr/inserm-00550264
Submitted on 13 Dec 2011HAL is a multi-disciplinary open access archive for the deposit and dissemination of sci-entific research documents, whether they are pub-lished or not. The documents may come from teaching and research institutions in France or
L’archive ouverte pluridisciplinaire HAL, est destinée au dépôt et à la diffusion de documents scientifiques de niveau recherche, publiés ou non, émanant des établissements d’enseignement et de recherche français ou étrangers, des laboratoires
The relation between type of farming and prevalence of
Parkinson’s disease among agricultural workers in five
French districts.
Frédéric Moisan, Johan Spinosi, Jean-Luc Dupupet, Laurène Delabre,
Jean-Louis Mazurie, Marcel Goldberg, Ellen Imbernon, Christophe Tzourio,
Alexis Elbaz
To cite this version:
Frédéric Moisan, Johan Spinosi, Jean-Luc Dupupet, Laurène Delabre, Jean-Louis Mazurie, et al.. The relation between type of farming and prevalence of Parkinson’s disease among agricultural workers in five French districts.: Parkinson’s disease and type of farming. Movement Disorders, Wiley, 2011, 26 (2), pp.271-9. �10.1002/mds.23370�. �inserm-00550264�
The relation between type of farming and prevalence of Parkinson’s disease among agricultural workers in five French districts.
Frédéric Moisan1,2, Johan Spinosi3,4, Jean-Luc Dupupet5, Laurène Delabre3, Jean-Louis Mazurie6, Marcel Goldberg3,7, 8, 9, Ellen Imbernon3, Christophe Tzourio1,2, Alexis Elbaz1,2,3.
1
INSERM, U708, Neuroépidemiologie, F-75013, Paris, France
2
UPMC Univ Paris 06, UMR_S708, Neuroépidemiologie, F-75005, Paris, France
3
Département santé travail, Institut de veille sanitaire, F-94415, Saint-Maurice, France
4
Umrestte (Unité mixte de recherche épidémiologique et de surveillance transport, travail, environnement) InVS/UCBL/Inrets, F-69373, Lyon, France
5
Caisse centrale de la Mutualité sociale agricole, F-93547, Bagnolet, France
6
Caisse départementale de la Gironde, Mutualité sociale agricole, F-33052, Bordeaux, France
7
INSERM, U1018, Epidemiology of occupational and social determinants of health, Centre for research in Epidemiology and Population Health, F-94807, Villejuif, France
8
University of Versailles St-Quentin, UMRS 1018, France
9
Univ Paris 11, F- 94807, Villejuif, France
CORRESPONDING AUTHOR: Frédéric Moisan, INSERM Unité 708 – Neuroépidémiologie,
Hôpital de la Salpêtrière, 47 Bvd de l'Hôpital, 75651 Paris Cedex 13, France. Phone : +33 (0) 1 42 16 25 47 - Fax : +33 (0) 1 42 16 25 41. Email : frederic.moisan@upmc.fr
WORD COUNT ABSTACT: 247 words. WORD COUNT TEXT: 3012 words RUNNING HEAD: Parkinson’s disease and type of farming.
KEYWORDS: Agriculture; Environmental Exposure; Parkinson Disease; Prevalence; Pesticides.
FINANCIAL SUPPORT: This work was supported by Institut national de la santé et de la
recherche médicale (Inserm), Agence nationale de la recherche, Agence française de sécurité sanitaire de l’environnement et du travail (Afsset) and France Parkinson. Frédéric Moisan was
supported by a scholarship from the Ministère de l’enseignement supérieur et de la recherche.
ABSTRACT
Background: Retrospective assessment of pesticide exposure is complex. However, patterns of
pesticide use strongly depend on farming type, which is easier to assess than pesticide exposure.
Our aim was to estimate Parkinson’s disease (PD) prevalence in five French districts in 2007
among affiliates of Mutualité Sociale Agricole (MSA), and to investigate the relation between PD
prevalence and farming type.
Methods: We identified PD cases from administrative files as persons who used levodopa and/or
benefited from free health care for PD. Densities of 16 farming types were defined at the canton of
residence level (1988 French agricultural census). We used logistic regression to study the relation
between PD prevalence and density of farming types, and a semi-Bayes approach to deal with
correlated exposures.
Results: We identified 1 659 PD cases, yielding an age- and sex-standardized PD prevalence of
3.01/1 000. Prevalence increased with age and was higher in men than women. We found a higher
PD prevalence among affiliates living in cantons characterized by a higher density of farms
specialized in fruits and permanent crops (multivariable semi-Bayes model: OR4+5 vs 1+2+3
quintiles = 1.21, 95% CI = 1.08-1.36; test for trend, P = 0.035).
Conclusion: In France, farms specialized in fruits and permanent crops rank first in terms of
insecticide use per hectare. Our findings are consistent with studies reporting an association
between PD and insecticide use, and show that workers in farms specialized in fruits or permanent
crops may be an occupational group at higher PD risk.
The cause of Parkinson’s disease (PD) is multifactorial and involves environmental risk factors
and susceptibility genes.1 Among environmental exposures, an epidemiological association
between pesticides and PD has been shown;2,3 these findings are supported by laboratory data.4
Retrospective assessment of pesticide exposure is complex: workers use a large variety of
products; pesticides have considerably evolved through time; several factors determine exposure
level (e.g., equipment, spraying frequency/duration, quantity). These complexities may lead to
measurement error, multiple correlated exposures, and missing values. Because pesticide use
patterns (including products and characteristics outlined above) strongly depend on farming type,
which is considerably easier to assess than pesticide use, we hypothesized that investigating the
relation between PD and farming type may help characterize the type of exposure associated with
PD and identify occupational groups at higher risk.
Our objective was to investigate the relation between PD prevalence and farming type in
five French districts in 2007 among affiliates to the health insurance for farmers and workers in
SUBJECTS AND METHODS Participants
MSA is responsible for the reimbursement of health-related expenses to agricultural populations
(farmers; farm workers: workers in silos, agricultural cooperatives, seed shops; professional
gardeners; employees of MSA, an insurance company, and a bank). Workers (and spouses, if
unemployed) benefit from health insurance while employed and retired. In 2007, MSA covered ~4
millions of persons. This study is based on MSA affiliates ≥18 years who lived in 2007 in five
French districts (départements; Charente-Maritime, Côte-d’Or, Gironde, Haute-Vienne, Mayenne)
that cover 6.5% of France. There are marked differences in farming types, both between and
within districts. The study protocol was approved by the Ethical Committee of the
Pitié-Salpêtrière University hospital.
Cases
Cases were identified through two computerized MSA databases: (i) drug claims: in France,
antiparkinsonian drugs (APD) cannot be obtained without medical prescription; their delivery is
registered in a drug delivery database; we identified MSA affiliates who bought any
levodopa-containing medication in 2007; (ii) PD belongs to a list of 30 diseases for which free health care
(FHC) is granted, usually after a neurologist confirmed the diagnosis; MSA affiliates with
FHC/PD were identified.
The prevalence date was June 1, 2007. PD cases were subjects with: (i) at least one
levodopa delivery in the six months preceding and following the prevalence date, and/or (ii)
FHC/PD at the prevalence date.
We performed a validation study of our case definition among all persons who bought any
FHC for dementia or psychiatric disease (Supplemental Figure 1). All subjects with at least one
delivery of levodopa, entacapone, tolcapone, ropinirole, pramipexole, apomorphine,
bromocriptine, or selegiline, or with FHC/PD (using any APD) were invited to be examined by a
neurologist (unless they used small doses of dopamine agonists for restless legs syndrome (RLS);
treatment was discontinued after ≤1 month; there was a clear history of drug-induced
parkinsonism) in order to confirm PD using standardized criteria.5 Those using APDs rarely
prescribed for PD (piribedil, amantadine, anticholinergics) were first contacted by mail; they were
asked why APDs were prescribed and those who answered PD/parkinsonism or did not know were
invited to be examined by a neurologist if they verified the inclusion criteria. We excluded women
≤50 years who used small doses of bromocriptine for a short time (lactation suppression) and
subjects who received anticholinergics with neuroleptics (drug-induced parkinsonism). Of 1,114
persons identified in 2007 for whom we could obtain clinical information, 320 had PD: 290 used
levodopa and/or had FHC/PD (sensitivity=91%); of 794 persons without PD: 122 used levodopa
and/or had FHC/PD (specificity=85%); the c-statistic was 0.88.
To compute prevalence, we obtained a list of all affiliates ≥18 years alive at the prevalence
date in the participating districts.
Characteristics of the participants
Participants’ characteristics were defined at the individual and canton (small administrative
subdivision of districts) level. There were 208 cantons (median [interquartile range] area=17 009
[12 811] km²; median number of affiliates=904 [1 094]).
The following information was available at the individual level: birth year, sex,
district/canton of residence. For participants with FHC/PD, age at request was available; it was
Farming type was defined at the canton level based on the 1988 French agricultural
census.6 Our analyses are based on the density of 16 farming types, a common definition used by
European administrations;7 it is defined based on the relative importance of the different farm’s
activities and reflects the ratio of each activity's standard gross margin (SGM) to the farm's total
SGM; SGM characterizes economic importance, and is defined as the output value from one
hectare or animal minus the input costs required to produce it. Farming type density was computed
by dividing the number of farms with a given type by cantons’ area.
There is evidence of socioeconomic variations in PD prevalence.8 We used the cantons’
2007 median household income as a surrogate for socioeconomic level.9
Statistical methods
We computed prevalence, overall and by sex and 10-year groups. We estimated sex- and
age-standardized prevalence (direct standardization) based on the age/sex distribution of the 2007
French population.9 To assess the impact of diagnostic misclassification, we computed a corrected
number of PD cases by applying sensitivity/specificity estimates of our case definition to all
persons using any APD at the prevalence date;10 we divided this number by the number of MSA
affiliates (corrected prevalence).
We used logistic regression to model prevalence.11 The relation between prevalence and
farming type was first investigated using a mixed-effects model with a random intercept per
canton. After adjustment for age, sex, district, and income, the residual intraclass correlation was
not different from zero (P=0.49); we therefore used fixed-effects models.
We first built separate models for each farming type, while adjusting for covariates (age,
sex, district, income); we adjusted for district in order to take into account differences in
categorized into quintiles of their distribution among unaffected subjects; for dose-effect analyses,
we used the median of categories.12 Age was included as linear and quadratic terms. We
categorized median household income into quintiles; because there was no difference in PD
prevalence in the four highest quintiles, we used a dichotomous coding, comparing cantons in the
lowest quintile to those in the remaining four. Interactions were tested by including multiplicative
terms.
We then built a multivariable model that included all farming types and other covariates
(age, sex, district, income). Exposure variables were dichotomized by grouping the two highest
quintiles versus the three lowest; trend tests were also performed. Because, this approach may be
problematic for multiple correlated exposures, alternative approaches have been suggested.13
Semi-Bayes models offer several advantages over traditional methods, including dealing with
correlated exposures and multiple testing.13-15 We implemented an intercept-only model in which
all farming types are considered exchangeable, with a second-level residual variance of 0.345.16
We conducted sex-stratified analyses because PD prevalence is higher in men than women,
and men are occupationally exposed to pesticides more frequently than women. Because
neuroleptics can induce parkinsonism, we excluded patients who regularly used typical
neuroleptics (≥3 deliveries between 1/1/2007-6/1/2007) in sensitivity analyses. Cigarette smoking
is inversely associated with PD.17 Because we did not have smoking data, we used external
adjustment using data from a case-control study nested within our validation study.18
Analyses were performed using SAS 9.1 (SAS Institute, Inc., Cary, North Carolina) and
Stata 10 (StataCorp LP, College Station, Texas). Significance level was considered at the
RESULTS
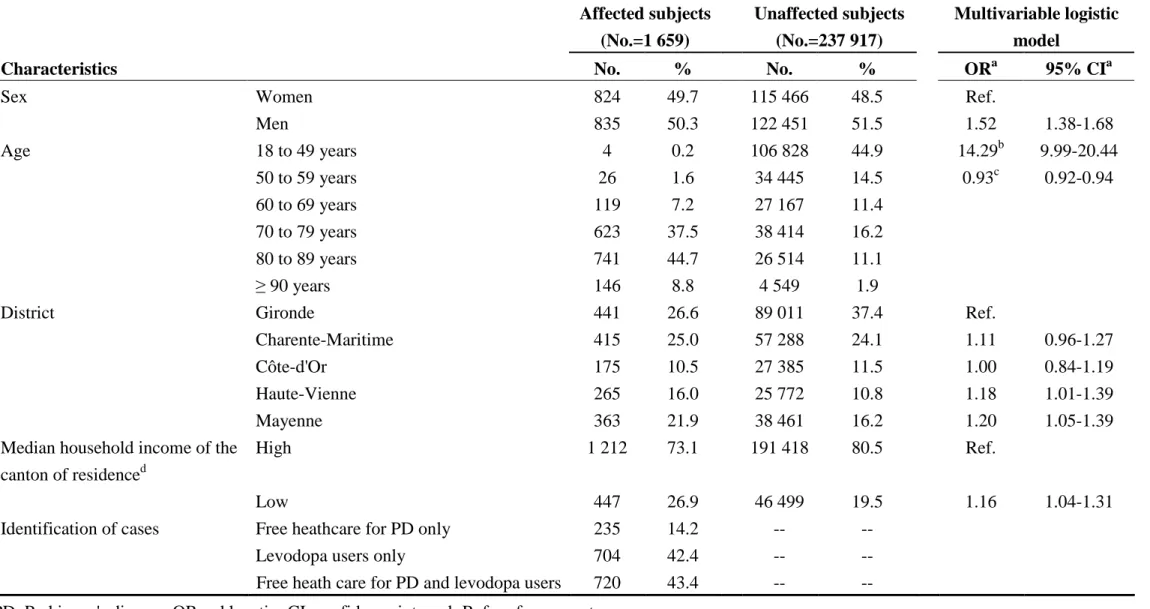
Among 239 576 MSA affiliates ≥18 years in five districts, we identified 1 659 PD cases (Table 1).
Cases were older (median age=80.6 [9.8]) than unaffected subjects (53.5 [36.1]; Wilcoxon
rank-sum test, P<0.001). Among 955 cases with FHC/PD, median age at request was 73.4 (12.6) years,
with a median disease duration at prevalence date of 5.4 (7.1) years.
Supplemental table 1 shows the age- and sex-distribution of MSA affiliates by district;
Mayenne and Haute-Vienne affiliates were the oldest. Densities of 16 farming types varied
significantly across districts (Supplemental Table 2).
PD prevalence
PD prevalence among affiliates ≥18 years old was 6.92/1,000. The corrected prevalence using
sensitivity/specificity of our case definition was 6.80/1,000. Sex- and age-standardized prevalence
(reference: French population ≥18 years) was 3.87/1,000; assuming that there were no cases <18
years, the overall standardized prevalence (reference: total 2007 French population) was
3.01/1,000. The marked prevalence decrease results from the older age of MSA affiliates
compared to the French population (Supplemental Table 1). Prevalence ≥65 years was
19.64/1,000, and 16.86/1,000 after standardization (reference: 2007 French population ≥65 years).
Prevalence increased with age and was higher in men than women (Table 1; Supplemental
Figure 2). The highest prevalence was observed in Mayenne and Haute-Vienne. Prevalence was
higher in cantons with the lowest income.
PD prevalence and farming type
Table 2 shows analyses of the relation between PD and densities of farming type. After adjustment
fruits and permanent crops (FSFPC); this association was confirmed in a mixed-effects model
(OR5th vs 1st quintile=1.21 [1.02-1.43]; P-trend=0.008). The relation between PD prevalence and
FSFPC density was similar across districts (interaction, P=0.410). PD prevalence remained higher
in Mayenne and Haute-Vienne after adjustment for FSFPC density (data not shown), thus
suggesting that other factors explain prevalence differences across districts. PD prevalence was
increased in some quintiles of other farming types (various crops and livestock combined;
specialist dairying; mixed cropping) but without significant trends.
In sex-stratified analyses, PD prevalence increased with FSFPC density in men
(P-trend=0.020), with a similar but weaker pattern among women (P-trend=0.147); this association
was not modified by sex (P-interaction=0.256). No differences were noted between men and
women for other farming types. The relation between PD prevalence and FSFPC density was not
modified by age (P-interaction=0.332). Among cases with FHC/PD (n=995), disease duration was
not associated with FSFPC density (P=0.312).
In univariate analyses including farming types as dichotomous variables, FSFPC were the
only ones associated with PD (Table 3). When all farming types were included in a multivariable
fixed-effects model, FSFPC remained associated with PD. The semi-Bayes model yielded similar
findings: PD prevalence was associated with FSFPC density and ORs increased with density
(P-trend=0.035). For farms specialized in market garden vegetables, prevalence decreased with
increasing density (P-trend=0.041), but the OR for the two top quintiles was not significantly <1.
Ninety five (5.7%) cases used typical neuroleptics regularly. After excluding them, PD
prevalence remained associated with FSFPC density (semi-Bayes OR4+5 vs 1+2+3 quintiles=1.20
[1.06-1.35]; P-trend=0.046).
As part of a case-control study that included PD cases identified in the validation study
(randomly selected among all MSA affiliates; participation rate=77%), PD was inversely
associated with cigarette smoking (OR=0.60); controls who lived in cantons with high FSFPC
density were less often smokers than other controls (OR=0.87). Based on these estimates, the OR
for PD associated with FSFPC unadjusted for cigarette smoking was 1.02 times higher than an
DISCUSSION
Crude PD prevalence among MSA affiliates ≥18 years was 6.92/1,000. Using direct
standardization (reference: total 2007 French population), the overall sex- and age-standardized
prevalence was 3.01/1,000. Prevalence was higher in men than women, and increased with age
and FSFPC density (20% increased prevalence for persons living in cantons with high FSFPC
density).
Orchards (apples, pears, cherries, apricots, plums, peaches), citrus, kiwi, shell, and berry
trees, and nurseries represent the main FSFPC activities. In 1989, FSFPC were the second farming
type in terms of crop protection costs per hectare, after farms specialized in
horticulture/vegetables.7 In 1992, FSFPC (excluding nurseries, berry trees) used herbicides three
times, fungicides five times, and insecticides nine times more than other farms (per hectare); they
ranked first in terms of insecticide and herbicide use.19 In 1998, while FSFPC (excluding
nurseries) accounted for 1% of total French agricultural area, they represented 21% of the overall
insecticide market. In addition, FSFPC are characterized in France by a specific technique of
insecticide/fungicide application (air-assisted spraying),20 which involves a higher loss of
pesticides in the environment during application than non air-assisted spraying. Besides, product
loss takes place in a confined environment caused by the trees, and operator cabs for tractors are
difficult to use. There are therefore important differences in type and amount of pesticides used for
different farming types; pesticide applicators in FSFPC are potentially more exposed to pesticides,
particularly to insecticides, than persons applying pesticides to other crops. For instance, farms
specialized in market garden vegetables used five times less insecticides (per hectare) than FSFPC
in 1992; vineyards ranked second in terms of insecticide use (per hectare), but they used half the
amount of insecticides compared to FSFPC. Because the relation between farms specialized in
with borderline significance, we do not believe that too much emphasis should be placed on this
finding.
Our finding of a higher PD prevalence in cantons with high FSFPC density is consistent
with a study that reported an increased PD risk for orchards’ workers,21 and with studies reporting
an association between PD and insecticides,3,22-25 or increased levels of organochlorine
insecticides in the brain26 or serum27 of PD patients. In addition, laboratory studies show that some
insecticides are neurotoxic and may be involved in PD pathophysiology. Injection of the rotenone
insecticide in rats reproduces several PD features.28 In mice, dieldrin increases alpha-synuclein
expression, alters dopamine metabolism, and increases markers of oxidative stress.29 In vitro
studies show that organochlorines, rotenone, and pyrethrenoids, inhibit complex I of the
mitochondrial respiratory chain.30,31 Thus, insecticides may lead to oxidative stress,32 proteasome
dysfunction, alpha-synuclein aggregation, and cell death.33
We used a semi-individual design and assumed that same canton residents have the same
exposure. Assuming that the agricultural census is comprehensive, this approach leads to Berkson
exposure measurement error.34 Exposure estimates were based on a large number of farms per
canton (median=317 [386]). In addition, cantons are small spatial units and farming type depends
on macro-environmental factors (e.g., type of soil, climate, agronomic history) defined at a larger
scale; therefore, between-worker variance of true exposure is not likely to be large. In logistic
regression, Berkson error biases exposure-effect estimates towards the null, and, under these
conditions (large number of measures, small variance), it has a small impact on effect estimates.35
The semi-individual design does not allow controlling for within-area confounding by unmeasured
factors. The number of 208 cantons reduces the importance of this issue because it is unlikely that
unmeasured factors covary with exposure across the entire range of areas.36 An important feature
confounders, it is closer to individual-level than to ecological studies in terms of etiologic
inference.37
We defined agricultural exposures using the 1988 census. We may have under- or over
estimated exposure to some farming types in persons who worked <1988. Because all analyses are
adjusted, error measurement applies similarly to cases and unaffected subjects in a given
age-group and leads to bias ORs towards the null. In addition, there was a strong correlation in farming
types, including FSFPC, over time at the canton level. The surface of land devoted to FSFPC in
the five districts has remained stable between the 1960s and nowadays, and the association
between PD and FSFPC was not modified by age, thus suggesting that the impact of
age-dependent measurement error was not important.
We defined exposure based on the address of residence at the prevalence date and assumed
that participants lived in the same cantons in 1988 and 2007. As part of a case-control study nested
within our validation study, we collected residential history; a similar proportion of cases (78%)
and controls (79%, P=0.614) had the same postal code (smaller unit than cantons) in 2007 and
1988. For those who moved, the median distance between centroids of postal codes was small (16
km) and similar for cases and controls (P=0.752). Therefore, exposure misclassification induced
by residential mobility would bias association measures towards the null.
Strengths of our study include its population-based design and large size. We were able to
use comprehensive and detailed agricultural data covering all farms in five districts, and
agricultural characteristics were gathered independently of disease status.
Limitations of our study include case definition, without confirmation by a neurologist. It
is however unlikely that diagnostic misclassification depends on farming types; therefore, bias is
likely to be non-differential and lead to ORs closer to the null. In the validation study, we found
depend on FSFPC density (P=0.980). Finally, excluding patients who regularly used typical
neuroleptics did not affect our findings.
Studies based on prevalent cases may suffer from prevalence-incidence bias.38 There is no
obvious reason that PD patients working in FSFPC would have a better disease course than other
patients, and disease duration was not associated with FSFPC density.
We did not have cigarette smoking data but we adjusted for an indicator of socioeconomic
level associated with cigarette smoking.39 Cigarette smoking would act as a confounder if it was
associated with FSFPC density. There was no strong association between these two variables in a
case-control study nested within the validation study; therefore, the bias due to failure to adjust for
smoking was negligible.
In conclusion, among persons working mainly in agriculture, we found a higher PD
prevalence in cantons with high FSFPC density; this finding is consistent with reports of an
association between PD and insecticides. We cannot rule out that PD may be associated with other
farming types that our study did not identify due to variable power or measurement error for
different farming types. Our findings suggest that using farming type as a surrogate for pesticide
exposure or agricultural environment is feasible and provides interesting information, and that
further studies should be conducted among FSFPC workers to study in greater detail this relation
ACKNOWLEDGMENTS: The authors thank Drs Basile Chaix and Chantal
Guihenneuc-Jouyaux for helpful statistical advice, the MSA physicians and personnel at each site (Drs Jacques
Aimedieu, Daniel Albert, Catherine Bolut, Christophe Fuzeau, Virginie Gaussères, Maryline
Grandjean, Jean Houssinot, Marine Jeantet, Bernard Ladépèche, Didier Menu, Omar Tarsissi; Joël
Gourgues, Sandrine Nogues, Emilie Richard, Pierre Vannier), the study interviewers (Véronique
Dumay, Viviane Palleau, Frédérique Pellerin, Estelle Seguin, Sophie Sinibaldi), the study
neurologists (Irina Balaboi, Isabelle Benatru, Julien Dumurgier, Elsa Krim, Danièle Ranoux), and
Aïcha Soumaré for her help in coordinating the study.
AUTHOR ROLES: All authors have reviewed the contents of the article being submitted,
approved of its contents, validated the accuracy of the data. Frédéric Moisan performed statistical
analysis and wrote the first draft of the paper. Johan Spinosi and Laurène Delabre contributed to
exposure assessment. Jean-Luc Dupupet, Jean-Louis Mazurie, Marcel Goldberg, Ellen Imbernon,
and Christophe Tzourio contributed to study design; Jean-Luc Dupupet and Jean-Louis Mazurie
contributed to implementation of the study in the participating districts . Alexis Elbaz designed the
study, obtained the funding, supervised the statistical analyses, and contributed to the writing of
FULL FINANCIAL DISCLOSURES FOR THE PAST YEAR
Frédéric Moisan is a PhD student and has received a scholarship from Ministère de l’enseignement
supérieur et de la recherche.
Johan Spinosi, Laurène Delabre, and Ellen Imbernon are employed by the Institut de Veille
Sanitaire (InVS), the French public organism for health surveillance and do not receive additional
personal funding for research.
Jean-Luc Dupupetand Jean-Louis Mazurie are employed by the Mutualité Sociale Agricole and do
not receive personal funding for research.
Marcel Goldberg is employed by Université Versailles-Saint Quentin and is affiliated to Inserm,
and University Paris 11 but does not receive funding from these institutions.
Christophe Tzourio is employed by Inserm and has received funding for research from Agence
Nationale de la Recherche unrelated to the present project.
Alexis Elbaz is employed by Inserm and has received a salary from Aeres (French public
organism for evaluation of public research) and InVS; he has received funding for research from
REFERENCES
1. Warner TT, Schapira AHV. Genetic and environmental factors in the cause of Parkinson's
disease. Ann Neurol. 2003;53:S16-S23.
2. Dick FD. Parkinson's disease and pesticide exposures. Br Med Bull. 2006;79-80:219-231.
3. Brown TP, Rumsby PC, Capleton AC, Rushton L, Levy LS. Pesticides and Parkinson's
disease--is there a link? Environ Health Perspect. 2006;114:156-164.
4. Hatcher JM, Pennell KD, Miller GW. Parkinson's disease and pesticides: a toxicological
perspective. Trends Pharmacol Sci. 2008;29:322-329.
5. Bower JH, Maraganore DM, McDonnell SK, Rocca WA. Incidence and distribution of
parkinsonism in Olmsted County, Minnesota, 1976-1990. Neurology. 1999;52:1214-1220.
6. Ministère de l’agriculture et de l’alimentation. Enquêtes - Recensement agricole - Pourquoi
un recensement ? 2009. Available at: http://agreste agriculture gouv
fr/enquetes/recensement-agricole/article/pourquoi-un-recensement. Accessed February 8, 2010.
7. FADN (The Farm Accountancy Data Network). 2009. Available at:
http://ec.europa.eu/agriculture/rica/index_en.cfm. Accessed February 8, 2010.
8. Lix LM, Hobson DE, Azimaee M et al. Socioeconomic Variations in the Prevalence and
Incidence of Parkinson's Disease: A Population-Based Analysis. J Epidemiol Community Health.
2010;64:335-340.
9. NISES (National Institute for Statistics and Economic Studies). 2007. Available at:
http://www.insee.fr. Accessed February 8, 2010.
10. Couris CM, Colin C, Rabilloud M, Schott AM, Ecochard R. Method of correction to assess
the number of hospitalized incident breast cancer cases based on claims databases. J Clin
11. Zocchetti C, Consonni D, Bertazzi PA. Relationship between prevalence rate ratios and
odds ratios in cross- sectional studies. Int J Epidemiol. 1997;26:220-223.
12. Greenland S. Avoiding Power Loss Associated with Categorization and Ordinal Scores in
Dose-Response and Trend Analysis. Epidemiology. 1995;6:450-454.
13. Momoli F, Abrahamowicz M, Parent ME, Krewski D, Siemiatycki J. Analysis of multiple
exposures: an empirical comparison of results from conventional and semi-bayes modeling
strategies. Epidemiology. 2010;21:144-151.
14. Thomas DC. The problem of multiple inference in identifying point-source environmental
hazards. Environ Health Perspect. 1985;62:407-414.
15. Greenland S. Hierarchical regression for epidemiologic analyses of multiple exposures.
Environ Health Perspect. 1994;102 Suppl 8:33-39.
16. De Roos AJ, Poole C, Teschke K, Olshan AF. An application of hierarchical regression in
the investigation of multiple paternal occupational exposures and neuroblastoma in offspring. Am
J Ind Med. 2001;39:477-486.
17. Bronstein J, Carvey P, Chen H et al. Meeting Report: Consensus Statement-Parkinson's
Disease and the Environment: Collaborative on Health and the Environment and Parkinson's
Action Network (CHE PAN) Conference 26-28 June 2007. Environ Health Perspect.
2009;117:117-121.
18. Greenland S. Bias Analysis, In: Rothman KJ, Greenland S, Lash TL, eds. Modern
Epidemiology. 3rd ed. Philadelphia: Lippncoot Williams & Wilkons; 2008: 345-80.
19. ECPA (European Crop Protection Association). Agriculture and Environment :
Consumption of pesticides. 2009. Available at: http://nui.epp.eurostat.ec.europa.eu/
20. French National Institute for Agricultural Research. Pesticides, agriculture et
environnement : rapport d’expertise [in French]. 2005. Available at:
http://www.inra.fr/l_institut/expertise/expertises_realisees/pesticides_rapport_d_expertise.
Accessed February 8, 2010.
21. Hertzman C, Wiens M, Bowering D, Snow B, Calne D. Parkinson's disease: a case-control
study of occupational and environmental risk factors. Am J Ind Med. 1990;17:349-355.
22. Gorell JM, Johnson CC, Rybicki BA, Peterson EL, Richardson RJ. The risk of Parkinson's
disease with exposure to pesticides, farming, well water, and rural living. Neurology.
1998;50:1346-1350.
23. Kamel F, Tanner C, Umbach D et al. Pesticide exposure and self-reported Parkinson's
disease in the agricultural health study. Am J Epidemiol. 2007;165:364-374.
24. Hancock D, Martin E, Mayhew G et al. Pesticide exposure and risk of Parkinson's disease:
A family-based case-control study. BMC Neurol. 2008;8.
25. Elbaz A, Clavel J, Rathouz PJ et al. Professional exposure to pesticides and Parkinson
disease. Ann Neurol. 2009;66:494-504.
26. Corrigan FM, Wienburg CL, Shore RF, Daniel SE, Mann D. Organochlorine insecticides
in substantia nigra in Parkinson's disease. J Toxicol Environ Health A. 2000;59:229-234.
27. Waller LA, Gotway CA. Analyzing Public Heath Data. Applied Spatial Statistics for
Public Health Data. Wiley-Interscience, 2004: 7-37.
28. Sherer TB, Kim JH, Betarbet R, Greenamyre JT. Subcutaneous rotenone exposure causes
highly selective dopaminergic degeneration and alpha-synuclein aggregation. Exp Neurol.
2003;179:9-16.
29. Hatcher JM, Richardson JR, Guillot TS et al. Dieldrin exposure induces oxidative damage
30. Schuh RA, Kristian T, Gupta RK, Flaws JA, Fiskum G. Methoxychlor inhibits brain
mitochondrial respiration and increases hydrogen peroxide production and CREB
phosphorylation. Toxicol Sci. 2005;88:495-504.
31. Gassner B, Wuthrich A, Scholtysik G, Solioz M. The pyrethroids permethrin and
cyhalothrin are potent inhibitors of the mitochondrial complex I. J Pharmacol Exp Ther.
1997;281:855-860.
32. Drechsel DA, Patel M. Role of reactive oxygen species in the neurotoxicity of
environmental agents implicated in Parkinson's disease. Free Radic Biol Med. 2008;44:1873-1886.
33. Kanthasamy AG, Kitazawa M, Kanthasamy A, Anantharam V. Dieldrin-induced
neurotoxicity: relevance to Parkinson's disease pathogenesis. Neurotoxicology. 2005;26:701-719.
34. Armstrong BG. Effect of measurement error on epidemiological studies of environmental
and occupational exposures. Occup Environ Med. 1998;55:651-656.
35. Kim HM, Yasui Y, Burstyn I. Attenuation in risk estimates in logistic and Cox
proportional-hazards models due to group-based exposure assessment strategy. Ann Occup Hyg.
2006;50:623-635.
36. Navidi W, Thomas D, Stram D, Peters J. Design and analysis of multilevel analytic studies
with applications to a study of air pollution. Environ Health Perspect. 1994;102:25-32.
37. Kunzli N, Tager IB. The semi-individual study in air pollution epidemiology: a valid
design as compared to ecologic studies. Environ Health Perspect. 1997;105:1078-1083.
38. Ellenberg JH. Differential postmorbidity mortality in observational studies of risk factors
for neurologic disorders. Neuroepidemiology. 1994;13:187-194.
39. Diez Roux AV, Merkin SS, Hannan P, Jacobs DR, Kiefe CI. Area characteristics,
individual-level socioeconomic indicators, and smoking in young adults: the coronary artery
TABLES AND FIGURES LEGENDS
Table 1: Characteristics of Parkinson’s disease cases and unaffected subjects from five French
districts in 2007.
Table 2: Relation between the prevalence of Parkinson's disease in 2007 and the density of
farming types in five French districts.
Table 3: Relation between the prevalence of Parkinson's disease in 2007 and the density of
TABLE 1. Characteristics of Parkinson’s disease cases and unaffected subjects from five French districts in 2007
Affected subjects Unaffected subjects
(No.=1 659) (No.=237 917)
Multivariable logistic model
Characteristics No. % No. % ORa 95% CIa
Sex Women 824 49.7 115 466 48.5 Ref.
Men 835 50.3 122 451 51.5 1.52 1.38-1.68 Age 18 to 49 years 4 0.2 106 828 44.9 14.29b 9.99-20.44 50 to 59 years 26 1.6 34 445 14.5 0.93c 0.92-0.94 60 to 69 years 119 7.2 27 167 11.4 70 to 79 years 623 37.5 38 414 16.2 80 to 89 years 741 44.7 26 514 11.1 ≥ 90 years 146 8.8 4 549 1.9
District Gironde 441 26.6 89 011 37.4 Ref.
Charente-Maritime 415 25.0 57 288 24.1 1.11 0.96-1.27
Côte-d'Or 175 10.5 27 385 11.5 1.00 0.84-1.19
Haute-Vienne 265 16.0 25 772 10.8 1.18 1.01-1.39
Mayenne 363 21.9 38 461 16.2 1.20 1.05-1.39
Median household income of the canton of residenced
High 1 212 73.1 191 418 80.5 Ref.
Low 447 26.9 46 499 19.5 1.16 1.04-1.31
Identification of cases Free heathcare for PD only 235 14.2 -- --
Levodopa users only 704 42.4 -- --
Free heath care for PD and levodopa users 720 43.4 -- -- PD, Parkinson's disease; OR, odds ratio; CI, confidence interval; Ref., reference category.
a
OR (95% CI) from a multivariable model including sex, age (linear and quadratic terms), district and median household income.
b
OR for an increase of 5 years in age (linear term).
c
OR for an increase of 5 years in age squared (quadratic term).
d
TABLE 2. Relation between the prevalence of Parkinson's disease in 2007 and the density of farming
types in five French districts
Farming types Quintiles
Range (/ 100 km²) No. cases No. unaffected ORa 95% CIa P-trend 1 0-0 400 69 525 Ref. Cattle-dairying,
rearing and fattening 2 0-1 241 41 610 1.02 0.87-1.21
combined 3 1-2 286 42 056 1.00 0.85-1.17 4 2-9 352 41 470 1.04 0.88-1.22 5 9-58 380 43 256 0.77 0.57-1.02 0.096 1 0-2 214 46 979 Ref. Field crops-grazing livestock combined 2 2-4 305 47 714 1.09 0.91-1.31 3 4-8 396 46 266 1.10 0.91-1.33 4 8-16 378 49 178 1.08 0.89-1.31 5 16-53 366 47 780 1.04 0.85-1.27 0.656
General field 1 0-0 253 47 393 Ref.
cropping 2 0-2 367 47 213 1.03 0.87-1.21
3 2-8 322 47 992 0.89 0.74-1.07
4 9-26 342 46 803 1.02 0.84-1.24
5 26-106 375 48 516 1.04 0.83-1.30 0.416
Mixed cropping 1 0-1 364 47 197 Ref.
2 1-5 377 47 485 1.02 0.88-1.19 3 5-18 270 47 195 1.21 1.01-1.45 4 19-39 291 47 941 1.18 0.95-1.47 5 42-133 357 48 099 1.30 1.03-1.63 0.088 1 0-0 627 101 356 Ref. Mixed livestock, mainly granivores 2 0-1 225 33 757 0.98 0.84-1.15 3 1-1 216 34 027 0.98 0.84-1.15 4 1-4 273 34 616 0.97 0.82-1.14 5 4-27 318 34 161 0.96 0.70-1.32 0.813 1 0-3 252 47 093 Ref. Mixed livestock, mainly grazing 2 3-5 288 47 524 1.14 0.95-1.36 livestock 3 5-9 301 47 050 0.96 0.80-1.15 4 10-15 389 47 689 1.08 0.90-1.29 5 15-61 429 48 561 1.05 0.88-1.26 0.808 1 0-4 259 46 944 Ref.
Sheep-goats and other
grazing livestock 2 4-8 320 47 543 1.07 0.90-1.28 3 8-14 264 48 172 0.95 0.79-1.14 4 14-34 325 45 422 1.03 0.85-1.23 5 34-210 491 49 836 1.09 0.86-1.39 0.545 1 0-1 315 47 446 Ref. Specialist
cattle-rearing and fattening 2 1-4 270 47 446 0.92 0.78-1.09
3 4-7 261 47 573 0.87 0.74-1.04
4 8-39 318 44 621 0.91 0.76-1.09
Table 2 follows
Farming types Quintiles
Range (/100 km²) No. cases No. unaffected ORa 95% CIa P-trend 1 0-1 369 46 798 Ref. 2 2-4 300 48 067 0.94 0.80-1.11 Specialist cereals, oilseed and protein
crops 3 4-8 285 45 636 1.10 0.91-1.33
4 8-14 347 48 814 1.13 0.94-1.35
5 14-81 358 48 602 1.07 0.88-1.29 0.389
Specialist dairying 1 0-1 246 46 638 Ref.
2 1-3 317 45 886 1.19 1.00-1.41
3 3-6 281 49 449 1.00 0.84-1.20
4 6-19 393 47 214 1.17 0.98-1.39
5 19-331 422 48 730 0.95 0.74-1.21 0.251
1 0-0 315 47 232 Ref.
Specialist fruits and
permanent crops 2 0-1 314 47 625 1.05 0.90-1.24
3 1-2 377 47 398 0.99 0.85-1.16
4 2-4 343 47 437 1.19 1.01-1.39
5 4-31 310 48 225 1.21 1.02-1.43 0.008
Specialist granivores 1 0-0 392 65 577 Ref.
2 0-1 278 43 030 1.01 0.86-1.18
3 1-1 287 43 064 0.98 0.84-1.14
4 1-2 330 43 059 1.09 0.93-1.27
5 2-12 372 43 187 1.10 0.92-1.31 0.245
Specialist horticulture 1 0-0 371 46 397 Ref.
2 0-1 348 47 854 1.00 0.86-1.16 3 1-2 366 48 341 1.06 0.90-1.24 4 2-3 283 47 047 1.06 0.89-1.25 5 3-47 291 48 278 1.08 0.92-1.27 0.391 1 0-0 541 68 420 Ref. Specialist market garden vegetables 2 0-1 315 42 175 0.98 0.85-1.13 3 1-2 307 42 204 1.11 0.94-1.31 4 2-6 254 42 145 1.03 0.86-1.23 5 6-349 242 42 973 0.97 0.83-1.15 0.506
Specialist vineyards 1 0-0 763 87 431 Ref.
2 0-24 201 36 136 0.90 0.71-1.16
3 24-76 261 37 892 1.22 0.94-1.58
4 78-203 246 36 809 1.17 0.92-1.48
5 213-565 188 39 649 1.06 0.82-1.36 0.570
1 0-3 362 46 839 Ref.
Various crops and
livestock combined 2 3-5 366 47 118 1.01 0.86-1.19
3 5-10 301 48 398 1.20 1.01-1.43
4 10-16 311 47 078 1.11 0.91-1.34
5 16-44 319 48 484 1.17 0.97-1.41 0.203
a
OR (95% CI) adjusted for sex, age (linear and quadratic terms), district, and median household income.
TABLE 3. Relation between the prevalence of Parkinson's disease in 2007 and the density of farming types in five French districts: univariate and multivariable models
Univariate modelsa Fixed-effects
multivariable modelb Semi-Bayes multivariable modelc Farming type OR (95% CI)d 4+5 vs 1+2+3 quintiles P-trende OR (95% CI)d 4+5 vs 1+2+3 quintiles P-trende OR (95% CI)d 4+5 vs 1+2+3 quintiles P-trende
Cattle-dairying, rearing and fattening combined 0.99 (0.86-1.13) 0.096 0.98 (0.82-1.17) 0.221 0.98 (0.84-1.14) 0.170 Field crops-grazing livestock combined 0.98 (0.88-1.10) 0.656 0.92 (0.80-1.06) 0.765 0.92 (0.82-1.05) 0.740 General field cropping 1.09 (0.95-1.24) 0.416 1.06 (0.89-1.28) 0.337 1.06 (0.90-1.25) 0.282 Mixed cropping 1.08 (0.92-1.27) 0.088 1.05 (0.85-1.29) 0.556 1.05 (0.87-1.26) 0.508 Mixed livestock, mainly granivores 0.97 (0.84-1.14) 0.813 0.91 (0.77-1.07) 0.839 0.91 (0.79-1.05) 0.818 Mixed livestock, mainly grazing livestock 1.04 (0.93-1.17) 0.808 1.03 (0.88-1.21) 0.998 1.03 (0.90-1.19) 0.998 Sheep-goats and other grazing livestock 1.03 (0.89-1.20) 0.545 1.02 (0.83-1.26) 0.414 1.02 (0.85-1.23) 0.359 Specialist cattle-rearing and fattening 0.97 (0.84-1.14) 0.796 0.99 (0.80-1.21) 0.927 0.99 (0.82-1.18) 0.919 Specialist cereals, oilseed and protein crops 1.08 (0.96-1.22) 0.389 0.99 (0.84-1.16) 0.457 0.99 (0.86-1.14) 0.407 Specialist dairying 1.06 (0.93-1.20) 0.251 1.09 (0.92-1.30) 0.913 1.09 (0.93-1.27) 0.895 Specialist fruits and permanent crops 1.18 (1.06-1.32) 0.008 1.22 (1.07-1.39) 0.062 1.21 (1.08-1.36) 0.035 Specialist granivores 1.09 (0.97-1.23) 0.245 1.09 (0.95-1.24) 0.296 1.09 (0.97-1.22) 0.239 Specialist horticulture 1.04 (0.94-1.16) 0.391 1.08 (0.94-1.23) 0.171 1.08 (0.96-1.21) 0.124 Specialist market garden vegetables 0.96 (0.86-1.08) 0.506 0.89 (0.77-1.03) 0.069 0.89 (0.78-1.02) 0.041 Specialist vineyards 1.09 (0.94-1.25) 0.570 0.94 (0.78-1.12) 0.718 0.94 (0.80-1.10) 0.686 Various crops and livestock combined 1.04 (0.91-1.18) 0.203 0.93 (0.80-1.09) 0.562 0.93 (0.81-1.07) 0.512 a
Logistic regression model built for each farming type separately; adjusted for sex, age (linear and quadratic terms), district, median household income. b
Logistic regression model including all farming types in the same model; adjusted for sex, age (linear and quadratic terms), district, and median household income.
c
Semi-Bayes logistic regression model adjusted for sex, age (linear and quadratic terms), district, and median household income, with all farming types in the same model and assumed to be exchangeable with a prior variance of 0.345.
d
OR for the effect of the two highest quintiles of the density of farming types compared to the three lowest quintiles. e
Test for trend across the five quintiles. OR, odds ratio; CI, confidence interval.