HAL Id: hal-01796106
https://hal.archives-ouvertes.fr/hal-01796106
Submitted on 29 May 2018
HAL is a multi-disciplinary open access archive for the deposit and dissemination of sci-entific research documents, whether they are pub-lished or not. The documents may come from teaching and research institutions in France or abroad, or from public or private research centers.
L’archive ouverte pluridisciplinaire HAL, est destinée au dépôt et à la diffusion de documents scientifiques de niveau recherche, publiés ou non, émanant des établissements d’enseignement et de recherche français ou étrangers, des laboratoires publics ou privés.
Combined narrowband imager-spectrograph with
volume-phase holographic gratings
Eduard Muslimov, Sergei Fabrika, Gennady Valyavin
To cite this version:
Eduard Muslimov, Sergei Fabrika, Gennady Valyavin. Combined narrowband imager-spectrograph with volume-phase holographic gratings. SPIE Optical Metrology, May 2017, Munich, Germany. �10.1117/12.2270098�. �hal-01796106�
Combined narrowband imager-spectrograph with volume-phase
holographic gratings
Eduard R. Muslimov*
a ,b, Sergei N. Fabrika
c, Gennady G. Valyavin
ca
Aix Marseille Univ, CNRS, LAM, Laboratoire d'Astrophysique de Marseille, Marseille, France;
bKazan National Research Technical University named after A.N. Tupolev-KAI 10 K. Marx, Kazan,
Russian Federation 420111,
cSpecial Astrophysical Observatory of the Russian AS, Nizhnij Arkhyz,
Russian Federation 369167
ABSTRACT
In the present work we discuss a possibility to build an instrument with two operation modes - spectral and imaging ones. The key element of such instrument is a dispersive and filtering unit consisting of two narrowband volume-phase holographic gratings. Each of them provides high diffraction efficiency in a relatively narrow spectral range of a few tens of nanometers. Besides, the position of this working band is highly dependent on the angle of incidence. So we propose to use a couple of such gratings to implement the two operational modes. The gratings are mounted in a collimated beam one after another. In the spectroscopic mode the gratings are turned on such angle that the diffraction efficiency curves coincide, thus the beams diffracted on the first grating are diffracted twice on the second one and a high-dispersion spectrum in a narrow range is formed. If the collimating and camera lenses are corrected for a wide field it is possible to use a long slit and register the spectra from its different points separately. In the imaging mode the gratings are turned to such angle that the efficiency curves intersect in a very narrow wavelength range. So the beams diffracted on the first grating are filtered out by the second one except of the spectral component, which forms the image. In this case the instrument works without slit diaphragm on the entrance. We provide an example design to illustrate the proposed concept. This optical scheme works in the region around 656 nm with F/# of 6.3. In the spectroscopic mode it provides a spectrum for the region from 641 to 671 nm with reciprocal linear dispersion of 1.4 nm/mm and the spectral resolving
power higher than 14000. In the imaging mode it covers linear 12mmX12mm field of view with spatial resolution of
15-30 lines/mm.
Keywords: volume phase grating, high resolution spectroscopy, spectral selectivity, narrowband imaging.
1. INTRODUCTION
High-resolution spectroscopy in a selected waveband represents a powerful diagnostics tool, which is in use for different applications. A good example can be found in the field of nuclear fusion, where spectral measurements around specific
emission lines like the carbon triplet1 or the H-alpha line2,3 are used to control the plasma state. On the other hand, in the
same application field there are cases when the image in a narrow spectral range is registered4,5. In the first case a
spectrograph with a complex dispersive unit1 can be used, while in the second one interference filter represents a typical
solution. In the present article we consider a possibility to combine both of the measurement modes in a single instrument.
Beforeone of the authors had considered an optical scheme of a high-resolution narrowband spectrograph with a pair of
volume-phase holographic (VPH) gratings6. It was shown that in spite of high diffractive efficiency for the central
wavelength the high-dispersion gratings are characterized by strong spectral selectivity. When two gratings are mounted one after another it causes huge transmission losses on the spectrum edges, which limits application of such a scheme in spectrographs. In addition, the scheme is very sensitive to the gratings positioning. However, in the context of the present problem these features can be turned into advantages. Spatial and angular selectivity are well-known properties of VPH
gratings7, which were used several times spectral and spatial filtering8 and for creation of tunable filters9.
We propose an optical scheme which also uses two VPH gratings to provide high dispersion in the spectral mode. To switch to the imaging mode both of the gratings are turned to such an angle that their individual diffraction efficiency
Optical Measurement Systems for Industrial Inspection X, edited by Peter Lehmann, Wolfgang Osten, Armando Albertazzi Gonçalves Jr., Proc. of SPIE Vol. 10329, 103293R · © 2017 SPIE
CCC code: 0277-786X/17/$18 · doi: 10.1117/12.2270098 Proc. of SPIE Vol. 10329 103293R-1
a spectrum plane entrance slit camera lens 2ntlgrating collimator b image plane camera lens 2ntlgrating intermediate
1stgrating image collimator
(DE) curves intersect each other in a narrow region. Implementation of this simple concept requires a special approach to the design process because numerous mutually connected target parameters should be controlled in two modes. The paper is organized as follows. In Section 2 we present optical scheme, exemplifying the above-mentioned idea and provide estimation of its image quality in two modes. Section 3 contains description of the instrument throughput and bandwidth control. In Section 4 we discuss the obtained results, limitations and possible improvements of this design.
2. OPTICAL DESIGN
To demonstrate the proposed concept we consider optical scheme of a combined instrument working around H-alpha line in two modes. The initial data taken for the design is summarized in Table 1. We should note that these values are not connected to any existing application or device and just approximately correspond to the currently available components and instruments.
Table 1. Initial data for the instrument design.
Wavelength, nm Spectral mode Imaging mode
Wavelength, nm 641-671 656 Entrance diaphragm size, mm2 12 x0.025 12x12 Image size, mm2 12x21.5 12x12 F/# 6.3 6.3 Linear magnification 1 1 2.1. Optical scheme
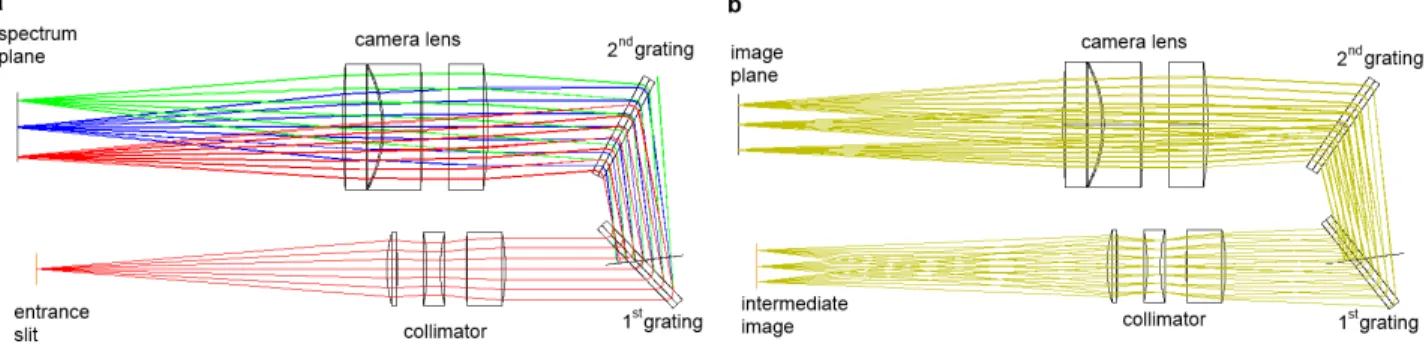
The optical scheme consists of two lenses – collimator and camera and two VPH gratings. The aperture and field of view are relatively moderate so it is enough to use simple triplet-type lenses. Focal length of each of them is 150 mm. The gratings operate with large angles of incidence and diffraction. The rotation angles sum is equal to 180º to keep simple and compact layout. Each of the gratings is recorded in a photosensitive material (e.g. dichromated gelatin – DCG) on a
glass substrate and protected by a cover glass. The first grating has spatial frequency of 2284 mm-1, and the second one
has 1957 mm-1. The general view of the scheme in two modes is pre
Figure 1. Optical scheme of the instrument: a – spectral mode, b – imaging mode.
2.2. Image quality
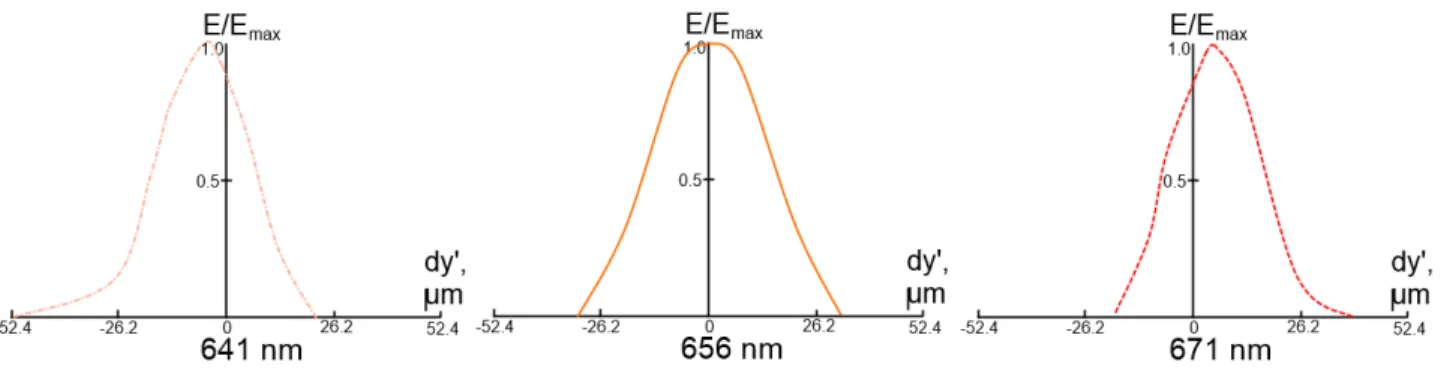
To estimate the optical quality achieved in the spectral mode the instrument functions (IF) are used. The IF calculated for the entrance slit width of 25 µm are plotted on Fig.2.
Proc. of SPIE Vol. 10329 103293R-2
E/Emax 1.0 0.5 E/Emax E/Emax 1.0 ^., , -52.4 -26.2 0 26.2 641 nm dy', Pm 52.4 -52.4 -26.2 0 26.2 656 nm `, , , , / , ,, 10.5 ' ! 1 , ; 1 dy', ;' \ dy', , Pm , , ;`
m
52.4 -52.4 -26.2 0 26.2 ` 52.4 671 nm 007: 6.0000, 0.0000 m 08I: -6.0000, 0.0000 b 1 n®: -0.000,-0.187 m IBW: -5.997,0.192 m Im: 5.987, 09,T: 0.0000,0.0000 m 0&7: -6.0000,0.0000no 093: 6.0000, 0.192 m 0.0000 m EIIAe -0.000, -3.1e7 ea. I9W: 5.987,0.192 m IlA: -5.987,0.192 m
085: 0.0000, 081: -6.0000,0.0000 m 085: 6.0000,0.0000 m MENEM MENEM II16: 5.987, 0.192m I809: -5.987, 0.192 m TS - .0000, 6.0000 mu TS 6 0000, 0.0000 mu TS 6.0000, -6.0000 mm TS 0.0000 6.0000 mu TS 0 0000 0.0000 mu Ts 0 0000, -6.0000 mu TS 6.0000, 6.0000 m9 TS-6.0000, 0.0000 mu TS -6.0000, -6.0000 mu
Spatial Frequency in cycles per mm
Figure 2. Instrument functions in the spectral mode for the entrance slit width of 25 µm.
Using the IF data and the reciprocal linear dispersion value, which equal to 1.395 nm/mm, it is possible to compute the spectral resolution and the unitless spectral resolving power (see Table 2). One can see that the spectral resolution is high over entire the working range. In addition we can note here that these numbers almost do not change for different X coordinate values, so measurements with a long slit are possible.
Table 2. Instrument resolution in the spectral mode.
Wavelength, nm Instrument function
FWHM, µm Spectral resolution, nm Spectral resolving power 641 26.4 0.037 17402 656 33.6 0.047 13993 671 25.6 0.036 18785
For estimation of the instrument spatial resolution in the imaging mode the spot diagrams and module transfer function (MTF) are used. The spot diagrams (Fig. 3a) has root-mean square of 17.3-19.9, 12.4-13.9 and 9.0-13.9 µm at 641, 656
and 671 nm, respectively. The spatial resolution defined by the MTF varies from 15 to 30 mm-1.
Figure 3. Image quality in the imaging mode: a – spot diagrams, b – module transfer function.
3. THROUGHPUT CONTROL
3.1. Diffraction efficiency modeling and optimization
If the frequency and angle of incidence of a VPH grating are given, its efficiency depends on the hologram thickness, index modulation and inclination of the fringes. However, angle of incidence on the second grating is determined by diffraction on the first one, so the DE curves of the gratings cannot be optimized separately. A script, which performs
Proc. of SPIE Vol. 10329 103293R-3
a
100 90 grating - - 2nd grating product 80 70 \h 60 50 40 30 20 10 40 645 650 655 660 665 670 675 wavelength, nm 0 845 850 655 660 wavelength. nm 685 670 675principal ray tracing and then computes DE of each of the gratings for a separate beam, was used for calculation and optimization of the gratings pair throughput. The DE computation was performed with use of rigorous coupled-wave
analysis (RCWA) method implemented in reticolo software10,11.
Then the gratings throughput can be optimized by means of ordinary procedure12. The difference in this case consists of
control on the angles of incidence. For the spectral mode they are defined on the previous design stage and cannot be changed, while for the imaging mode they represent free optimization parameters, which are used to achieve desired centering and bandwidth of the throughput curve. In the latter case special boundary condition defining sum of the rotation angles should be applied. The gratings parameters obtained after the optimization are listed in Table 3.
Table 3. VPH gratings parameters.
Parameter 1st grating 2nd grating
Fringes frequency, mm-1 2284 1957 Holographic layer thickness, µm 12 6.3 Index modulation 0.027 0.048 Fringes inclination 2.15 -6.9
Rotation angle in the spectral mode, º
43.94 46,5
Rotation angle in the imaging mode, º
54.87 48.9
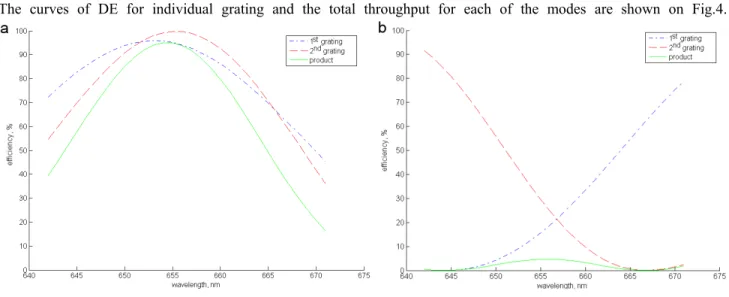
The curves of DE for individual grating and the total throughput for each of the modes are shown on Fig.4.
Figure 4. Diffraction efficiency curves: a – spectral mode, b – imaging mode.
The graphs clearly show that the total bandwidth becomes narrower with rotation of the gratings. However, the peak transmission value significantly decreases. It would be possible to minimize this undesired effect if the DE curves of the
gratings had sharp edges. Such a property can be achieved for one edge of VPH grating efficiency curve13, but it cannot
be repeated with an arbitrary working geometry. In the present case it was found to be impossible to meet this additional
Proc. of SPIE Vol. 10329 103293R-4
a 9 940 HHü 927 b 6100.00 5502.00 4904.00 4306.00 OO'bT6i OO'ZTSZ OO'OTTE OO'90LE OEOI Phh PSPE 099E 1226 616 -9.6 -7.2 -9_H -2.9 0 2.9 2 Y coordinate value 1316.00 718.00 120.00
condition with a limited number of free parameters. Other means like change of the fringes profile14 do not have any
significant effect.
On the other hand, the throughput parameters change continuously with rotation of the gratings, thus allowing to tune the instrument performance. Values for intermediate positions of the gratings are given in Table 4.
Table 4. Change of the total throughput.
1st grating rotation angle, º 2nd grating rotation angle, º Throughput curve FWHM, nm Peak transmission, % Spectral image length, mm 43.94 54.87 12.0 94.92 21.50 44.5 53.7 11.4 89.87 21.74 45.0 52.5 9.7 67.86 22.03 45.5 51.3 8.0 39.93 22.34 46.0 50.1 5.5 17.07 22.66 46.5 48.9 5.2 4.81 23.00 3.2. Images simulation
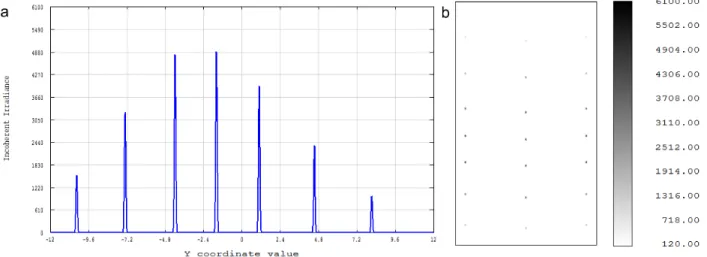
To demonstrate performance of the developed scheme we simulated images in the both of working modes. They were produced by means of non-sequential ray tracing, which allows to account for actual diffraction efficiency and rays splitting. In each case 7 wavelengths covering the range from 642 to 670 nm were traced. The object was presented by an array of point sources. For considerations of simplicity each of them had power of 1W. For the spectral mode 3 sources with coordinates equal to (-6 mm, 0 mm), (0 mm, 0 mm) and (6 mm, 0 mm) were used. The of ray tracing are shown on Fig.5 (the image is slightly defocused to provide better seeing). Positive direction of the Y coordinate on the graph corresponds to increase of the wavelength.
Figure 5. Simulated image in the spectral mode: a – column cross-section, b – gray-scale image (the irradiation units are W/cm2).
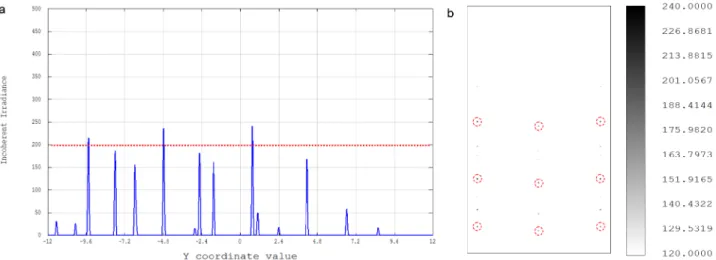
The same simulation was repeated with the imaging mode configuration. This time 9 point sources with X and Y coordinates equal to -6, 0 or 6 mm were used. The results are presented on Fig.6. The image corresponding to wavelength of 656 nm is highlighted. Except of the target wavelength there are other spectral components present in the image. Their influence can be decreased, if the detector has a cut-off level (like the dashed line shown on Fig.6a). Such a cut-off is accounted for on Fig.5b and 6b. One can see that it has a negligible influence on the spectral image. But allows to separate the desired band in the narrowband image. Besides, the residuals in the image can be excluded if spectrum of the observed object is known in advance.
Proc. of SPIE Vol. 10329 103293R-5
a 500 450 400 350 300 250 200 150 100 5 0 h A -12 -9 6 -7.2 -4 8 2.4 A 2.4 A Y coordinate value 4.8 7.2 9.6 12 240.0000 226.8681 213.8815 201.0567 188.4144 175.9820 163_7973 151.9165 140.4322 129.5319 120.0000
Figure 6. Simulated image in the imaging mode: a – column cross-section, b – gray-scale image (the irradiation units are W/cm2).
This scheme may be really very useful for astrophysics in a search for massive stars like LBV (Luminous Blue Variables), and very massive stars (VMS) with masses exceeding 150 solar masses, and X-rays sources in nearby galaxies. Using imaging mode one may cover the whole galaxy to detect emission objects (H-alpha line) to separate HII regions which are very numerous in galaxies (the line width less than 20 km/sec) and to detect LBVs, whoes line width bigger than 150-300 km/sec (spectral resolution higher than 1000-2000). After selection the potential LBV stars one may
change to spectral mode to find the massive stars with strong winds. There are no many LBVs in nearby galaxies 15-17,
however discovery such objects is very important. The same is valid for VMSs, where only a few such stars were
found18. It is very essential to discover new SS433-like objects in galaxies19-21, they are black holes with super-Eddington
accretions disks because only one such object (SS433) has been found in the Milky Way. An absolutely new topic is
detection of Ultraluminous X-ray Sources (ULXs)22,23, no one ULX has been found in the Milky Way and even in the
Local Group of galaxies. However, up to 50 Mpc in the local Universe about 30 ULXs have been detected, and only 10 such objects have been detected with optical spectra. The ULX-search is very significant; as a rule they are discovered in galaxies with a strong star formation rate.
4. CONCLUSION
In the present paper we considered optical design of a tunable narrowband spectrograph. It operates around H-alpha with high dispersion. The dispersion is provided by two VPH gratings mounted one after another in collimated beam. By rotation of these gratings it is possible to control the instrument bandwidth, which changes by factor of 2.3. When the gratings are turned by 3.56º and 5.97º respectively. So in the extreme positions two modes are implemented. In the first one a bright high-dispersion spectrum for a long slit is formed. The spectral resolving power in the range of 641-671 nm is 13993-18785. In the second one the instrument creates a narrowband image for a square field of view. Spatial
resolution in this imaging mode is 15-30 mm-1. The optical scheme is notable for its simplicity and compactness.
Numerical simulations demonstrate that in the spectral mode the instrument provides high irradiation of the image. In the imaging mode there is a visible loss of energy and a risk of dispersive blurring of the image. These problems are caused by inappropriate shape of the diffraction efficiency curves. They can be partially solved by control of the detector cut-off or use of a priori information about the object.
The proposed scheme can be of special interest for some diagnostics applications like that in the field of nuclear fusion. However, its possible application can be significantly extended on account for astrophysics.
Proc. of SPIE Vol. 10329 103293R-6
ACKNOWLEDGEMENT
This work was supported by the Russian Science Foundation (project No. 14-50-00043). Eduard Muslimov acknowledges the support of his personal post-doc contract by the European Research council through the H2020 - ERC-STG-2015 – 678777 ICARUS program. The authors also thank J.-P. Hugonin and Ph. Lalanne from Institut d’Optique for provision of the reticolo software used in this work.
REFERENCES
[1] Weinzettl, V. et al., “High-resolution spectroscopy diagnostics for measuring impurity ion temperature and velocity on the COMPASS tokamak,” Fusion Engineering and Design, 96–97, 1006 (2015). [2] Krasilnikov, A.V. et al., “Progress with the ITER project activity in Russia,” Nuclear Fusion, 55 (10),
104007 (2015).
[3] Andreenko, E. N., Alekseev, A. G., Gorshkov, A. V., and Orlovskiy, I. I., “Optical dumps for H-alpha and visible spectroscopy in ITER,” AIP Conference Proceedings 1612, 171 (2014).
[4] Maqueda, R. J. and Wurden, G. A., “Images of Plasma Disruption Effects in the Tokamak Fusion Test Reactor,” IEEE Transactions on plasma science, 27 (1), 112 (1999).
[5] Van Zeeland, M. A., Heidbrink, W. W. and Yu, J. H., “Fast ion Dα imaging in the DIII-D tokamak,” Plasma Physics and Controlled Fusion, 51(5),1 (2009).
[6] Nureev, I. I. et al., “Methods of dispersion improvement in a fiber-fed spectrograph scheme,” Proc. SPIE 9807, 98070Y (2016).
[7] Caulfield, H. J., [Handbook of optical holography], Academic Press, New York, 587 (1979).
[8] Reingand, N. O. et al., “Very selective volume holograms for spatial and spectral filtering,” Proc. SPIE 3897, 72 (1999).
[9] Havermeyer, F. et al. “Volume holographic grating-based continuously tunable optical filter,” Opt. Eng., 43(9), 2017 (2004).
[10] Chateau, N. and Hugonin, J.-P., “Algorithm for the rigorous coupled-wave analysis of grating diffraction,” J. Opt. Soc. Am. A, 11, 1321 (1994).
[11] Lalanne, P. and Hugonin, J.-P., "High-order effective-medium theory of subwavelength gratings in classical mounting: application to volume holograms," J. Opt. Soc. Am. A, 15, 1843 (1998).
[12] Muslimov, E., “Transmission holographic grating with improved diffraction efficiency for a flat-field spectrograph,” Proc. SPIE 8787, 87870B (2013).
[13] Saunders, W., “Very fast transmissive spectrograph designs for highly multiplexed fiber spectroscopy,” Proc. SPIE 9908, 990896 (2016).
[14] Bianco, A. et al., “Materials for VPHGs: practical considerations in the case of astronomical instrumentation,” Proc. SPIE 8450, 84502W (2012).
[15] Fabrika, S., Sholukhova, O., Becker, T., Afanasiev, V., Roth, M. and Sanchez, S. F., “Crowded field 3D spectroscopy of LBV candidates in M 33”, Astronomy and Astrophysics 437, 217 (2005).
[16] Sholukhova, O. N., Fabrika, S. N., Zharova, A. V., Valeev, A. F. and Goranskij, V. P., “Spectral variability of LBV star V 532 (Romano's star),” Astrophys. Bull., 66, 123 (2011).
[17] Sholukhova, O., Bizyaev, D., Fabrika, S., Sarkisyan, A., Malanushenko, V. and Valeev, A., “New luminous blue variables in the Andromeda galaxy,” Monthly Notices of the Royal Astronomical Society, 447, 2459 (2015).
[18] Crowther, P. A., Schnurr, O., Hirschi, R., Yusof, N., Parker, R. J., Goodwin, S. P. and Kassim, H. A., “The R136 star cluster hosts several stars whose individual masses greatly exceed the accepted 150 M solar stellar mass limit,” Monthly Notices of the Royal Astronomical Society, 408, 731 (2010). [19] Fabrika, S. and Sholukhova, O., “A Search for Unique Objects in Nearby Galaxies,” Astrophysics and
Space Science, 226, 229 (1995).
[20] Fabrika, S. N., “The Supercritical Accretion Disk of SS 433,” Astrophysics and Space Science, 252, 439 (1997).
Proc. of SPIE Vol. 10329 103293R-7
[21] Fabrika, S. N., “An extended disc around SS 433,” Monthly Notices of the Royal Astronomical Society, 261, 241 (1993).
[22] Poutanen, J., Fabrika, S., Valeev, A. F., Sholukhova, O. and Greiner, J., “On the association of the ultraluminous X-ray sources in the Antennae galaxies with young stellar clusters,” Monthly Notices of the Royal Astronomical Society, 432, 506 (2013)
[23] Fabrika, S., Ueda, Y., Vinokurov, A., Sholukhova, O. and Shidatsu, M. “Supercritical accretion disks in ultraluminous X-ray sources and SS 433,” Nature Physics, 11, 551 (2015).
Proc. of SPIE Vol. 10329 103293R-8