HAL Id: hal-00301692
https://hal.archives-ouvertes.fr/hal-00301692
Submitted on 11 Aug 2005HAL is a multi-disciplinary open access
archive for the deposit and dissemination of sci-entific research documents, whether they are pub-lished or not. The documents may come from teaching and research institutions in France or abroad, or from public or private research centers.
L’archive ouverte pluridisciplinaire HAL, est destinée au dépôt et à la diffusion de documents scientifiques de niveau recherche, publiés ou non, émanant des établissements d’enseignement et de recherche français ou étrangers, des laboratoires publics ou privés.
The bi-directional exchange of oxygenated VOCs
between a loblolly pine (Pinus taeda) plantation and the
atmosphere
T. Karl, P. Harley, B. Baker, K. Jardine, E. Nemitz, A. Guenther
To cite this version:
T. Karl, P. Harley, B. Baker, K. Jardine, E. Nemitz, et al.. The bi-directional exchange of oxygenated VOCs between a loblolly pine (Pinus taeda) plantation and the atmosphere. Atmospheric Chemistry and Physics Discussions, European Geosciences Union, 2005, 5 (4), pp.5875-5907. �hal-00301692�
ACPD
5, 5875–5907, 2005 Exchange of oxygenated VOCs in the atmosphere T. Karl et al. Title Page Abstract Introduction Conclusions References Tables Figures J I J I Back Close Full Screen / EscPrint Version Interactive Discussion
EGU
Atmos. Chem. Phys. Discuss., 5, 5875–5907, 2005 www.atmos-chem-phys.org/acpd/5/5875/
SRef-ID: 1680-7375/acpd/2005-5-5875 European Geosciences Union
Atmospheric Chemistry and Physics Discussions
The bi-directional exchange of
oxygenated VOCs between a loblolly pine
(Pinus taeda) plantation and the
atmosphere
T. Karl1, P. Harley1, B. Baker2, K. Jardine2, E. Nemitz3, and A. Guenther1
1
National Center for Atmospheric Research, Boulder, CO, USA
2
South Dakota School of Mines and Technology, Rapid City, SD, USA
3
Centre for Ecology and Hydrology (CEH), Edinburgh, UK
Received: 1 July 2005 – Accepted: 12 July 2005 – Published: 11 August 2005 Correspondence to: T. Karl ([email protected])
ACPD
5, 5875–5907, 2005 Exchange of oxygenated VOCs in the atmosphere T. Karl et al. Title Page Abstract Introduction Conclusions References Tables Figures J I J I Back Close Full Screen / EscPrint Version Interactive Discussion
EGU
Abstract
Using new in-situ field observations of the most abundant oxygenated VOCs (methanol, acetaldehyde, acetone, C3/C4 carbonyls, MVK+MAC and acetic acid) we were able to constrain emission and deposition patterns above and within a loblolly pine
(Pi-nus taeda) plantation with a sweetgum (Liquidambar styraciflua) understory. Canopy
5
scale measurements showed significant emission of methanol and acetone, while MVK+MAC, acetaldehyde and acetic acid were mainly deposited during the day. All oxygenated compounds exhibited strong losses during the night that could not be explained by conventional dry deposition parameterizations. Accompanying leaf level measurements indicated that methanol and acetone were primarily emitted from
10
loblolly pine. The exchange of acetaldehyde was more complex. Laboratory measure-ments made on loblolly pine needles indicated that acetaldehyde may be either emit-ted or taken up depending on ambient concentrations, with the compensation point increasing exponentially with temperature, and that older needles tended to emit more acetaldehyde than younger needles. Canopy scale measurements suggested mostly
15
deposition. Short-time (approx. 2 h) ozone fumigation had no detectable impact on post-exposure emissions of methanol and acetone, but modified the exchange rates of acetaldehyde. The emission of a variety of oxygenated compounds (e.g. carbonyls and alcohols) was triggered or significantly enhanced during ozone fumigation. These results suggest that increasing ozone levels in the future might enhance the biogenic
20
contribution of some oxygenated compounds; those with sufficiently low vapor pres-sures may potentially influence secondary organic aerosol growth. Compounds re-cently hypothesized to be primarily produced in the canopy atmosphere via ozone plus terpenoid-type reactions can also originate from the reaction of ozone with leaf sur-faces. This needs to be taken into account when scaling up very reactive biogenic
25
ACPD
5, 5875–5907, 2005 Exchange of oxygenated VOCs in the atmosphere T. Karl et al. Title Page Abstract Introduction Conclusions References Tables Figures J I J I Back Close Full Screen / EscPrint Version Interactive Discussion
EGU
1. Introduction
The emission of biogenic volatile organic compounds (VOC) is recognized as the largest terrestrial source of reactive carbon to the atmosphere (Guenther et al., 1995). While significant emissions of oxygenated VOC (OVOC) from plants are generally ac-knowledged, their biogenic budgets in particular remain very uncertain (Heikes et al.,
5
2002; Singh et al., 2004). Biochemical pathways for the production for some of these oxygenated compounds have recently been elucidated by various groups and reviewed by Fall (2003). For example, methanol is produced in plants from demethylation of pectin and attributed to plant cell wall growth and repair. While acetone is believed to originate from cyanogenesis and the decarboxylation of acetoacetate, acetaldehyde
10
was shown to be emitted as a result of the oxidation of ethanol arising in anoxic tissues (Kreuzwieser et al., 2000). Labeling studies using13C suggest that it can also origi-nate from recently fixed carbon and could be produced from cytosolic pyruvate, which could trigger acetaldehyde formation under rapidly changing light conditions (Karl et al., 2002a). Graus et al. (2004) have hypothesized that Acetyl-Co A might also be
15
linked to the production of acetaldehyde and related to wound VOCs (Fall et al., 1999; Hatanaka, 1996).
In the past emissions of aldehydes and ketones have been observed from various plants, but in most cases only limited qualitative assessments are available above forests (Steinbrecher and Rabong, 1994; Janson et al., 1999). Compensation point
20
and canopy scale measurements of OVOCs are still extremely scarce (Kesselmeier, 2001). Rottenberger et al. (2004) reported the compensation point of acetaldehyde for a tropical tree species and its variation between wet and dry seasons. Cojocariu et al. (2004) presented similar measurements for Norway Spruce (Picea abies) using branch enclosures. Schade and Goldstein (2001) observed high fluxes of methanol,
25
acetone and acetaldehyde above a plantation of ponderosa pine (Pinus ponderosa) and investigated plant-physiological influences on these emissions (Schade and Gold-stein, 2002). Seasonal variations in biogenic OVOCs above a North American
decid-ACPD
5, 5875–5907, 2005 Exchange of oxygenated VOCs in the atmosphere T. Karl et al. Title Page Abstract Introduction Conclusions References Tables Figures J I J I Back Close Full Screen / EscPrint Version Interactive Discussion
EGU
uous forest in Michigan were attributed to a combination of senescing and growing vegetation (Karl et al., 2003). Overall these studies provide experimental evidence that the emission of compounds such as methanol, acetaldehyde and acetone exhibit a complex emission/deposition behavior. It is now also recognized that these com-pounds can be released from decaying plant material (Warneke et al., 1999), naturally
5
drying grass (Karl et al., 2005) and crops (Schade and Custer, 2004).
Holzinger et al. (2004) recently reported the presence of a large number of higher molecular weight compounds (>100 amu) in the air within and above a ponderosa pine plantation and speculated that they were exclusively products of reactions between ozone and highly reactive terpenoids, many of which were undetected, that were
emit-10
ted from the forest. While some of these compounds may originate from gas phase terpenoid oxidation with ozone (Calogirou et al., 1999), some are also known to be formed from the reaction of ozone with leaf surfaces (Fruekilde et al., 1998; Wildt et al., 2003). It is still not clear which of these processes is the dominant source of oxy-genated species, especially in the higher mass range (e.g. >100 amu).
15
Recently, various parameterizations have been incorporated into global chemistry and transport models in order to constrain biogenic OVOC emissions and derive budget estimates (Jacob et al., 2002). While complex plant physiological models (Niinemets et al., 2004) are being developed, a mechanistic model has been used to assess the global budget of methanol (Galbally and Kirstine, 2002). Global and regional chemistry
20
models typically incorporate an exponentially increasing temperature dependence for the emissions of all VOC, including those of OVOC. However, whether OVOCs are emitted or deposited depends on their relative concentrations within the leaf and in the atmosphere outside the leaf boundary layer. The rate of OVOC production, and thus the compensation point, depends on many parameters such as enzyme activities,
25
stress and nutrient levels, and may vary seasonally. In order to model the exchange of these compounds and constrain regional and global budgets, combined investigations of process level and canopy scale studies are a crucial link in order to develop accu-rate emission algorithms. Here we present results from the recent CELTIC (Chemical
ACPD
5, 5875–5907, 2005 Exchange of oxygenated VOCs in the atmosphere T. Karl et al. Title Page Abstract Introduction Conclusions References Tables Figures J I J I Back Close Full Screen / EscPrint Version Interactive Discussion
EGU
Emission, Loss, Transformation and Interaction within Canopies) field study in the east-ern US above a loblolly pine (Pinus taeda) plantation with a sweetgum (Liquidambar
styraciflua) understory. Using a combination of leaf and canopy level measurements we
investigated the bi-directional exchange of the most abundant oxygenated compounds.
2. Experimental
5
2.1. Laboratory leaf level measurements
Young saplings of loblolly pine (Pinus taeda) and sweetgum (Liquidambar styraciflua) were purchased in 2004 from Forestfarm Nursery (Williams, OR) and maintained in the NCAR Frost Phytotron Leaf gas exchange measurements were made using a com-mercial leaf photosynthesis system (MPH-1000, Campbell Scientific, Logan, UT) in
10
conjunction with a temperature-controlled glass leaf enclosure constructed in house. Humidifed and dry zero air (Zero Air Generator) were mixed with CO2 (16 700 ppmv in zero air) using mass flow controllers (Model 824, Edwards High Vacuum, MA) to gen-erate a gas stream of known CO2concentration and dew point, free of O3, which was passed to the enclosure. Flow rate of air flowing into the enclosure was measured with
15
a mass flow controller (Model 824, Edwards High Vacuum, MA). The difference in CO2 and H2O vapor partial pressures between air entering and leaving the enclosure was measured with an infrared gas analyzer (LI-6262, Li-Cor, Lincoln, NE) in differential mode. The dew point of air entering the enclosure was measured using a dew point mirror (General Eastern, Watertown, MA). Rates of net photosynthesis, transpiration
20
and stomatal conductance were calculated according to Farquhar et al. (1980).
The enclosure consisted of an upper and lower chamber, each consisting of a glass cylinder (8 cm diameter) enclosed on one end (total volume=approx. 300 cm3). A small hole in the lower chamber accommodated the shaft of a fan motor (ESCAP Model 22N28, Danaher Motion, Wood Dale, IL) to which was attached a plastic fan 4 cm
25
ACPD
5, 5875–5907, 2005 Exchange of oxygenated VOCs in the atmosphere T. Karl et al. Title Page Abstract Introduction Conclusions References Tables Figures J I J I Back Close Full Screen / EscPrint Version Interactive Discussion
EGU
chamber halves, sandwiched between two 1/8-inch closed cell foam gaskets. Incident photosynthetically active radiation (PAR) was measured outside the enclosure with a photodiode calibrated against a PAR quantum sensor (LI-192 Li-Cor, Lincoln, NE), and leaf temperature was measured using a copper-constantan thermocouple (Omega En-gineering, Stamford, CN) appressed to the bottom of the leaf (in the case of sweetgum)
5
or placed in close proximity to a needles in the case of loblolly pine. Temperature con-trol (±0.2◦C, between 20◦C and 45◦C) was achieved using two Peltier thermoelectric coolers sandwiched between the bottom of the enclosure and an air cooled heat sink.
Optionally a photolytic O3 source was turned on after and before the plant cham-ber to assess the effect of ozone fumigation. Ozone was measured by UV absorption
10
(Model 202, 2B Technologies, USA). In order to determine compensation points, the in-let air concentration of methanol, acetaldehyde and acetone was varied between 0 and 12 ppbv. During ozone fumigation the background concentration of some oxygenated compounds (e.g. acetaldehyde, acetone) increased in the Teflon lines. The background in the glass cuvette was not impacted significantly. After the ozone source was turned
15
off, all VOCs concentrations quickly returned to the initial conditions. The VOC in-crease associated with the Teflon lines was small in comparison to the VOC inin-crease associated with a plant inside the glass cuvette during ozone fumigation. In addition, a difference measurement before and after the cuvette minimized any contribution as-sociated with Teflon tubing during the ozone fumigation. After each experiment the
20
needles were harvested for determination of their dry weight and/or leaf area. 2.2. Field site description and experimental details
The CELTIC (Chemical Emission, Loss, Transformation and Interaction within Canopies) experiment was conducted at Duke Forest C-H2O, an experimental loblolly pine plantation (average tree height 18 m) in North Carolina (35.98◦N, 79.09◦W). More
25
specific details can be found in Katul et al. (1999).The study began on 7 July and ended on 27 July 2003. Briefly, the gas phase measurement instrumentation was situated in a mobile trailer next to control ring (6) and a 24 m sampling tower. Above canopy air was
ACPD
5, 5875–5907, 2005 Exchange of oxygenated VOCs in the atmosphere T. Karl et al. Title Page Abstract Introduction Conclusions References Tables Figures J I J I Back Close Full Screen / EscPrint Version Interactive Discussion
EGU
drawn through a common 30 m (O.D. 3/800) Teflon line using a rotary pump and supplied two Proton-transfer-reaction mass spectrometers (PTR-MS)(Lindinger et al., 1998) re-sulting in a delay time of ∼5 s. In addition, one fast isoprene sensor (FIS) (Guenther and Hills, 1998) was deployed on the tower. All VOC instruments were deployed for mea-suring fluxes using either the eddy correlation or relaxed eddy accumulation method
5
as described by Baker et al. (2005)1. In addition, one of the PTR-MS instruments was deployed for within-canopy gradient measurements on 3 days of the study (17, 18 and 23 July). Micrometeorological measurements at ring 6 included turbulence measure-ments at 4 heights using the following sonic anemometers: RM Young 81000 (R.M. Young Company, USA) (16 m above ground) and ATI K-probe (Applied Technologies,
10
USA) (2, 8 and 26 m above ground). Meteorological data (UV, air temperature, pre-cipitation, net radiation, 2D winds) were collected during the whole campaign on top of the tower using a weather station (Vantage Pro2, Davis Instruments Corp., USA). Photolysis rates were measured on top of the tower and within the canopy at ring 6 us-ing a UV-B Biometer (Model 501, Solar Light Co., USA) and filter radiometers (Metcon
15
Inc., USA). PAR was measured using quantum sensors (Model LI-190SA, Li-Cor Inc., USA).
2.3. PTRMS
The PTRMS instrument has been described in detail elsewhere (Lindinger et al., 1998). Specifics on eddy covariance measurements can be found in Karl et al. (2002b and
20
2004) and for a detailed evaluation of the instrument we refer the reader to de Gouw et al. (2003a). The quantification of VOCs was based on gravimetrically prepared cal-ibration standards with an estimated uncertainty of approximately ±20%. Reference measurements for determining the instrument background were taken through a
cat-1
Baker, B., Jardine, K., Mielke, L., Arnts, R. R., and Karl, T.: Above canopy flux measure-ments of biogenic VOCs during the 2003 CELTIC experiment at Duke Forest North Carolina, in preparation, 2005.
ACPD
5, 5875–5907, 2005 Exchange of oxygenated VOCs in the atmosphere T. Karl et al. Title Page Abstract Introduction Conclusions References Tables Figures J I J I Back Close Full Screen / EscPrint Version Interactive Discussion
EGU
alytic converter (platinum wool held at 430◦C) and were performed every 30 min to 2 h. A description of the VOC flux and concentration measurements (Baker et al., 20051) during CELTIC will be presented elsewhere.
2.4. Gradient methodology
A VOC gradient system similar to that described by Karl et al. (2004) was deployed
5
during the CELTIC study. Air was pulled through a 30 m teflon line (O.D.=1/400) from the top of the sampling tower at a high flow rate (∼15 l/min), reducing the pressure inside the line to 400 mbar in order to avoid water condensation, minimize memory effects and assure a fast response time. The overall delay time was ∼6 s, measured by introducing an isoprene and acetone pulse at the top of the tower. The gradient
10
sampling inlet line was attached to a pulley controlled by an automated winch, and canopy air was sampled continuously from the ground to 24 m height. The canopy line moved at a constant speed of 0.2 m/s resulting in a complete profile about every 2 min.
Source/sink profiles were computed according to,
C− Cref =D↔ · S (1)
15
with C (concentration vector), Cref (concentration at reference height 24 m), D (dis-persion matrix and S (source/sink vector). Parameterization of the dis(dis-persion matrix (21 concentration layers and 5 source/sink layers) was based on measured turbulent profiles and estimated Lagrangian timescales as described by Karl et al. (2004). For more detailed information on inverse Lagrangian modeling we refer the reader to
Rau-20
pach (1989).
2.5. Footprint calculation
In order to estimate the footprint during day and night-time conditions we used a random walk model similar to the one described by Baldocchi (1997) and Strong et al. (2004), parameterized with turbulence measurements made during the CELTIC
ACPD
5, 5875–5907, 2005 Exchange of oxygenated VOCs in the atmosphere T. Karl et al. Title Page Abstract Introduction Conclusions References Tables Figures J I J I Back Close Full Screen / EscPrint Version Interactive Discussion
EGU
study. During daytime the mean horizontal distance traveled by an air mass was suf-ficiently short (∼130–150 m) that the measured VOC concentration in the canopy was dominated by emissions from the pine plantation. The surrounding oak forest had only a slight influence. During the night the prevalent wind direction originated from 300 degrees. The plantation extended 800 m in this upwind direction; compared to the
av-5
erage total distance traveled by the sampled air mass (∼620–650 m), this was sufficient to ensure that the sampled air originated within the plantation.
3. Results
3.1. Leaf level measurements
Leaf level measurements with potted plants performed in the NCAR laboratory were
10
used to examine the processes controlling canopy scale exchanges.
Methanol and Acetone
Over the examined concentration range (0–12 ppbv) both methanol and acetone
15
were predominantly emitted from both young and old loblolly pineneedles; i.e., the compensation point exceeded 12 ppbv. Emissions of both compounds exhibited an exponential temperature dependence between 20 and 40◦C. Table 1 summarizes the results for loblolly pine (4 leaf enclosure experiments, each lasting for 3–4 days) and compares leaf level and eddy covariance measurements. Based on a measured leaf
20
area index (LAI) in the plantation of 2.8 (Stroud et al., 2005) and a specific leaf weight (SLW) of 230 g m−2 (Geron et al., 2000) for loblolly pine the average emission rates (5.9 and 5.2×10⁻⁷g g−1h−1 for methanol and acetone, respectively) measured at standard conditions (30◦C, ∼1000 µmol m−2s−1 PAR) compare well with results from the eddy covariance measurements. This comparison also supports findings from
25
ACPD
5, 5875–5907, 2005 Exchange of oxygenated VOCs in the atmosphere T. Karl et al. Title Page Abstract Introduction Conclusions References Tables Figures J I J I Back Close Full Screen / EscPrint Version Interactive Discussion
EGU
methanol and acetone emissions and the loblolly pine leaf area index. A set of leaf level measurements with sweetgum (Liquidambar styraciflua) (Table 3) indicate that substantial amounts of methanol can be emitted from young leaves (e.g. 20 times higher emission compared to a more mature leaf) and that acetone is emitted from both young and old leaves. However, based on the biomass density (LAI: 30% of
5
total, SLW: 50 g m−2) methanol and acetone emissions from sweetgum contribute only slightly to observed above canopy fluxes at Duke Forest.
Acetaldehyde
10
In order to determine the exchange pattern of acetaldehyde we performed de-tailed compensation point measurements on needles of Pinus taeda, the results of which are listed in Tables 2 and 3. As an example, Fig. 1 illustrates the exchange of acetaldehyde plotted versus the concentration of outgoing air for young (left panels) and mature needles (right panels) before (top panels) and after (bottom panels)
15
fumigation with 120 ppb ozone. For young needles, the exchange of acetaldehyde showed an average daily compensation point of 7.1 ppb. The range of compensation points observed for mature needles ranged between 3.5 and 8.5 ppb (Table 2). This is comparable to values (6.2 ppb) reported by Cojocariu et al. (2004) for Norway Spruce (Picea abies). Maximum uptake was typically observed in the afternoon and
20
evening (15:00–22:00). While acetaldehyde bursts were observed after all light/dark transitions, no significant emission of compounds related to wounding (e.g. hexenals) were present during these transitional periods.
After several days of measurements using ozone free air, the same needles were fumigated with 100–150 ppb ozone for 2 h. An increase of acetaldehyde emissions
25
during ozone exposure was observed. For example, when the compensation point for acetaldehyde increased by as much as a factor of two, the emission rate when incoming air contained zero ppbv acetaldehyde (E0) increased by almost a factor of ten. After ozone treatment the wound VOC emissions declined rapidly. During the
ACPD
5, 5875–5907, 2005 Exchange of oxygenated VOCs in the atmosphere T. Karl et al. Title Page Abstract Introduction Conclusions References Tables Figures J I J I Back Close Full Screen / EscPrint Version Interactive Discussion
EGU
days following ozone fumigation we observed decreased emissions of acetaldehyde. With the exception of young needles, the post-fumigation compensation point returned close to the original value (no change in the total enzyme amount); however the slope (enzyme activity) typically changed to half of the original level. These observations suggest that ozone damages key enzymes responsible for the production of
ac-5
etaldehyde. While the slope of the compensation point measurement did not change significantly for acetaldehyde, the compensation point itself followed an exponential temperature dependence (Table 2).
Other Oxygenated VOCs observed during ozone fumigation
10
During ozone fumigation we observed an increase in the amount of oxygenated VOCs in air exiting the chamber, similar to observations published by Wildt et al. (2003). Two setups were used to assess the difference between primary (ozone reacting on plant surfaces) and secondary (alkene plus ozone type reactions with
15
primary emissions (e.g. sesquiterpenes)) production of these oxygenated compounds. In the first case ozone was added immediately before the plant cuvette. The mixing time was measured to be on the order of ∼25–30 s. In the second case ozone was added to the effluent of the plant cuvette and passed through a glass mixing vessel so that the total residence time (∼25–30 s) roughly matched the residence time in
20
the plant cuvette. Blanks showed that artifact formation on glass surfaces during the addition of ozone were minimal. While an ozone induced increase of terpene emissions can not be excluded on longer timescales (hours), our measurements of post-exposure emissions immediately after the fumigation indicated that the total amount of terpenes and sesquiterpenes did not change significantly within the time
25
scale of a few minutes.
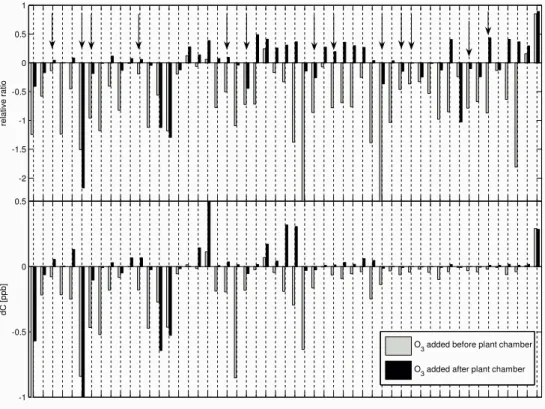
As an example Fig. 2 shows the relative (upper panel) and absolute (lower panel) concentration difference of mass spectra observed by the PTR-MS instrument before and during the addition of 200 ppb ozone (∼15 min exposure time). Qualitatively similar
ACPD
5, 5875–5907, 2005 Exchange of oxygenated VOCs in the atmosphere T. Karl et al. Title Page Abstract Introduction Conclusions References Tables Figures J I J I Back Close Full Screen / EscPrint Version Interactive Discussion
EGU
results were obtained at 50–80 ppb ozone concentrations. For simplicity only odd m/z ratios above 100 amu are shown. Positive values indicate reactive losses. For example more than 80% (relative ratio >0.8) of the reactive sesquiterpenes (m/z 205) (domi-nated by β-caryophyllene as inferred from parallel GC-FID measurements) were oxi-dized within the mixing time of the chamber. Negative values represent the production
5
of compounds during the addition of ozone. In particular ions corresponding to a series of C9−C13 aldehydes and unsaturated alcohols (m/z 125 and 143, m/z 139 and 157, m/z 153 and 171, m/z 167 and 185 and m/z 181 and 199) and compounds exhibiting ions 2 amus higher (e.g. saturated alcohols) were dramatically enhanced when ozone was added directly to the plant (Fig. 2, dark bars). Many of these aldehydes and
alco-10
hols are known to be linked to wounding and plant damage through lipoxygenase type reactions that are also responsible for the so-called “green odor” of plants (Hatanaka, 1996; Fall, 1999; Wildt et al., 2003). Some others could correspond to compounds that have been identified during ozonolysis at vegetation surfaces (e.g. m/z 127: 6-methyl-5-hepten-2-one and m/z 195: geranyl acetone) (Fruekilde et al., 1998). When ozone
15
was added to the effluent of the plant chamber the biggest changes were observed on ions exhibiting m/z 111 and 129, and m/z 127 and 145 due to secondary gas phase formation from reactive plant emissions (e.g. terpenes). These ions most likely corre-spond to ketones, ketoaldehdyes and aldehydes that have tentatively been identified from the oxidation of terpenoids (Calogirou et al., 1999).
20
The timescales of mixing in these laboratory experiments (∼30 s) are somewhat lower than typical turbulent time scales (60–120 s) in a ∼6 m tall canopy; however, they are within the range of chemical lifetimes of very reactive terpenes. The arrows in Fig. 2 indicate compounds that have previously been assigned to secondary species formed due to reactions of ozone with very reactive compounds (Holzinger et al., 2004).
25
Our measurements imply that with the exception of m/z 111+, 127+, 129+, 143+ and 145+the bulk of these compounds are likely the result of direct reactions of ozone with plant surfaces (comparison of negative ratios in Fig. 2). While results shown in Figure 2 were obtained with loblolly pine similar results were found for ponderosa pine (Pinus
ACPD
5, 5875–5907, 2005 Exchange of oxygenated VOCs in the atmosphere T. Karl et al. Title Page Abstract Introduction Conclusions References Tables Figures J I J I Back Close Full Screen / EscPrint Version Interactive Discussion
EGU ponderosa).
3.2. Canopy Scale measurements
Eddy covariance Measurements
A more detailed analysis of VOC flux measurements will be presented
else-5
where (Baker et al., 20051). Results obtained from eddy covariance measurements of methanol and acetone agreed within the variability of the gradient measurements (Table 4) during the day and generally showed a diurnal cycle. The emission of both compounds correlate with latent and sensible heat fluxes (Baker et al., 20051). Eddy covariance data for acetaldehyde are more ambiguous due to the complex
10
exchange pattern of this compound and some instrumental problems associated with one PTR-MS instrument that was used for DEC measurements. The gradient data (next section) suggest acetaldehyde loss in the canopy and emission during certain transitional morning and evening hours.
15
Gradient Measurement
Source and sink profiles are calculated according to Eq. (1) and expressed as an exchange velocity (ev), which we define as the flux (Fc) divided by the mean concentration (C) in each layer (ev: =Fc/C). Figure 3 shows a plot of these profiles as
20
a function of height for mean daytime (10 to 17 h) and night-time conditions (22 to 5 h). Negative values indicate uptake and positive values indicate emission. The night-time inversion was assumed to lie between 12 and 15 m (canopy top). The reference height (zref) for the inverse calculation during night was averaged over this interval. Errors associated with these profiles were estimated to be on the order of ±30%, based on a
25
comparison of different inverse schemes (Karl et al., 2004). Fluxes as well as average exchange velocities are summarized in Table 4. The mean daytime flux obtained from the gradient method compares well to fluxes calculated from the eddy covariance
ACPD
5, 5875–5907, 2005 Exchange of oxygenated VOCs in the atmosphere T. Karl et al. Title Page Abstract Introduction Conclusions References Tables Figures J I J I Back Close Full Screen / EscPrint Version Interactive Discussion
EGU
method (Baker et al., 20051). Results from both flux measurement methods are listed in Table 4.
Methanol and Acetone (Fig. 3 panels A and B)
5
During the day, methanol is predominantly emitted from loblolly pine and mostly deposited in the lower part of the canopy and to the ground (Fig. 3, panels A and B). The mean daytime flux inferred from the ILT technique was 0.52 mg m−2h−1 (mean temperature: 27.3◦C, mean radiation 1466 µmol m−2s−1 PAR) . Within the variability this agrees with results from the EC measurements of 0.32 mg m−2h−1. At night there
10
is significant MeOH uptake, similar to what was observed above a tropical ecosystem (Karl et al., 2004). The net exchange velocity (integral over the canopy height) was as high as −0.96 cm/s and was ∼33% of that estimated for a tropical rain forest (−2.9 cm s−1) in Costa Rica. The mean night-time exchange velocity (ev) (Table 4) was −0.30 cm s−1. The exchange velocity in the lowest layer (soil) during the day,
15
which includes the forest floor, was −0.14 cm s−1. For comparison the aerodynamic limit for night-time deposition velocities was measured to be on the order of 1 to 2 cm s−1. The upper limit of the dry deposition velocity for methanol and acetone calculated according to Wesely (1989) would be on the order of ∼0.02 cm s−1. The acetone emission profile indicates that the loblolly pine stand was the main source,
20
which was verified by plant enclosure measurements. During the night the exchange velocities suggest mostly deposition. The deposition is smaller than that of methanol, although still significant with a total net exchange velocity of −0.46 cm s−1 and a mean night-time exchange velocity of −0.11 cm s−1comparable to our results above a tropical rain forest.
25
Methanol and acetone are lost in the lower canopy during daytime, in contrast to leaf level measurements which demonstrated that both compounds can potentially be emitted from sweetgum (Liquidambar styraciflua). This indicates that the lower part of the canopy acts as a sink rather than a source of these compounds implying additional
ACPD
5, 5875–5907, 2005 Exchange of oxygenated VOCs in the atmosphere T. Karl et al. Title Page Abstract Introduction Conclusions References Tables Figures J I J I Back Close Full Screen / EscPrint Version Interactive Discussion
EGU
loss processes such as dry deposition.
Acetaldehyde, Acetic Acid, MVK+MAC and m/z 73 (Fig. 3 panels C, D, E and F)
The daytime emission profile for acetaldehyde (Fig. 3, panel C) suggests mostly
5
deposition to the canopy. The exchange velocity at the highest level is positive and could indicate enhanced photochemical production in the surface layer. The mean exchange velocity and the net exchange velocity during the day were −0.46 cm s−1and −2.3 cm s−1, respectively. While previous canopy scale measurements at forested sites (Schade and Goldstein, 2001; Karl et al., 2003, 2004) showed emissions during
10
daytime, measurements at Duke Forest suggest mostly uptake by the loblolly pine stand. The highest uptake rates correspond to the peak of the loblolly pine leaf area index (Fig. 3, Table 4). This is in contrast to our leaf level emission measurements which indicate compensation points (2–8 ppb) well above ambient concentrations (0.86 ppb) observed during the CELTIC experiment. The reason for this discrepancy is
15
not entirely clear but could be due to the fact that potted plants grown in a greenhouse have altered their biochemical production pathways leading to an increased emission of acetaldehyde (e.g. low light levels or anaerobic conditions due to a densely crowded root system in potted plants). Another possibility would be that processes on the canopy scale (e.g. such as dry deposition) could have increased the loss under field
20
conditions.
We have previously concluded that m/z 61+above forested sites corresponds mostly to acetic acid with minor contributions from glycolaldehyde (Karl et al., 2004). Thus, we argue that acetic acid (Fig. 3, panels E and F) is mostly deposited throughout the canopy during day and night similar to observations in other ecosystems (Kuhn
25
et al., 2002; Sanhueza et al., 1989). We inferred mean and net exchange velocities of −0.68 cm s−1 and −3.14 cm s−1 during the day and −0.33 cm s−1 and −1.3 cm s−1 during the night, respectively. The exchange velocities close to the ground were small. The 1st generation oxidation products (MVK+MAC) of isoprene chemistry are mostly
ACPD
5, 5875–5907, 2005 Exchange of oxygenated VOCs in the atmosphere T. Karl et al. Title Page Abstract Introduction Conclusions References Tables Figures J I J I Back Close Full Screen / EscPrint Version Interactive Discussion
EGU
deposited during both the day (net ev: −0.33 cm s−1) and night (net ev: −2.4 cm s−1). A slightly positive exchange velocity (Fig. 3, panel E) at the top of the canopy could be caused by higher photochemical production above the canopy during the day, similar to acetaldehyde.
Using the PTR-MS instrument, ions observed at m/z 73+ have tentatively been
as-5
signed to C4 and C3 carbonyls such as methyl ethyl ketone and methyl-glyoxal (de Gouw et al., 2003b). Under conditions of low collisional energies and high humidity the third water cluster ((H2O)3H3O+) could also interfere at m/z 73+. Reference measure-ments through a conditioned catalytical converter however can be used to characterize this interference, since water is not removed by the converter. Under the operating
10
conditions used during the CELTIC study most of the water cluster was fragmented and we conclude that the abundance on m/z 73+ was most likely caused by carbonyls. This is supported by gradient measurements depicted in Fig. 3 (panels E and F), which show a source at the canopy top and in the middle of the canopy during daytime; the ground acts as a sink. If the water cluster contributed a significant part of the signal at
15
m/z 73+, positive exchange velocities would be expected throughout the canopy and negative or smaller exchange velocities would be expected at the canopy top due to a positive daytime latent heat flux. The overall exchange pattern indicates both biogenic and possibly atmospheric sources for compounds exhibiting m/z 73+.
For all compounds the dry deposition velocities calculated according to Wesely
20
(1989) would be lower in the range of 0.27 (acetaldehyde) to 0.65 (acetic acid) cm s−1 during the day and 0.02 (acetaldehyde) to 0.13 (acetic acid) cm s−1 during the night.
4. Discussion
Methanol and acetone dominated the emission of oxygenated compounds during the CELTIC field experiment. While acetone emissions did not show a
systemati-25
cally different pattern between young and old needles, methanol emissions were en-hanced in young needles supporting findings from previous studies (Fall and
Ben-ACPD
5, 5875–5907, 2005 Exchange of oxygenated VOCs in the atmosphere T. Karl et al. Title Page Abstract Introduction Conclusions References Tables Figures J I J I Back Close Full Screen / EscPrint Version Interactive Discussion
EGU
son, 1996). Measurements conducted on sweetgum showed an up to a 20 fold increase in the methanol flux compared to the flux from young leaves. The fact that the gradient measurements showed uptake of these compounds in the lower canopy, where most of the sweetgum (Liquidambar styraciflua) biomass density was located, suggests that dry deposition to surfaces could be important for the exchange
5
of these compounds. Short time ozone fumigation with ∼150 ppb of ozone for ∼2 h had no detectable effect on the “post-exposure” emissions of methanol and ace-tone. Overall the magnitude of methanol (0.3–0.5 mg m−2h−1) and acetone emis-sions (0.11–0.37 mg m−2h−1) are comparable to those found in similar ecosystems. Schade and Goldstein (2001) for example reported typical daytime fluxes (T=25◦C) of
10
∼4.4 mg m−2h−1 and ∼0.35 mg m−2h−1 for methanol and acetone above a ponderosa pine (Pinus ponderosa) plantation. Assuming an LAI of 3–4 m2m−2 the acetone flux from a Norway spruce (Picea abies) canopy published by Cojocariu et al. (2004) would equate to 0.4–0.5 mg m−2h−1. Methanol and acetone fluxes (T=18◦C) above a sub-alpine ecosystem consisting mostly of lodgepole pine (Pinus contorta) were on the
15
order of 1.0 mg m−2h−1 and 0.5 mg m−2h−1(Karl et al., 2002b).
Field measurements in the past indicated that acetic acid is mostly deposited to the vegetation (e.g. Kesselmeier et al., 1998; Kuhn et al., 2002; Sanhueza et al., 1989; Staudt et al., 2000; Karl et al., 2004). Daytime deposition values during this study (net ev: −3.14 cm s−1) are higher than recent results obtained above a tropical forest
20
(net ev: −1.9 cm s−1) in Costa Rica, but are within the range observed above other ecosystems. For example Kuhn et al. (2002) measured leaf level uptake rates up to 0.6 nmol m−2s−1 for a tropical species at a mixing ratio of 2.5 ppb. Assuming a leaf area index of 6 m2m−2, this could result in deposition velocities as high as −3.5 cm s−1. Compared to measurements above a rainforest (mean daytime concentration: ∼1 ppb)
25
(Karl et al., 2004), the South Eastern US is more polluted with a mean acetic acid concentration on the order of ∼3.5 ppb. High deposition could be caused by a compen-sation point driven uptake, which would be expected to be higher under more polluted conditions. On the other hand night-time uptake is also significant, suggesting that
ACPD
5, 5875–5907, 2005 Exchange of oxygenated VOCs in the atmosphere T. Karl et al. Title Page Abstract Introduction Conclusions References Tables Figures J I J I Back Close Full Screen / EscPrint Version Interactive Discussion
EGU
other processes leading to the loss of acetic acid might be important. While daytime de-position of MVK+MAC (−0.33 cm s−1) is significant and comparable to measurements obtained above a tropical rain forest in Costa Rica (net ev: −0.4 cm s−1), it is roughly a factor of ten lower than values reported above a tropical rain forest in Amaz ˆonia using the relaxed eddy accumulation technique (Andreae et al., 2002). For all oxygenated
5
VOCs investigated during this study, the night-time deposition velocity was substantially greater than the daytime deposition velocity.
Leaf level experiments showed that acetaldehyde emissions followed a temperature driven compensation point, which has also been observed above different ecosystems (Cojocariu et al., 2004; Rottenberger et al., 2004). This implies that the temperature
10
dependence of canopy scale VOC fluxes should only be applied to a temperature range that was measured during a particular study. Extrapolation to higher temperatures would need to include the effect of a compensation point and other factors such as transpiration rates. Otherwise the overall emissions would at best be guesstimates. In these cases a relationship between VOC fluxes with sensible or latent heat fluxes
15
might be more accurate for upscaling purposes as it includes physiologically driven variables (such as transpiration). Inappropriate upscaling of biogenic OVOC emissions could explain part of the variability between different studies summarized by Singh et al. (2004).
Acetaldehyde bursts after light/dark transitions were typically not accompanied by
20
wound VOCs from the C6 and C9 carbonyl families for loblolly pine trees. Two expla-nations come to mind: (1) sufficient ethanol produced in stems of these pine trees was transported to the needles during daytime leading to a substantially increased produc-tion of acetaldehyde compared to e.g. deciduous trees, (2) the recently hypothesized link between wound VOCs and acetaldehyde (Graus et al., 2004) does not manifest
25
itself in the loblolly pine (Pinus taeda) trees investigated in this study. A recent study investigated the effect of elevated ozone concentrations on acetaldehyde emissions from beech (Fagus sylvatica) (Cojocariu et al., 2005). A significant increase in the ac-etaldehyde exchange rates was observed at 120 ppb ozone, similar to results obtained
ACPD
5, 5875–5907, 2005 Exchange of oxygenated VOCs in the atmosphere T. Karl et al. Title Page Abstract Introduction Conclusions References Tables Figures J I J I Back Close Full Screen / EscPrint Version Interactive Discussion
EGU
during this study. In addition our experiments show that even though no physiologically significant changes were obvious, the exchange rates of acetaldehyde were system-atically lower on the days following 2 h of ozone fumigation. This argues that damage to enzymes responsible for acetaldehyde metabolism might have already occurred at ozone concentrations in the 100–150 ppb range.
5
The addition of ozone triggered the release of compounds commonly attributed to the oxidation of fatty acids. In addition ions exhibited m/z ratios that would correspond to oxygenated VOCs identified from ozonolysis at vegetation surfaces such as acetone, 6-methyl-5-hepten-2-one and geranyl acetone (Fruekilde et al., 1998). Wildt et al. (2003) reported the presence of C6–C10aldehydes after ozone fumigation; our measurements
10
show mass spectral evidence of the presence of aldehydes over the entire C1–C13 range.
Ions corresponding to the oxygenated VOC categories (OX1–OX12) reported by Holzinger et al. (2004) were also detected and to some extent overlapped with com-pounds associated with ozonolysis on plant surfaces. Addition of ozone before and
af-15
ter of the plant cuvette suggested that a substantial amount of the OX1–OX12 species originated from the reaction of ozone on plant surfaces rather than formation in the air after the release of reactive terpenes (e.g. beta caryophellene). Our observations also indicate that certain ions (e.g. m/z 111+ 127+, 129+ and 143+) are produced pre-dominantly from the gas phase oxidation of reactive terpenes (e.g. sesquiterpenes) as
20
hypothesized by Holzinger et al. (2004). Future experiments will be needed to quantify the magnitude of each of these sources.
5. Conclusion
We observed significant emissions of methanol and acetone from a loblolly pine
(Pi-nus taeda) plantation with sweetgum (Liquidambar styraciflua) understory during the
25
CELTIC field experiment. Leaf level measurements supported these findings and were in reasonable agreement with canopy scale fluxes calculated from an Inverse
ACPD
5, 5875–5907, 2005 Exchange of oxygenated VOCs in the atmosphere T. Karl et al. Title Page Abstract Introduction Conclusions References Tables Figures J I J I Back Close Full Screen / EscPrint Version Interactive Discussion
EGU
Lagrangian Transport scheme. In summary our measurements support similar find-ings for emissions of these compounds from previous studies above other ecosystems (Schade and Goldstein, 2001; Kesselmeier and Staudt, 1999; Cojocariu et al., 2004).
The exchange of acetaldehyde exhibited a temperature dependent compensation point. While for some experiments conducted with sweetgum, the emission of
acetalde-5
hyde and wound induced compounds were both enhanced after light/dark transitions, we did not see a correlation of these compounds for loblolly pine. These observations could indicate sufficient ethanol transport from stems in loblolly pine trees during the day or argue against a link between processes leading to the emission of these com-pounds as hypothesized by Graus et al. (2004). Leaf level measurements of
acetalde-10
hyde showed compensation points (>2.2 ppb) comparable to a recent study with spruce (Picea abies) needles (Cojocariu et al., 2004). Canopy scale gradient measurements on the other hand showed mostly uptake suggesting much lower compensation points (<0.9 ppb). Two reasons could explain this discrepancy: (1) plants grown under lab-oratory conditions have altered their biochemical pathways compared to those grown
15
under field conditions, or (2) dry deposition to surfaces plays an important role under field conditions. Observations by Cojocariu et al. (2004) indicated that leaf level mea-surements under field and laboratory conditions showed similar compensation points for spruce trees and would argue for the latter. Combined canopy and branch scale experiments under field conditions will be needed to resolve the discrepancy observed
20
during the CELTIC experiment.
Significant uptake of MVK+MAC and acetic acid during daytime indicates that photo-chemical production dominates. All oxygenated compounds exhibited a strong noctur-nal loss, and the deposition velocities were much greater than assumed from traditionoctur-nal deposition schemes. Together with findings from previous studies this argues that our
25
understanding of deposition is still limited and that the loss of oxygenated compounds is larger than assumed in current models.
Ozone fumigation experiments demonstrated that a wide range of oxygenated com-pounds in the higher mass range (>100 amu), such as saturated and unsaturated
alde-ACPD
5, 5875–5907, 2005 Exchange of oxygenated VOCs in the atmosphere T. Karl et al. Title Page Abstract Introduction Conclusions References Tables Figures J I J I Back Close Full Screen / EscPrint Version Interactive Discussion
EGU
hydes and alcohols, can be produced from plants. Some of these compounds have re-cently (Holzinger et al., 2004) been observed at a ponderosa pine (Pinus ponderosa) plantation and were attributed to gas-phase ozone chemistry of very reactive terpenes in the atmosphere. Our experiments suggest that ozone reactions on waxy leaf sur-faces can also lead to the production of these or similar compounds.
5
These oxygenated species likely have multiple sources in a canopy (ozone-plant induced production and atmospheric reactions), which need to be taken into account when calculating potential yields of very reactive compounds. The hypothesized large emission potential of very reactive terpenes (Holzinger et al., 2004) might therefore be an upper limit. While the presence of very reactive terpenes (Went, 1960) has long
10
been recognized the quantification remains a challenge. The ozone induced production of biogenic oxygenated compounds might increase due to the expected higher ozone levels in the future and might enhance the biogenic contribution to secondary organic aerosol formation.
Acknowledgements. The Duke Forest field study was supported by the Office of Science
15
(BER), US Department of Energy, Grant No. DE-FG02-95ER62083. The authors also thank staff at the Duke FACE site for their assistance and support. This work was also funded by EPA. We thank C. Geron as project officer. We also thank J. Fuentes for helpful discussions. The National Center for Atmospheric Research is sponsored by the National Science Founda-tion.
20
Appendix A
Random walk model
A Matlab code (Mathworks Inc.) was written in order to model the random forcing term (dw) for the one-dimensional case according to the Fokker-Planck equation (e.g. Eq. (4)
ACPD
5, 5875–5907, 2005 Exchange of oxygenated VOCs in the atmosphere T. Karl et al. Title Page Abstract Introduction Conclusions References Tables Figures J I J I Back Close Full Screen / EscPrint Version Interactive Discussion EGU in Baldocchi, 1997): d w = −wL TL + 1 2 " 1+w 2 L σw2 # ∂σw2 ∂z ! d t+ s 2σw2 TL dr, (A1)
with wL(Lagrangian vertical velocity), TL (Lagrangian timescale), σw (standard devia-tion of vertical wind component), dr (random forcing).
The trajectories for 5000 particles were released at 4 levels (25%, 50%, 75% and
5
100% of canopy) and computed for typical day and night-time conditions. The mean residence time and horizontal distance traveled by the ensemble mean was used to assess the footprint in each layer and over the whole canopy (sum over 4 levels).
References
Andreae, M. O., Artaxo, P., Brandao, C., Carswell, F. E., Ciccioli, P., da Costa, A. L., Culf,
10
A. D., Esteves, J. L., Gash, J. H. C., and Grace, J.: Biogeochemical cycling of carbon, water, energy, trace gases, and aerosols in Amazonia: The LBA-EUSTACH experiments, J. Geophys. Res., 107 (Part 20 Part 20), LBA 33, doi:10 1029/2001JD000524, 2002.
Baldocchi, D.: Flux footprints within and over forest canopies, Boundary-Layer Meteorology, 85 (2), 273–292, 1997.
15
Calogirou, A., Larsen, B., and Kotzias, D.: Gas-phase terpene oxidation products: a review, Atmos. Environ., 33, 1423–1439, 1999.
Cojocariu, C., Escher, P., Haberle, K. H., Matyssek, R., Rennenberg, H., and Kreuzwieser, J.: The effect of ozone on the emission of carbonyls from leaves of adult Fagus sylvatica, Plant Cell and Environment, 28 (5), 603–611, 2005.
20
Cojocariu, C., Kreuzwieser, J., and Rennenberg, H.: Correlation of short-chained carbonyls emitted from Picea abies with physiological and environmental parameters, New Phytologist, 162, 717–727, 2004.
de Gouw, J., Warneke, C., Karl, T., Eerdekens, G., van der Veen, C., and Fall, R.: Sensitivity and specificity of atmospheric trace gas detection by proton-transfer-reaction mass spectrometry,
25
ACPD
5, 5875–5907, 2005 Exchange of oxygenated VOCs in the atmosphere T. Karl et al. Title Page Abstract Introduction Conclusions References Tables Figures J I J I Back Close Full Screen / EscPrint Version Interactive Discussion
EGU
de Gouw, J. A., Goldan, P. D., Warneke, C., Kuster, W. C., Roberts, J. M., Marchewka, M., Bert-man, S. B., Pszenny, A. A. P., and Keene, W. C.: Validation of proton transfer reaction-mass spectrometry (PTR-MS) measurements of gas-phase organic compounds in the atmosphere during the New England Air Quality Study (NEAQS) in 2002, J. Geophys. Res.-A, 108 (D21), doi:10.1029/2003JD003863, 2003b.
5
Fall, R.: Biogenic emissions of volatile organic compounds from higher plants, in: Reactive hydrocarbons in the atmosphere, edited by: Hewitt, C. N., Academic Press, New York, 41– 96, 1999.
Fall, R.: Abundant oxygenates in the atmosphere: A biochemical perspective, Chemical Re-views, 103, 4941–4951, 2003.
10
Fall, R. and Benson, A.: Leaf methanol – the simplest natural product from plants, Trends Plant Sci., 1, 296–301, 1996.
Fall, R., Karl, T., Hansel, A., Jordan, A., and Lindinger, W.: Volatile organic compounds emit-ted after leaf wounding: On-line analysis by proton-transfer-reaction mass spectrometry, J. Geophys. Res.-A, 104 (D13), 15 963–15 974, 1999.
15
Farquhar, G. D., Caemmerer, S. V., and Berry, J. A.: A Biochemical-Model of Photosynthetic Co2 Assimilation in Leaves of C-3 Species, Planta, 149 (1), 78–90, 1980.
Fruekilde, P., Hjorth, J., Jensen, N. R., Kotzias, D., and Larsen, B.: Ozonolysis at vegetation surfaces: A source of acetone, 4-oxopentanal, 6-methyl-5-hepten-2-one and geranyl ace-tone, Atmos. Environ., 32 (11), 1893–1902, 1998.
20
Galbally, I. E. and Kirstine, W.: The Production of Methanol by Flowering Plants and the Global Cycle of Methanol, J. Atmos. Chem., 43 (3), 35, 195–229, 2002.
Geron, C., Rasmussen, R., Arnts, R. R., and Guenther, A.: A review and synthesis of monoter-pene speciation from forests in the United States, Atmos. Environ., 34 (11), 1761–1781, 2000.
25
Graus, M., Schnitzler, J. P., Hansel, A., Cojocariu, C., Rennenberg, H., Wisthaler, A., and Kreuzwieser, J.: Transient release of oxygenated volatile organic compounds during light-dark transitions in grey poplar leaves, Plant Physiology, 135 (4), 1967–1975, 2004.
Guenther, A., Hewitt, C. N., Erickson, D., and Fall, R.: A global model of natural volatile organic compound emissions, J. Geophys. Res., 100 (D/5), 8873–8892, 1995.
30
Guenther, A. B. and Hills, A. J.: Eddy covariance measurement of isoprene fluxes, J. Geophys. Res., 103 (D11), 13 145–13 150, 1998.
ACPD
5, 5875–5907, 2005 Exchange of oxygenated VOCs in the atmosphere T. Karl et al. Title Page Abstract Introduction Conclusions References Tables Figures J I J I Back Close Full Screen / EscPrint Version Interactive Discussion
EGU
303–350, 1996.
Heikes, B. G., Chang, W. N., Pilson, M. E. Q., Swift, E., Singh, H. B., Guenther, A., Jacob, D. J., Field, B. D., Fall, R., Riemer, D., and Brand, L.: Atmospheric methanol budget and ocean implication, Global Biogeochemical Cycles, 16 (4), art. no.-1133, 2002.
Holzinger, R., Lee, A., Paw, U. K. T., and Goldstein, A. H.: Observations of oxidation products
5
above a forest imply biogenic emissions of very reactive compounds, Atmos. Chem. Phys., 5, 67–75, 2005,SRef-ID: 1680-7324/acp/2005-5-67.
Jacob, D. J., Field, B. D., Jin, E. M., Bey, I., Li, Q., Logan, J. A., Yantosca, R. M., and Singh, H. B.: Atmospheric budget of acetone, J. Geophys. Res., 107 (Part 9/10 Part 9/10), ACH 5, Art. No. 4100, doi:10 1029/2001JD000694, 2002.
10
Janson, R., De Serves, C., and Romero, R., Emission of isoprene and carbonyl compounds from a boreal forest and wetland in Sweden, Agricultural and Forest Meteorology, 98-9, 671– 681, 1999.
Karl, T., Curtis, A. J., Rosenstiel, T. N., Monson, R., and Fall, R.: Transient releases of ac-etaldehyde from tree leaves – products of a pyruvate overflow mechanism?, Plant Cell and
15
Environment, 25, 1121–1131, 2002a.
Karl, T., Guenther, A., Spirig, C., Hansel, A., and Fall, R.: Seasonal variation of biogenic VOC emissions above a mixed hardwood forest in northern Michigan, Geophys. Res. Lett., 30 (23), 2186, Art. No. 2186, 2003.
Karl, T., Harren, F. J. M., Warneke, C., de Gouw, J., Grayless, C., and Fall, R.: Senescing grass
20
crops as regional sources of reactive VOCs, J. Geophys. Res.-A, in press, 2005.
Karl, T., Potosnak, M., Guenther, A., Clark, D., Walker, J., Herrick, J. D., and Geron, C.: Ex-change processes of volatile organic compounds above a tropical rain forest: Implications for modeling tropospheric chemistry above dense vegetation, J. Geophys. Res.-A, 109 (D18), Art. No. D18306, 2004.
25
Karl, T. G., Spirig, C., Rinne, J., Stroud, C., Prevost, P., Greenberg, J., Fall, R., and Guen-ther, A.: Virtual disjunct eddy covariance measurements of organic compound fluxes from a subalpine forest using proton transfer reaction mass spectrometry, Atmos. Chem. Phys., 2, 279–291, 2002b,SRef-ID: 1680-7324/acp/2002-2-279.
Katul, G., Hsieh, C. I., Bowling, D., Clark, K., Shurpali, N., Turnipseed, A., Albertson, J., Tu,
30
K., Hollinger, D., Evans, B., Offerle, B., Anderson, D., Ellsworth, D., Vogel, C., and Oren, R.: Spatial variability of turbulent fluxes in the roughness sublayer of an even-aged pine forest, Boundary-Layer Meteorology, 93 (1), 1–28, 1999.
ACPD
5, 5875–5907, 2005 Exchange of oxygenated VOCs in the atmosphere T. Karl et al. Title Page Abstract Introduction Conclusions References Tables Figures J I J I Back Close Full Screen / EscPrint Version Interactive Discussion
EGU
Kesselmeier, J.: Exchange of short-chain oxygenated volatile organic compounds (VOCs) be-tween plants and the atmosphere: A compilation of field and laboratory studies, J. Atmos. Chem., 39 (3), 219–233, 2001.
Kesselmeier, J., Bode, K., Gerlach, C., and Jork, E. M.: Exchange of atmospheric formic and acetic acids with trees and crop plants under controlled chamber and purified air conditions,
5
Atmos. Environ., 32 (10), 1765–1775, 1998.
Kesselmeier, J. and Staudt, M.: Biogenic volatile organic compounds (VOC): An overview on emission, physiology and ecology, J. Atmos. Chem., 33 (1), 23–88, 1999.
Kreuzwieser, J., Kuhnemann, F., Martis, A., Rennenberg, H., and Urban, W.: Diurnal pattern of acetaldehyde emission by flooded poplar trees, Physiologia Plantarum, 108 (1), 79–86,
10
2000.
Kuhn, U., Rottenberger, S., Biesenthal, T., Ammann, C., Wolf, A., Schebeske, G., Oliva, S. T., Tavares, T. M., and Kesselmeier, J.: Exchange of short-chain monocarboxylic acids by veg-etation at a remote tropical forest site in Amazonia, J. Geophys. Res.-A, 107 (D20), Art. No. 8069, 2002.
15
Lindinger, W., Jordan, A., and Hansel, A.: Proton-transfer-reaction mass spectroscopy (PTR-MS): on-line monitoring of volatile organic compounds at pptv levels, Chem. Soc. Rev., 27, 347–534, 1998.
Niinemets, U., Loreto, F., and Reichstein, M.: Physiological and physicochemical controls on foliar volatile organic compound emissions, Trends in Plant Science, 9 (4), 180–186, 2004.
20
Raupach, M. R.: Applying Lagrangian fluid mechanics to infer scalar source distributions from concentration profiles in plant canopies, Agricultural and Forest Meteorology 47 (2–4), 85– 108, 1989.
Rottenberger, S., Kuhn, U., Wolf, A., Schebeske, G., Oliva, S. T., Tavares, T. M., and Kesselmeier, J.: Exchange of short-chain aldehydes between Amazonian vegetation and
25
the atmosphere, Ecological Applications, 14 (4), 247–262, 2004.
Sanhueza, E., Donoso, L., Scharffe, D., and Crutzen, P. J.: Organic and inorganic acids in rain from a remote site of the Venzuelan savannah, Tellus, 41B, 170–176, 1989.
Schade, G. W. and Custer, T. G.: OVOC emissions from agricultural soil in northern Germany during the 2003 European heat wave, Atmos. Environ., 38 (36), 6105–6114, 2004.
30
Schade, G. W., and Goldstein, A. H.: Fluxes of oxygenated volatile organic compounds from a ponderosa pine plantation, J. Geophys. Res.-A, 106 (D3), 3111–3123, 2001.
ACPD
5, 5875–5907, 2005 Exchange of oxygenated VOCs in the atmosphere T. Karl et al. Title Page Abstract Introduction Conclusions References Tables Figures J I J I Back Close Full Screen / EscPrint Version Interactive Discussion
EGU
volatile organic compounds from ponderosa pine trees, J. Geophys. Res., 107 (Part 9/10 Part 9/10), ACH 2, Art. No. 4082, doi:10 1029/2001JD000532, 2002.
Singh, H. B., Salas, L. J., Chatfield, R. B., Czech, E., Fried, A., Walega, J., Evans, M. J., Field, B. D., Jacob, D. J., Blake, D., Heikes, B., Talbot, R., Sachse, G., Crawford, J. H., Avery, M. A., Sandholm, S., and Fuelberg, H.: Analysis of the atmospheric distribution, sources,
5
and sinksof oxygenated volatile organic chemicals based on measurements over the Pa-cific during TRACE-P, J. Geophys. Res., 109, Art. No. D15S07, doi:10.1029/2003JD003883, 2004.
Staudt, M., Wolf, A., and Kesselmeier, J.: Influence of environmental factors on the emissions of gaseous formic and acetic acids from orange (Citrus sinensis L.) foliage, Biogeochemistry,
10
48 (2), 199–216, 2000.
Steinbrecher, J. and Rabong, R.: Emission of terpenoids and C2–C6 hydrocarbons by Norway spruce: phytotron experiment and field studies, edited by: Borrell, P., Borrell, P. M., and Seiler, W.: Proceedings of EUROTRAC Symposium ’94 The Hague, The Netherlands: SPB Academic Publishing, 502–505, 1994.
15
Strong, C., Fuentes, J. D., and Baldocchi, D.: Reactive hydrocarbon flux footprints during canopy senescence, Agricultural and Forest Meteorology, 127 (3–4), 159–173, 2004. Stroud, C., Makar, P. A., Karl, T., Guenther, A., Geron, C., Turnipseed, A. A., Nemitz, E.,
Baker, B., Potosnak, M., Fuentes, J. D., McCarthy, H., and Oren, R.: Role of Canopy-Scale Photochemistry in Modifying Biogenic-Atmosphere Exchange of Reactive Terpene Species:
20
Results from the CELTIC Field Study, J. Geophys. Res.-A, in press, 2005.
Warneke, C., Karl, T., Judmaier, H., Hansel, A., Jordan, A., Lindinger, W., and Crutzen, P. J.: Acetone, methanol, and other partially oxidized volatile organic emissions from dead plant matter by abiological processes: Significance for atmospheric HOx chemistry, Global Bio-geochemical Cycles, 13 (1), 9–17, 1999.
25
Went, F. W.: Blue hazes in the atmosphere, Nature, 187 (4738), 641–643, 1960.
Wesely, M.: Parameterization of surface resistance to gaseous dry deposition in regional-scale numerical models, Atmos. Environ., 23, 1293–1304, 1989.
Wildt, J., Kobel, K., Schuh-Thomas, G., and Heiden, A. C., Emissions of Oxygenated Volatile Organic Compounds from Plants Part II: Emissions of Saturated Aldehydes, J. Atmos.
30
ACPD
5, 5875–5907, 2005 Exchange of oxygenated VOCs in the atmosphere T. Karl et al. Title Page Abstract Introduction Conclusions References Tables Figures J I J I Back Close Full Screen / EscPrint Version Interactive Discussion
EGU
Table 1. Temperature dependent methanol and acetone emissions obtained for Loblolly pine (Pinus taeda); listed are the emission rate from disjunct eddy covariance measurement at 30◦C (column 2; rows 3,4), emission rate scaled up from leaf level measurement at 30◦C (column 3, 4; rows 3,4), standard emission rate from disjunct eddy covariance measurement (column 2; rows 7,8), standard emission rate from leaf level measurement (column 3, 4; rows 7,8), exponential factor from disjunct eddy covariance measurement (column 5; rows 7, 8) and exponential factor from leaf level measurement (column 6; rows 7, 8). Leaf level emission rates are normalized by dry weight in gram (e.g. g g−1).
E DEC 30◦C(a) E Leaf 30◦C(b)
[g m−2h−1] [g m−2h−1] [g g−1h−1]
×1E-04 ×1E-04 ×1E-07
MeOH 3.5±1.0 3.8±0.8 5.9±1.2
Acetone 4.0±1.2 3.4±0.7 5.2±1.0
E0DEC(a) E0Leaf(a) b(a)ec b(a)L [g m−2h−1] [g m−2h−1] [g g−1h−1] [1/◦C] [1/◦C]
×1E-05 ×1E-04 ×1E-08
MeOH 0.3±0.1 1.1±0.2 1.8±0.5 0.16±0.03 0.12±0.02
Acetone 3.5±1.1 0.3±0.1 3.9±1.2 0.08±0.01 0.09±0.01
(a)
fitted according to E0×exp (b×T (◦C))
(b)
ACPD
5, 5875–5907, 2005 Exchange of oxygenated VOCs in the atmosphere T. Karl et al. Title Page Abstract Introduction Conclusions References Tables Figures J I J I Back Close Full Screen / EscPrint Version Interactive Discussion
EGU
Table 2. Leaf level compensation point measurements of acetaldehyde for Loblolly Pine (Pinus
taeda). Compensation point measurements with 4 sets of needles are summarized as follows
(lines 1–8): Slope (inferred from the compensation point regression analysis), E0(zero intercept inferred from regression analysis: emission at 0 ppbv concentration in incoming air) and CP (compensation point). The temperature dependence is summarized in lines 9 and 10: E0(zero intercept inferred from regression analysis: emission at 0 ppbv concentration in incoming air), b0(exponential temperature dependence of zero intercept), CP (compensation point) and bcp (exponential temperature dependence of the compensation point). Leaf level emission rates are normalized by dry weight in gram (e.g. g g−1).
Slope E0 CP [ppb]
[g g−1h−1ppb−1] [g g−1h−1]
×1E-08 ×1E-07
Set 1 before O3 (mature) −1.1±0.1 0.4±0.04 3.7±0.6 Set 1 1 day after O3 −0.60±0.05 0.2±0.02 3.5±0.5 Set 2 before O3 (mature) −3.9±0.3 3.3±0.1 8.5±1.3 Set 2 1 day after O3 −2.0±0.1 1.8±0.1 8.0±1.3 Set 3 before O3 (young) −2.0±0.1 1.5±0.2 7.1±2.5 Set 3 1 day after O3 −1.3±0.2 0.11±0.04 1.2±0.7
Temperature dependence E(a)0 b(a)0 CP(b) b(b)cp [g−1g−1h−1] [1/◦C] [ppb] [1/◦C]
×1E-09
Set 4 (mature) 4.8±0.5 0.10±0.005 0.16±0.02 0.11±0.006
(a)
fitted according to E0×exp (b0×T ( ◦
C))
(b)
ACPD
5, 5875–5907, 2005 Exchange of oxygenated VOCs in the atmosphere T. Karl et al. Title Page Abstract Introduction Conclusions References Tables Figures J I J I Back Close Full Screen / EscPrint Version Interactive Discussion
EGU
Table 3. Leaf Level measurements of methanol, acetone and acetaldehyde with sweetgum (Liquidambar styraciflua): E (methanol and acetone emission for a mature and young leaf at 28◦C and 27◦C, respectively), Slope (inferred from the compensation point regression analy-sis), E0 (zero intercept inferred from regression analysis: emission at 0 ppbv concentration in incoming air) and CP (compensation point). Leaf level emission rates are normalized by dry weight in gram (e.g. g g−1).
Methanol Acetone Acetaldehyde Mature leaf E@28◦C [g−1g−1h−1]×1E-06 0.81±0.24 1.0±0.3
-Slope [g g−1h−1ppb−1]×1E-08 - - −7.7±1.9 E0[g
−1
g−1h−1]×1E-07 - - 2.9±0.7
CP [ppb] - - 3.8±1.1
Young leaf E@27◦C [g−1g−1h−1]×1E-05 1.6±0.5 0.14±0.04 -Slope [g g−1h−1ppb−1]×1E-07 - - −1.7±0.4
E0 [g−1g−1h−1]×1E-08 - - −3.3±0.8
ACPD
5, 5875–5907, 2005 Exchange of oxygenated VOCs in the atmosphere T. Karl et al. Title Page Abstract Introduction Conclusions References Tables Figures J I J I Back Close Full Screen / EscPrint Version Interactive Discussion
EGU
Table 4. Summary of Gradient Observations: Flux ILT (flux calculated from Inverse Lagrangian Transport Model), Flux EC (flux calculated from Eddy Covariance measurements), C mean uc (mean concentration above the canopy), C mean lc (mean concentration below the canopy top), mean ev (average exchange velocity calculated from ILT flux), net ev (net exchange velocity calculated from ILT flux), ev layer 1 (exchange velocity for layer one: ground to ∼2 m above ground) and ev max/min (maximum and minimum exchange velocity inferred from Fig. 3).
MeOH Acetone CH3CHO
Day Flux ILT [mg m−2h−1] 0.52±0.16 0.11±0.03 −0.1±0.03 Flux EC [mg m−2h−1] 0.32±0.10 0.37±0.2 -C mean uc [ppb] 5.78 3.55 0.86 C mean lc [ppb] 5.91 3.58 0.74 Mean ev [cm s−1] 0.26±0.56 0.01±0.3 −0.46±1.68 Net ev [cm s−1] 1.32±0.40 0.26±0.08 −2.3±0.7 ev layer 1 (soil) [cm s−1] −0.14 −0.05 0.12 ev max/min [cm s−1] 1.0 / −0.22 0.45 / −0.13 1.94 / −2.61 Night C mean uc [ppb] 3.87 2.79 0.44 C mean lc [ppb] 2.46 2.41 0.25 Mean ev [cm s−1] −0.30±0.45 −0.11±0.15 −0.32±0.48 Net ev [cm s−1] −0.96±0.30 −0.46±0.12 −1.29±0.30 ev layer 1 (soil) [cm s−1] 0.06 0.05 −0.32 Ev max/min [cm s−1] 0.06/−0.97 0.05/−0.32 0.30 / −0.88
MVK+MAC C3,4carbonyls Acetic Acid+Glycolaldehyde
Day Flux ILT [mg m−2h−1] −0.067±0.02 0.15±0.04 −0.9±0.3 C mean uc [ppb] 2.20 1.08 3.53 C mean lc [ppb] 2.11 1.10 3.12 Mean ev [cm s−1] −0.065±0.15 0.26±0.63 −0.68±0.68 Net ev [cm s−1] −0.33±0.10 1.32±0.40 −3.14±0.90 ev layer 1 (soil) [cm s−1] −0.07 −0.33 −0.55 Ev max/min [cm/s] 0.15 / −0.27 1.34 / −0.33 0.22 / −1.56 Night C mean uc [ppb] 1.28 0.70 1.68 C mean lc [ppb] 0.63 0.50 0.86 Mean ev [cm s−1] −0.59±0.98 −0.43±0.63 −0.33±0.49 Net ev [cm s−1] −2.4±1.0 −1.72±0.55 −1.3±0.4 ev layer 1 (soil) [cm s−1] 0.2 −0.25 −0.13 Ev max/min [cm s−1] 0.2 / −2.0 0.2/−1.3 0.09 / −1.0
ACPD
5, 5875–5907, 2005 Exchange of oxygenated VOCs in the atmosphere T. Karl et al. Title Page Abstract Introduction Conclusions References Tables Figures J I J I Back Close Full Screen / EscPrint Version Interactive Discussion EGU 0 1 2 3 4 5 6 7 8 9 10 11 -4 -2 0 2 4 6 8 x 10⁻⁷ g g -1 h -1 ppb 0 1 2 3 4 5 6 7 8 9 -4 -3 -2 -1 0 1 2 3x 10 -7 g g -1 h -1 ppb 0 1 2 3 4 5 6 7 8 0 1 2 3 4 x 10⁻⁷ g g -1 h -1 ppb 0 1 2 3 4 5 6 7 8 -1 0 1 2 3 x 10⁻⁷ g g -1 h -1 ppb
Fig. 1. Example of compensation point measurements for acetaldehyde with Loblolly pine
(Pi-nus taeda) using young needles before (upper left) and after 120 ppb ozone exposure (lower
left) and mature needles before (upper right) and after 120 ppb ozone exposure (lower right). Exchange rates (g g−1h−1) are plotted vs. outgoing air concentration in ppbv. Leaf level ex-change rates are normalized by dry weight in gram (e.g. g g−1).