HAL Id: hal-00295779
https://hal.archives-ouvertes.fr/hal-00295779
Submitted on 7 Nov 2005
HAL is a multi-disciplinary open access
archive for the deposit and dissemination of
sci-entific research documents, whether they are
pub-lished or not. The documents may come from
teaching and research institutions in France or
abroad, or from public or private research centers.
L’archive ouverte pluridisciplinaire HAL, est
destinée au dépôt et à la diffusion de documents
scientifiques de niveau recherche, publiés ou non,
émanant des établissements d’enseignement et de
recherche français ou étrangers, des laboratoires
publics ou privés.
UV radiation below an Arctic vortex with severe ozone
depletion
B. M. Knudsen, H. Jønch-Sørensen, P. Eriksen, B. J. Johnsen, G. E. Bodeker
To cite this version:
B. M. Knudsen, H. Jønch-Sørensen, P. Eriksen, B. J. Johnsen, G. E. Bodeker. UV radiation below an
Arctic vortex with severe ozone depletion. Atmospheric Chemistry and Physics, European Geosciences
Union, 2005, 5 (11), pp.2981-2987. �hal-00295779�
www.atmos-chem-phys.org/acp/5/2981/ SRef-ID: 1680-7324/acp/2005-5-2981 European Geosciences Union
Chemistry
and Physics
UV radiation below an Arctic vortex with severe ozone depletion
B. M. Knudsen1, H. Jønch-Sørensen1, P. Eriksen1, B. J. Johnsen2, and G. E. Bodeker3
1Danish Meteorological Institute, Copenhagen, Denmark
2Norwegian Radiation Protection Authority, Oslo, Norway
3National Institute of Water and Atmospheric Research, Lauder, New Zealand
Received: 11 April 2005 – Published in Atmos. Chem. Phys. Discuss.: 12 July 2005 Revised: 27 September 2005 – Accepted: 28 October 2005 – Published: 7 November 2005
Abstract. The erythemally weighted (UV) irradiance below the severely depleted Arctic vortices in spring 1996 and 1997 were substantially elevated. On average the UV increased 36 and 33% relative to the 1979–1981 mean assuming clear skies from day 80–100 in 1996 and 1997, respectively. On clear sky days large regions of the Arctic experienced maxi-mum UV increases exceeding 70 and 50% on single days in 1996 and 1997, respectively. A minor fraction of these in-creases are not anthropogenic and have a dynamical origin as seen by comparison to 1982, when hardly any ozone de-pletion is expected.
1 Introduction
Concentrations of ozone depleting substances are decreasing slowly, so we can expect several years with current levels of ozone depletion (WMO, 2003; Knudsen et al., 2004). But exactly how bad is the current situation? One place where substantially elevated levels of UV radiation are expected is below a severely depleted vortex during springtime. This can happen in Antarctica and southern parts of South America (Pazmi˜no et al., 2004) and in the Northern Hemisphere (NH) high latitudes. The NH is the focus of this paper. During passage of an ozone mini-hole and a severely depleted vortex on March 6, 1996, Seckmeyer et al. (1997) found a
substan-tial increase in UV even at 47◦N. Latitude dependent UV
trends from satellite data have been estimated by Herman et al. (1996) for the period 1979-1992. During April the largest
NH trends occur north of 50◦N (WMO, 1999).
Taalas et al. (2000) calculated the UV increase expected in the future from general circulation model predictions, and found April mean UV increases in the period 2010–2020 ex-ceeding 90% of the 1979–1992 average for the worst case Correspondence to: B. M. Knudsen
scenario. We document here what levels of UV we have al-ready experienced and are likely to experience in the foresee-able future.
The importance of UV radiation levels in spring in the Arctic can be seen from Jokela et al. (1993), who found that on a vertical surface noon-time UV irradiances were higher at the end of April than at any other time of the year in north-ern Finland. The amount of UV reaching a vertical surface has important biological implications, particularly for the eye (ACIA, 2004) and for the skin of people standing up or sit-ting down. In the paper we have, however, used the accepted standard of erythemal irradiance on a horizontal surface.
We calculate the vortex-averaged increases in clear-sky UV radiation with respect to climatology. This is done for spring 1996 and 1997, when the vortex was severely depleted and long-lasting. As a reference the same calculation was performed for spring 1982, when the vortex was long-lasting, but hardly any ozone depletion is expected. We have used a UV radiation code for the calculations as well as meteorolog-ical data. The UV radiation calculations have been validated against UV observations at a single high-latitude site, but all calculations have been performed for the whole vortex.
2 UV calculation
The clear sky UV fields of erythemal irradiance are calcu-lated using the widely employed radiative transfer model UVSPEC (Kylling, 1995; Mayer and Kylling, 2005) which is based on the discrete ordinate method DISORT (Stamnes, 1989) and has been thoroughly validated against measure-ments (see references in Mayer and Kylling, 2000). The cal-culations are performed with total ozone as the only tempo-rally varying input parameter whereas climatological param-eters are used for all other atmospheric input data as well as surface albedo.
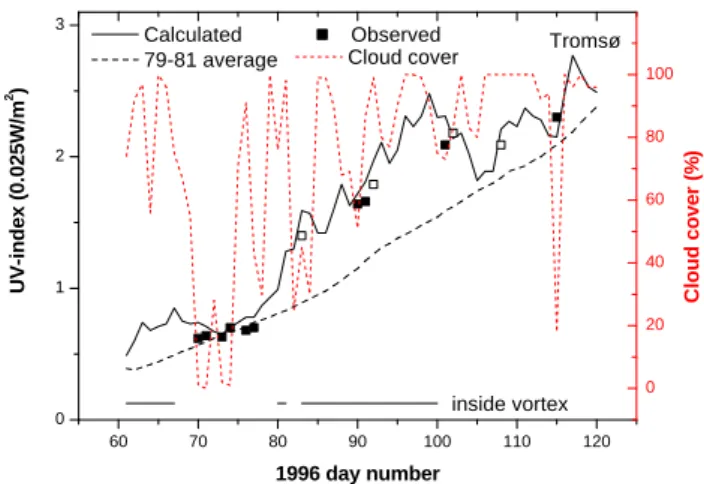
2982 B. M. Knudsen et al.: UV radiation below depleted Arctic vortices 60 70 80 90 100 110 120 0 1 2 3 inside vortex Tromsø UV-index (0.025W/m 2 ) 1996 day number Calculated Observed 79-81 average 0 20 40 60 80 100 Cloud cover Cloud cover ( %)
Fig. 1. Comparison of the calculated UV-index (solid, black line) to radiometer measurements at Tromsø (filled squares for clear-sky measurements, open squares for measurements weakly affected by clouds). The 1979–1981 mean UV-index is also shown (dashed). The period when Tromsø was inside the vortex are marked at the bottom of the plot. The dotted, red line is the ECMWF cloud cover.
We used the 360 nm albedo based on TOMS reflectivity data from 1979–1992 calculated with a moving time-window technique (MTW) (Tanskanen, 2004). The UV albedo is usually below 10%, but snow cover can increase the albedo
up to 95%. During the March-April period studied here
snow cover can vary a lot from year to year in certain re-gions, such as Scandinavia and adjacent parts of Russia. We therefore also tried to use the normal albedo calculated by the European Centre for Medium-Range Weather Forecasts (ECMWF), but only small differences were found in the vor-tex means presented below.
The total ozone data used are the National Institute of Water and Atmospheric Research (NIWA) assimilated total ozone data set, which uses Nimbus 7 and Earth Probe TOMS version 8 uncorrected and Meteor and Adeos TOMS and GOME normalized to the Dobson network (Bodeker et al., 2001, 2005). Compared to ground based Brewer
measure-ments in Kangerlussuaq (67◦N, 309◦E) TOMS version 8 is
slightly too low in April (∼7 DU) leading to slightly too high calculated UV (∼3%).
The UVSPEC programme has been used to make a lookup
table with increments of 20 DU, 5◦, and 50% in total ozone,
solar zenith angle, and albedo, respectively. Linear interpo-lation in this table was found to be sufficiently accurate. The effect of aerosols are corrected for using the aerosol opti-cal depth (AOD) at 300 nm found in the climatology from the Global Aerosol Data Set (GADS) (K¨opke et al., 1997). We used the GADS summer data set, which a spatial
resolu-tion of 5◦×5◦covering the globe. This is a coarse resolution
in both space and time, however no other data are available with a global coverage. A simple correction for the effect of aerosols is applied to the UV irradiances by multiplication
with exp(−0.5∗AOD).
We have used the UV-index as a unit of measure of UV levels relevant to the effects on human skin. It is defined as the effective irradiance obtained by integrating the spectral irradiance weighted by the CIE (1987) reference action spec-trum up to 400 nm normalised to 1 at 297 nm and multiplying
the time weighted average effective irradiance in Wm−2by
40.
We have cut off the calculations at 75◦solar zenith angle
(SZA), to avoid biologically harmless levels of UV. For a total ozone amount of 300 DU and an albedo of 95% we get
a UV-index of 0.78 at 75◦SZA, which gives one minimum
erythemal dose (1 MED=200 Jm−2)during about 3 h.
3 Comparison to UV observations
In Fig. 1 the model results have been compared with mea-surements from the multichannel moderate bandwidth
fil-ter radiomefil-ter GUV-541 in Tromsø (69.7◦N, 19.0◦E) that
is part of the Norwegian UV monitoring network (Johnsen et al., 2002). The calibrations are maintained with a trav-elling reference filter radiometer, calibrated by the Norwe-gian Radiation Protection Authority. The irradiance scale is traceable to the NOGIC2000 Nordic Intercomparison of UV and total ozone instruments that was arranged in Halmstad in June 2002. The comparison in Fig. 1 is done for local noon and only smooth bell-shaped daily profiles are used to avoid cloud affected days. On certain days (marked by open sym-bols) the profiles were not totally smooth. Both the MTW albedo climatology and the ECMWF albedo were between 36–44% for the whole period. The model results compare well with the observations. They are 6% higher on average, but this could be due both to modelling errors and observa-tional biases. Small errors in the absolute UV levels are not too important in this study, where the emphasis is on rela-tive UV increases. The cloud cover shown in Fig. 1 is the ECMWF cloud cover at the analysis time closest to local noon. Only a minor fraction of the clear-sky observations are made when the ECMWF cloud cover is small indicating that this parameter is not too useful at individual sites.
4 Results
In spring 1996 and 1997 the vortex ozone depletion was sub-stantial (e.g. Rex et al., 2004; Knudsen et al., 1998; Goutail et al., 2004; Harris et al., 2002; Tilmes et al., 2004) with the depletion maximising at around 100 DU. In both years the vortex lasted well into April. The same is true for spring 1995, but no TOMS or GOME ozone data are available for this period. In spring 2000 and 2005 large ozone depletions also occurred, but a vortex break-up in mid-March prevented high UV levels beneath the vortex.
As an example of the effect of the depletion on the ozone column Figs. 2a and b show the column ozone for two selected days in April 1996 and 1997. The approximate
Fig. 2. (a) NIWA assimilated total ozone north of 40◦N on 9 April 1997. The thick black contour is 36 PVU of the 475 K PV, whereas the white contour is 6 PVU of the 350 K PV. Grey dots mark cloud cover (see text).
position of the polar vortex is indicated by thick black
con-tours of 36 PVU (10−6Km2s−1kg−1)of the 475 K PV
(po-tential vorticity). It is evident that very low ozone values occur inside the vortex. The ECMWF analysed total cloud cover is indicated by the grey dots. The grey dots occupy 70% of each pixel in both meridional and zonal direction, i.e. 49% of the area of the pixel for totally overcast conditions, whereas for smaller cloud fractions the dots are reduced pro-portionally. No dots are drawn for a cloud cover below 2 octas (25%).
One might think that the frequent ozone mini-holes are the dominating factor in high UV episodes in the Arctic. Accord-ing to ACIA (2004) this is not case: the high UV episodes are dominated by the vortex low ozone episodes, at least in years with severe depletion. On one hand an ozone mini-hole is connected to a high-pressure system and usually cloud-free conditions, whereas it usually is more overcast beneath a vor-tex. On the other hand a depleted vortex is much larger than and occurs much more frequently in the Arctic than ozone mini-holes. Please note that the ozone mini-hole climatol-ogy by James (1998) includes episodes of low ozone inside the vortex. Ozone mini-holes are of course also affected by the general ozone depletion and have particularly low ozone columns in recent years.
Ozone mini-holes are caused primarily by transport of low ozone from lower latitudes (Koch et al., 2005). Such low-latitude air will retain its low PV for a long time and should be detectable in ECMWF analysis for several days. In Fig. 2
Fig. 2. (b) As Fig. 2a, but for 1 April 1996.
Fig. 2. (c) As Fig. 2a, but for 29 March 1982.
the 6 PVU contour of the 350 K isentropic PV is therefore plotted as well, and it does seem to track the ozone mini-holes reasonably well.
To quantify the non-anthropogenic dynamical influences on the vortex ozone columns we have looked at the
2984 B. M. Knudsen et al.: UV radiation below depleted Arctic vortices
Fig. 3. Clear sky UV-index on 1 April 1996. Black contour marks vortex edge.
1981–1982 winter when the vortex lasted into April. Po-lar stratospheric clouds and chlorine were very sparse so only little chemical ozone depletion is expected. The March
averaged column ozone at Thule (76.5◦N, 68.8◦W) for days
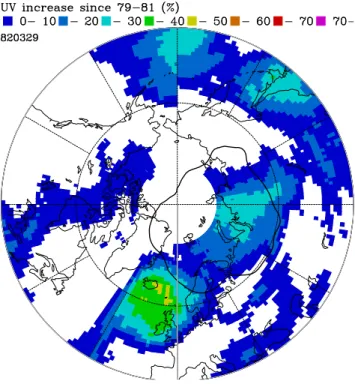
when the station was inside the vortex, was at its lowest dur-ing the period 1979–1988 in 1982 (Andersen, 1999), indicat-ing that 1982 will give us the approximate maximum dynam-ical influence on the vortex UV levels. Figure 2c shows the low ozone columns inside the vortex on 29 March 1982.
Figure 3 shows the clear sky UV-index (the unit is
0.025 Wm−2)on 1 April 1996. Please note that altitude has
not been taken into account in the UV calculations. In the remainder of the paper we focus on relative increases of UV, which more or less are independent of the altitude.
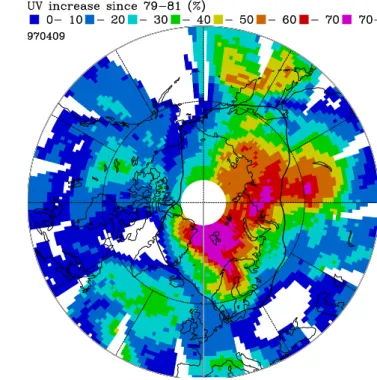
Clear sky UV is calculated for each day in March–April 1979–1981 as a reference. This field is smoothed by averag-ing over 11 days for all 3 years. Figure 4 shows the clear sky UV increase relative to the 1979–1981 period for the three days shown in Fig. 2. This figure shows substantial increases in UV under the depleted vortices in 1996 and 1997. These UV increases are of interest since UV-protection (e.g. sun-screen) might be necessary in case of clear sky. In 1982 there is a small increase in UV relative to the climatology.
Figure 5 shows the vortex averaged clear sky UV increase, clear sky UV-index, cloud cover, and equivalent latitude of the edge of the vortex for each day in the 3 years studied. The curves stop when the vortex breaks up. Panel (d) shows that the vortex in 1982 and 1996 diminished its size
substan-Fig. 4. (a) Clear sky UV increase relative to 1979–1981 (%) for 9 April 1997. Thick black contour marks the vortex edge.
Fig. 4. (b) As Fig. 4a, but for 1 April 1996.
tially prior to actual break-up. It is necessary to be cautious about results obtained during this period because the vortex can be flushed with outside air and split up. Periods of vortex splitting are indicated by dashed lines in this panel. In panel
Fig. 4. (c) As Fig. 4a, but for 29 March 1982.
a circles mark the days used in Figs. 2–4. The days with maximum UV increase in 1996 occur during ozone mini-hole episodes affecting the vortex. The average increase from day 80–100 was 6.7, 35.9, and 33.0% in 1982, 1996, and 1997, respectively. The UV increase in 1982 is our best estimate of the maximum non-anthropogenic dynamical contribution to the increases in 1996 and 1997. In 1996 and 1997 there may be a larger dynamical contribution than in 1982, but this could be due to anthropogenic influence. The UV-indices in panel (b) are influenced by how far off the pole the vortex is displaced. Particularly during vortex split-up parts of the vortex can move quite far south. In 1996 the vortex moved far south and thus affected midlatitude sites (Seckmeyer et al., 1997). A rather high cloud cover each year is revealed in Fig. 5, panel (c).
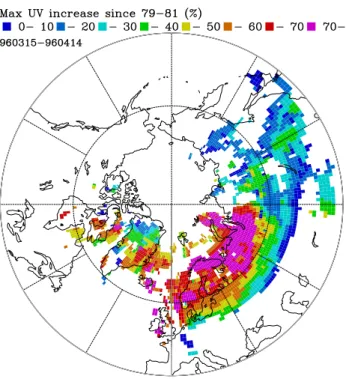
Figure 6 shows the maximum clear sky UV increase expe-rienced underneath the vortex on a single day from 15 March to break-up. As the vortex moves around at any given lo-cation only the days when the vortex was above are con-sidered. Only days when the cloud cover was below 2 oc-tas are used. Individual pixels should be used with caution due to the above mentioned problems with the cloud cover. Both in spring 1996 and 1997 large parts of the Arctic ex-perienced substantially elevated levels of UV radiation. For the maximum increase of 97% found in 1996, the time to get sunburnt almost halved, showing the importance of making UV-forecasts.
Figure 7 shows the maximum UV increases found outside the vortex. These are on average much smaller than those
-10 0 10 20 30 40 50 60 0 1 2 3 4 0 10 20 30 40 50 60 70 80 90 60 70 80 90 100 110 120 65 70 75 80 85
a
UV increase (%)b
UV-index (0.025W/m 2 )c
Cloud cover (%)d
Vortex averaged UV and cloud cover
Equiv. latitude
Day number 1997
1996 1982
Fig. 5. Vortex averaged clear sky UV increase (a), clear sky UV-index (b), cloud cover (c), and equivalent latitude of the edge of the vortex (d). Periods of vortex splitting is indicated by dashed lines in panel (d). In panel (a) circles mark the days used in Figs. 1–3.
inside the vortex. Most of the large UV increases are in fact connected to the vortex since they occur for 475 K PV values between 30–36 PVU. This region should to some degree be isolated from the surf zone (zone of approximately constant PV between the vortex and the tropics) due to substantial gra-dients in PV. Inspection of 475 K PV and temperature maps reveals that in the winter 1995/96 temperatures low enough for polar stratospheric clouds to exist were unusually often found outside the polar vortex. Chemical ozone depletion could thus help explain the low ozone values found in this region, but the fact that the actual edge of the vortex on some days is at PV values below 36 PVU may also contribute.
5 Conclusions
Our calculations show that high UV levels do occur below severely depleted Arctic vortices and this situation is likely to continue for many years to come. These depletions can af-fect midlatitudes, when the vortex moves southward, as mea-sured in 1996 (Seckmeyer et al.,1997). The vortex ozone
2986 B. M. Knudsen et al.: UV radiation below depleted Arctic vortices
Fig. 6. (a) Maximum UV increase inside the vortex since 1979– 1981 (%) on clear sky days from 15 March to vortex break-up in 1997.
Fig. 6. (b) As Fig. 6a, but for 1996.
depletions will eventually spread out to midlatitudes after vortex break-up and cause ozone reductions (Knudsen and Andersen, 2001), which probably lead to increased UV.
Fig. 7. Maximum UV increase outside the vortex since 1979–1981 (%) on clear sky days from 15 March to vortex break-up in 1996.
Acknowledgements. A. Kylling and B. Meyer are gratefully ac-knowledged for making the UVSPEC radiative transfer programme freely available. Thanks to A. Tanskanen for providing the UV albedos. The Norwegian State Pollution Control Authority and the Norwegian Institute for Air Research are thanked for the Tromsø UV measurements. We are also indebted to both the TOMS and
GOME teams for column ozone and other data. ECMWF is
acknowledged for the provision of their meteorological analyses. Edited by: G. Vaughan
References
ACIA: Impacts of a Warming Arctic: Arctic Climate Impact As-sessment, Chapter 3, Cambridge University Press, 2004. Bodeker, G. E., Scott, J. C., Kreher, K., and McKenzie, R. L.:
Global ozone trends in potential vorticity coordinates using TOMS and GOME intercompared against the Dobson Network: 1978–1998, J. Geophys. Res., 106, 23 029–23 042, 2001. Bodeker, G. E., Shiona, H., and Eskes, H.: Indicators of Antarctic
ozone depletion, Atmos. Chem. Phys., 5, 2603–2615, 2005, SRef-ID: 1680-7324/acp/2005-5-2603.
Andersen, S. B.: Spring ozone column values over Thule, Green-land in the period 1991–1998, Geophys. Res. Lett., 26, 193–196, 1999.
Goutail, F. , Pommereau, J. , Lef`evre, F. , Van Roozendael, M. , Andersen, S. , K˚astad Høiskar, B. , Dorokhov, V. , Kyr¨o, E., Chipperfield, M., and Feng, W.: Early unusual ozone loss during the Arctic winter 2002/2003 compared to other winters, Atmos. Chem. Phys., 5, 665–677, 2005,
SRef-ID: 1680-7324/acp/2005-5-665.
Harris, N. R. P., Rex, M., Goutail, F., Knudsen, B. M., Manney, G. L., M¨uller, R., and von der Gathen, P.: Comparison of Empir-ically Derived Ozone Losses in the Arctic Vortex, J. Geophys. Res., 107 (D20), 8264, doi:10.1029/2001JD00482, 2002. Herman, J. R., Bhartia, P. K., Kiemke, J., Ahmad, Z, and Larko,
D.: UV-B increases (1979–1992) from decreases in total ozone, Geophys. Res. Lett., 23, 2117–2120, 1996.
James, P. M.: An interhemispheric comparison of ozone mini-hole climatologies, Geophys. Res. Lett., 25, 301–304, 1998. Johnsen, B. J., Mikkelborg, O., Hannevik, M., Nilsen, L. T.,
Saxebøl, G., and Blaasaas, K. G.: The Norwegian UV monitor-ing program. Period 1995/96 to 2001, Str˚alevernRapport 2002:4, Øster˚as: Norwegian Radiation Protection Authority, 2002. Jokela, K., Leszinsky, K., and Visuri, R.: Effects of Arctic ozone
depletion and snow on UV exposure in Finland, Photochem. Pho-tobiol., 58, 559–566, 1993.
Knudsen, B. M. and Andersen, S. B.: Longitudinal variation in springtime ozone trends, Nature, 413, 699–700, 2001.
Knudsen, B. M., Larsen, N., Mikkelsen, I. S., et al.: Ozone deple-tion in and below the arctic vortex for 1997, Geophys. Res. Lett., 25, 627–630, 1998.
Knudsen, B. M., Harris, N. R. P., Andersen, S. B., Christiansen, B., Larsen, N., Rex, M., and Naujokat, B.: Extrapolating future Arctic ozone losses, Atmos. Chem. Phys., 4, 1849–1856, 2004, SRef-ID: 1680-7324/acp/2004-4-1849.
Koch, G., Wernli, H., Schwierz, C., Staehelin, J., and Peter, T.: A composite study on the structure and formation of ozone mini-holes and minihighs over central Europe, Geophys. Res. Lett., 32, L12810, doi:10.1029/2004GL022062, 2005.
Kylling, A., Stamnes, K., and Tsay, S.-C.: A reliable and efficient two-steam algorithm for spherical radiative transfer: Documen-tation of accuracy in realistic layered media, J. Atmos. Chem., 21, 115–150, 1995.
Mayer, B. and Kylling, A.: Technical note: The libRadtran software package for radiative transfer calculations – description and ex-amples of use, Atmos. Chem. Phys., 5, 1855–1877, 2005, SRef-ID: 1680-7324/acp/2005-5-1855
K¨opke, P., Hess, M., Schult, I., and Shettle, E. P.: Global Aerosol Data Set, Report no. 243, Max-Planck-Institut fur Meteorologie, Hamburg, September 1997.
Pazmi˜no, A., Godin-Beckman, S., Bekki, S., Ginzburg, M., and Quel, E.: Evolution of stratospheric ozone over Argentinean stations during 1997–2003 and correlations with UV-radiation, Proc. XX Quadr. Oz. Symp., Kos, Greece, 1–8 June, 2004. Rex, M., Salawitch, R. J., von der Gathen, P., Harris, N.
R. P., Chipperfield, M. P., and Naujokat, B.: Arctic ozone loss and climate change, Geophys. Res. Lett., 31, L04116, doi:10.1029/2003GL018844, 2004.
Seckmeyer, G., Mayer, B., Bernhard, G., Erb, R., Albold, R., J¨ager, H., and Stockwell, W. R.: New maximum UV irradiance lev-els observed in central Europe, Atmos. Environ., 31, 2971–2976, 1997.
Stamnes, K., Tsay, S., Wiscombe, W., and Jayaweera, K.: Nu-merically stable algorithm for discrete-ordinate-method radiative transfer in multiple scattering and emitting layered media, Appl. Opt., 27, 2502–2509, 1988.
Taalas, P., Kaurola, J., Kylling, A., et al.: The impact of green-house gases and halogenated species on future solar UV radiation doses, Geophys. Res. Lett., 27, 1127–1130, 2000.
Tanskanen, A.: Lambertian Surface Albedo Climatology at 360 nm from TOMS Data Using Moving Time-Window Technique, Proc. XX Quadr. Oz. Symp., 1–8 June, Kos, Greece, 2004.
Tilmes, S. , M¨uller, R. , Grooß, J., and Russel III, J. M.: Ozone loss and chlorine activation in the Arctic winters 1991–2003 derived with the tracer-tracer correlations, Atmos. Chem. Phys., 4, 2181– 2213, 2004,
SRef-ID: 1680-7324/acp/2004-4-2181.
WMO: Scientific Assessment of ozone depletion: 1998, World Me-teorological Organisation Global Ozone Research and Monitor-ing Project Report No. 44, Geneva, 1999.
WMO: Scientific Assessment of ozone depletion: 2002, World Me-teorological Organisation Global Ozone Research and Monitor-ing Project Report No. 47, 498, Geneva, 2003.