Publisher’s version / Version de l'éditeur:
Journal of Glaciology, 4, 32, pp. 207-214, 1962-08-01
READ THESE TERMS AND CONDITIONS CAREFULLY BEFORE USING THIS WEBSITE. https://nrc-publications.canada.ca/eng/copyright
Vous avez des questions? Nous pouvons vous aider. Pour communiquer directement avec un auteur, consultez la
première page de la revue dans laquelle son article a été publié afin de trouver ses coordonnées. Si vous n’arrivez pas à les repérer, communiquez avec nous à PublicationsArchive-ArchivesPublications@nrc-cnrc.gc.ca.
Questions? Contact the NRC Publications Archive team at
PublicationsArchive-ArchivesPublications@nrc-cnrc.gc.ca. If you wish to email the authors directly, please see the first page of the publication for their contact information.
NRC Publications Archive
Archives des publications du CNRC
This publication could be one of several versions: author’s original, accepted manuscript or the publisher’s version. / La version de cette publication peut être l’une des suivantes : la version prépublication de l’auteur, la version acceptée du manuscrit ou la version de l’éditeur.
Access and use of this website and the material on it are subject to the Terms and Conditions set forth at
Studies on the density of naturally and artificially formed fresh-water
ice
Ager, B. H.
https://publications-cnrc.canada.ca/fra/droits
L’accès à ce site Web et l’utilisation de son contenu sont assujettis aux conditions présentées dans le site
LISEZ CES CONDITIONS ATTENTIVEMENT AVANT D’UTILISER CE SITE WEB.
NRC Publications Record / Notice d'Archives des publications de CNRC:
https://nrc-publications.canada.ca/eng/view/object/?id=d6efce1e-3e5f-4530-8a86-16c2bf762e30 https://publications-cnrc.canada.ca/fra/voir/objet/?id=d6efce1e-3e5f-4530-8a86-16c2bf762e30Ser
T H lN21r2
1no.
164
c . 2
ELDG
CANADADIVISION OF BUILDING RESEARCH
STUDIES ON THE DENSITY
OF
NATURALLY AND
ARTIFICIALLY FORMED FRESH -WATER ICE
BY
8.
H:SON AGERREPRINTED FROM THE JOURNAL OF GLACIOLOGY
VOL. 4. NO. 32. JUNE 1962,
RESEARCH PAPER N O .
O F THE
DlVlSlON OF BUILDING RESEARCH
OTTAWA AUGUST 1962 PRICE 25 CENTS <fl* $',,?
*-
- Lc2 ~-&4
~ N R C 6807This publication i s being distributed by the Division of Building R e s e a r c h of the National R e s e a r c h Council. It should not be reproduced in whole or in p a r t , without p e r m i s - sion of the original publisher. The Division would be glad to be of a s s i s t a n c e in obtaining such p e r m i s s i o n .
Publications of the Division of Building R e s e a r c h m a y be obtained by mailing the appropriate r e m i t t a n c e , ( a Bank, E x p r e s s , o r P o s t Office M ~ n e y Order. o r a cheque made 'pay- able a t p a r in Ottawa, to the R e c e i v e r General of Canada, c r e d i t ~ a t i o n a l R e s e a r c h council) to the National R e s e a r c h Council, Ottawa. Stamps a r e not acceptable.
A coupon s y s t e m has been introduced to make pay- m e n t s for publications relatively s i m p l e . Caupons a r e avail- able in denominations of 5, 2 5 and 50 cents, and m a y be ob- tained by making a r e m i t t a n c e a s indicated above. T h e s e coupons m a y be used f o r the purchase of a l l National R e s e a r c h Council publications including specifications of the Canadian Government Specifications Board.
Reprinted from the Journal of Glaciology, Vol. 4, No. 32, June 1962
#3b
pt
A"
g
.,.
2.
g
,
S T U D I E S O N T H E D E N S I T Y O F N A T U R A L L Y A N D
A R T I F I C I A L L Y F O R M E D F R E S H - W A T E R I C E
By B. H :SON ACER*
(Statens Skogsforskningsinstitut, Stockholm)
:lnsr~.kc?. Observations wcrc maclc on thc tlcnsily of naturally ancl a1 tificially formccl lakc ancl r i v ~ r ice. T h e cff'cct of ~nllial snow dcnsity, size ancl shape of snow crystals, ratc of water spread ant1 rate of freczing on the clcnsity of snow-icc obtaincd was studictl in thc laboratory and is prescntctl in graphical form. 'The obscrvat~ons indicatc that snow-icc formcd undcr natural conditions will probably havc a clcnsity bctwccn 0.85 a n d 0.90 g./crn.3. T h c classification of snow-icc is discussed briefly.
R h s u ~ k . O n a effcctue clcs observations d e la dcnsitC clc glacc d c rivikrc ct d c glacc clc lac FormCcs naturcllc- nlciit ct arlificicllemcnt. L a clcnsitC d c l a ncigc, Ics dimensions ct la forrne clc scs cristaux, la vitcsse dc pkndtration d c l'cau cr sa congelation ont un cff'ct sur la densit6 tlc la glacc obtcnue cn saturant la ncigc tl'eau; cct cff'ct a CtC CtudiC cn laboratoirc ct cst prCscntC sous formc d c graphiqucs. Lcs observations rnontrcnt quc la clcnsitC clc ccttc cspkce d c glacc, obtcnuc dans dcs conditions norrnalcs, oscillc probablcrncnt cntrc 0,85 et o,go g/crnj. L.a classificalion d c ccttc glacc cst cliscutCc britvcmcnt.
Z u s . k ~ n r ~ ~ r ' ~ s s t i ~ ~ . U b c r dic Dichtc naturlichcn uncl kunsllichcn Scc- uncl Flussciscs wurden Ucobach- tungcn angcstcll~. Dcr Einfluss clcr ursprunglichcn Schnccdichtc, dcr Grossc uncl F o r m dcr Schncckristallc, clcr Mcngc clcs zugcfiihrtcn Wassers uncl clcs Gradcs d e r Abkuhlung auf die Diclitc von Eis, clas clurch Einfricrcn von wasscrgcs%ttigtern Schnce rntstcht ("Schnee-Eis"), wurclc im 1,aboratoriurn untersuchl und in Diagrammen clargcstellt. Die Bcohachtungcn zcigcn, class Schncc-Eis, das sich unter naturlichcn Bcclin- gungcn bildct, gcwohnlich einc Diclitc zwischen 0,85 11nd o,gn g/cm3 besitzt. Dic K l a s ~ i ~ i r r u ~ ~ g von Schncc- Eis wircl kuri diskuticrt.
INTRODUCTION
I t is common practice in the logging industry in Scandinavia, Canada and other countries to place wood in temporary storage on the ice cover of rivers and lakes. These "landingsn, as they are called, must support considerable weight and it is often necessary to strengthen them by flooding the ice surface so that it reaches the required thickness in the shortest possible time. It is normal practice also to compact the snow on the cover to reduce its thermal resistance or make it more suitable for flooding. Increasing the thickness of the ice cover by either natural or artificial flooding of the upper surface, however, usually produces ice with a density lower than that of ice formed by natural growth a t the ice-~vater interface. There is little published information available on the density that call be expected for ice that has been formed under such conditions.
T h e prediction of the load that call be safely transported and placed upoil the ice cover is an important consideration in the use of landings. I t depends on the strength of the ice. Since Tabata (1958-60) has shown that density is a major factor that affects the strength of ice, information concerning density ~ ~ o u l d be u s e f ~ ~ l for calc~~lations on the strength 01. the ice cover.
It is sometimes necessary to keep logs dry in storage. The maximum load in this case depends on the buoyancy of the ice, since there is always a possibility that cracks will allolv water to come up if the ice is overloaded. The buoyancy of the ice depends upon its thickness and density. Thickness is generally known or can be controlled. What is recluired for calcula- tions on critical loads is information on the ice density.
There are two main types of naturally and artificially formed ice: "blue ice", formed from water only, and "snow-ice", from a mixture of water and snow. Studies in Sweden (Ager, 1960) indicate that the content of snow-ice in the naturally formed ice on lakes and rivers is generally quite high, very often one-third or more of the total thickness when the ice cover reaches its maximum thickness during the winter. This snow-ice is usually formed * ?'his work was tlonc whilc thc author Ilelcl a post-cloctoratc fcllo\\rhip with thc Snow ant1 Ice Section, 11ivisio11 of Building Research, National Rescarcli Council, Ottawa, Canatla, 1960-61.
207
208 J O U R N A L O F G L A C I O L O G Y
when the load of snow on the ice is heavy enough to cause water to come up through cracks in the cover and wet the snow. A great part of the preparatory work on ice landings will result in the formation of snow-ice also.
Because of the scarcity of information on the density of naturally and artificially formed ice and on how it is influenced by various factors, a study of the subject was undertaken. The observations and results of this study are presented in this paper.
Blue ice free of air bubbles has a density of about 0.917 g.Icm.3 a t o0 C. I t often contains air bubbles, however, and there is little information in the literature on their effect. Observa- tions on the density of naturally formed snow-ice in lakes and rivers have been reported as by-products of other investigations. The values reported range from 0.78 to 0 . 8 7 g.Icm.3 (Butkovich, 1954, 1955). No observations on the density of artificially formed ice on lakes and rivers was found.
The author carried out field studies of an introductory nature in Arvidsjaur in northern Sweden during the winter 1958-59 (Ager, 1960), measuring the density of ice samples by a very simple field method. Each sample was cut into cubes of approximately 2 0 cm.3 volume,
and the displacement of each observed in a 500 cm.3 glass cylinder filled with water a t oO C. These studies gave values averaging around o .goo to 0.905 g.lcm.3 for both naturally and artificially formecl snow-ice. There is a possibility that a n overestimation of the density by I to 2 per cent might have occurred because of the technique of measurement.
Measurements by H. M . Sundberg-Falkenmark (personal communication) on naturally formecl snow-ice on the lake Storsjon in Sweden during the same winter, gave a n average density of o .goo & o .oo4. g.lcm.3 for 20 samples.
FIELD OBSERVATIONS AND LABORATORY TESTS DURING THE WINTER 1960-61
During the winter 1960-61 samples were taken from naturally and artificially formed ice in the Ottawa and Iroquois Falls areas in Ontario. Observations were also carried out on ice grown in a cold room.
Trchiz~ques and accztraqy o/ obserz~atio?as
All samples, including those taken in the field, were measured in the cold room a t -9.5O C. A specimen was prepared with a band-saw and weighed; surface pits (cut air bubbles) were then filled with water from a n eyedropper; this water froze very quickly. Finally, the volume lvas measured l ~ y ol~serving the change in level of kerosene in a cylindrical container when the specimen was submerged in it.
T h e volume of the specimen was normally between 60 and 2 1 0 cm.3. In order to determine
the error of measurement, ten consecutive measurements on weight and volume were carried out on one zoo-cm.3 and one 70-cm.3 piece of clear ice. T h e mean and standard deviation for the calculated density was found to be o .g 196 f o .0003 g.lcm.3 a n d o 391 70 f 0.001 3 g.Icm.3
respectively. This error of measurement was considered small enough for the tests carried out; generally, only one measurement tvas made on each specimen.
Some of the samples were stored up to four months before the density was measured; a check showed that the influence of the length of this storage time on density was insignificant. Field observations
Snow-ice samples were obtained in January from McKay Lake near Ottawa a n d from the Mistango River close to where it empties into Lake Abitibi near Iroquois Falls. I n February additional specimens were obtained from Meach Lake, 25 miles (40 km.) north of Ottawa. T h e snow-ice had been formed by natural flooding. Densities measured are shol\m in Table I.
'TABLE I. ~ E x s I ' I ' I I . ~ ~ OF SNOIV ICE PRObf MCKAY L ~ K E , MEACII LAKE A N D MIS~ANCO RIVER, OKTARIO
N o . o f JVO. of Auerage Siat~dar-d satnjles ~/1ecii71ens (Ietensily cicuiatiot~
g.Icm.3
McKay I.akc, var. lac. 9 9 0.889 0.010 McKay Lakr, I lac.
Mcach Lakc, var. loc.
lMistango Rivcr, I lac. I 2 0.900 -
Individual sample values ranged from o .870 to o .go2 g.Icm.3. The note "var. loc." means that the sa~riples were taken from several parts of the lake, "I loc." that only one sample (piece of ice) was taken. The standard deviation for the McKay Lake observations indicates that the variation within one big piece of ice was almost as large as that between specimens taken from various locations on the same lake.
Some snow-ice samples were taken from McKay Lake on 28 March, a day with heavy thaw. T h e snow-ice layer had a total thickness of I I cm. The upper 5 cm. was very soft and
it was possible to disaggregate this ice by hand; the lower layer was more solid. A sample was taken and stored in the cold room at -9.5" C. Density was then measured and found to be 0.806 g.lcm.3 in the soft layer and 0.877 g.Icm.3 in the hard layer.
Samples were also collected from three ice landings where flooding with pumps had been carried out. T h e observations are given in Table 11. T h e conditions on the ice landing at Lake Abitibi at the time of flooding were not recorded.
.%ow cot~ditions D e t ~ s i Q 0 . / ' rl/#roximn/e
whet1 Jlooditlg of 2CP II~:II/IICS lenz/~rra!ure
g./cm.' aficr flooding
Rivi+rc clu Sourrl No snow 0.894 I Not known Rivii.rr clu Sourtl I in. ( 2 . 5 cm.) new snow 0.890 I - lo3 C.
Rivit'rc clu Sourcl No s~low 0 ' 909 I -roo C .
Rivit'rc clu Sourcl 2 in. ( 5 cm.) new snow 0.894 I -3" C. Rivii.rc clu Sourcl I in. (2.5 c n ~ . ) new snow 0.886 I -rgr C.
Rivikrc clu Sourcl No snow 0.067 I - 1 2 ~ ' C.
blista~lgo Rivcr 8 in. (20 cm.) coarse-grainccl
$now 0.887 I -2j0 C.
Lakc .\bitibi S o t known 0.839 o S o t known
T h e samples were all collected in January. It is interesting that for the few samples obtained from the Rivikre clu Sourd site, no significant difference was observed I~ctween those prepared Ily flooding on snow-covered ice and those on bare ice. T h e thickness of the ice formed during each flooding varied from 3 . j to 6.0 cm. The average density of the artificially prepared part of the ice on liiviere d u Sourd was o .8go g.icm.3.
Samples were taken of naturally formed blue ice on McKay Lake and on liivikre du Sourd in December after a cold spell that produced about 2 0 cm. of blue ice on McKay Lake and 25 cm. on liivikre du Sourd. That from McKay Lake was completely free of air bubbles and had a density of o .CJI 8 g.,'cm.s, while the ice from liivikre du Sourcl contained longit~tdinal
bub1)les of varying size and frecluency through the whole sheet. T h e ice sample from R i v i h e du Sourd had an average density of 0 , 9 1 5 g./cm.", and the layer containing the greatest amount of bubbles had a density of o .g I I g./cm.n.
2 1 0 J O U R N A L O F G L A C I O L O G Y
Tests in the cold room
A series of tests was carried out in a cold room to discover to what degree different variables might influence the air content of the snotv-ice and thus its density. The influence of following variables was observed :
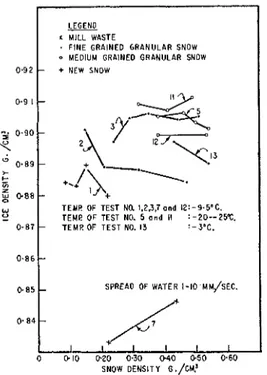
(a) The density of the snow. Under natural conditions snow density is usually between 0 . 1 0 to 0.40 g.Icm.3 and may reach 0.55 g.Icm.3 when compacted artificially. This range was covered in the tests.
I
LEGENO1 MILL WASTE
FINE GRAINED GRANULAR SNOW MEDIUM GRAINED GRANULAR SNOW
0.92 + NEW SNOW
TEMP OF TEST N a 1,ZJ;l and 12:-9.5'C. TEMP OF TEST NO. 5 a n d 11 : -20--25%.
- TEMP OF TEST NO. 13 :- 3%.
Fig. I . T h e de/~endetlce o f ice densily 017 inilial stzozu detzsiQ
(11) The size and shape of the snow particles. Under natural conditions this might range from fine-grained ( < 0 . 5 mm.) new snow to coarse-grained (2 -5 mm.) depth-hoar
snow. This range was covered in the tests. Very fine-grained ( x o . I mm.) waste from
an ice-milling machine was used also.
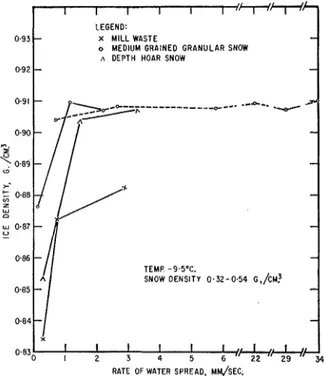
(c) The rate of spread of the water in the snow. In nat~rral flooding this rate is probably less than I mm./sec. in most cases. When flooding with pumps is carried out the speed
generally ranges between 5 and 50 mm./sec. The rates observed in the tests ranged from o .02 to 34 mm./sec.
(d) The rate of freezing of the slush (snow-water mixture). T h e rate of freezing might vary between 0 . 0 1 and 10 mm./hr. in the field. After artificial flooding of a snow cover on
top of the ice the freezing rate generally ranges between I and 5 mm./hr. I n most of
the tests the freezing rate of the slush was 2 to 3 mm./hr. T h e highest and lowest values observed were I and 8 rnm./hr.
Test procedure
A plastic cylinder with a height of 86 mm., a n inner diameter of 63 mm., and a perforated bottom was filled with snow. The cylinder was then lowered into a tank of water a t the same
D E N S I T Y O F N A T U R A L L Y A N D A R T I F I C I A L L Y F O R M E D FRESH-WATER I C E 2 1 1
speed as the water level rose in the snow until water reached the top of the container, i.e. the surface of the snow, T h e specimens and the water in the tank were then allowed to freeze from the top. The freezing time was generally between 18 and 24 hr. Air temperature in the cold room was approximately -9.5' C. A few specimens were prepared a t other temperatures, The water temperature at the start was between 0" C. and +pO C. A reference specimen of
clear water was usually frozen each time. The water used was the local drinking water.
X MILL WASTE
+ N E W SNOW
0 MEDIUM GRAINED GRANULAR SNOW n DEPTH HOAR SNOW
X
- TEMP: -9.5%.
SPREAD O F WATER I - IO MY/SEC.
SNOW DENSITY 0.09 - 0.54 G./cM?
-
T Y P E OF SNOW, GRAIN S I Z E MM
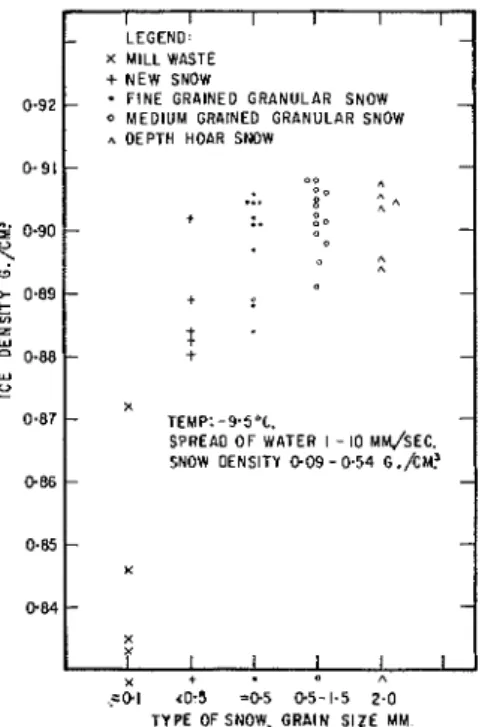
Fig. 2 . The depetrdet~ce qf ice densip on snow &,be
A few exceptions to the general test procedure were made:
(a) I n order to reach a rate of spread of water in the snow higher than 10 mm./hr. a snow-
filled sampler was kept vertical and the water was forced through the snow from the top by a hand pump. When the whole specimen was wetted the sampler was immedi- ately immersed in the water in the tank.
(11) I n some tests a "base" ice was prepared first in the lower half of the cylinders, then the remaining half was filled with snow. Water (0.0 to $ I .oO C.) was poured on the
ice kom the top on one side until the water level reached the top of the snow. T e s t reszllts
T h e test results are plotted in Figures I to 4 for the tests in which he ice could freeze
without restsictioil (no base ice). I n some cases the points in the graph are connected with lines; the points connected were obtained hom specimens fi-ozen at the same time and under identical conditions, the only factor varied being the one indicated on the graph.
T h e following conclusions have been drawn fi-om the observations:
(il A variation in the density of each snow type did not have any marked effect o n the density of the ice (Fig. I ) .
212 J O U R N A L O F G L A C I O L O G Y
T h e mill waste gave much lower values than all other types ofsnow tested. Within the range of snow types normally encountered under field conditions (new snow to coarse- grained depth-hoar snow) there was no significant difference in ice density, the values ranging between 0.88 and 0.91 g.lcm.3, with a slight trend to lower values for the fine-grained snow.
X M I L L WASTE
o MEDIUM GRAINED GRANULAR SNOW
n DEPTH HOAR SNOW 0.92
RATE OF WATER SPREAD, M ~ S E C .
Fix. 3. T h e de~~enclence o f ice clensily or1 /he rcrte of sl~recld qf wale,. in (he snozv
RATE OF GROWTH OF I C E , MM/HR.
Fig. 4. T t w cle!~ende~lre of rce derisi(v on /he rale of growtl o/ the Ice
(iii) The rate of spread of water sho~ved a significant influence on the resulting ice density for lower rates, in the range of values encountered in natural flooding (Fig. 3). For rates of spread in the range which occurs when flooding is carried out with pumps, no significant influence was found.
(iv) Within the limits used in the tests, the freezing rate of the slush had a minor iilfluence on resultitlg ice density, producing slightly lower values a t low freezing rates (Fig. 4).
T h e clear water specimens used as a check in most of the tests had a mean density of 0.917 g.lcm.3, with a standard error o f f 0 . 0 0 1 g.lcm.3. Variation in the air content of these
specimens could not be related to any of the factors measured.
For the four cases where the specimens were prepared on a base ice, freezing occurred 110th from the top and from the bottom, most of it from the top. A layer of air bubbles was formed where the interfaces met. I n clear water this layer was very pronounced. The density of the clear-water specimens, which were 30 to 40 mm. thick, averaged 0.910 g.Icm.3 showing a significant difference from the clear-~vater specimens prepared according to the standard test procedure. The air layer in the joint between the ice interfaces was far less pronounced in the snow-ice specimens and their density did not differ significantly fi-om the densities obtained for specimens prepared by unrestricted freezing. For granular snow and mill waste one series was carried out on base ice with a variation of the freezing rate from I to 6 mm./hr.
No significant influence on the final density was found within this range of rate of freezing. I n all tests reported above, the snow was completely saturated with water, that is the water level was at the snow surface. One test was carried out in which only the bottom of the cylinder was immersed and kept in the water. Results of this test, carried out a t -9 -5' C.
air temperature and o0 C. initial water temperature, are shown in Table 111.
Deso-$lion of snow De11siQ H~ight of D e n ~ i ; ~ qf
of snow ca/lillag~ z,e
layer
g.lcm.3 mm. g.Icm.3 Finc-grained (0.5 mm.) granular snow 0.50 86 0.879
Finc-grained (0.5 mm.) granular snow o . 24 42 Not measurable Fine-grained (0.5 mm.) granular snow 0.50 86 0.876
Fine-grained (0.5 mm.) granular snow 0.20 54 Not measurable Depth hoar (0.5-2 . o mm.) 0.54 86 0.880
Dcpth hoar (0.5-2. o mm.) o . 28 313 Not measurable
T h e lo\\r sno~v density values were obtained by pouring the snow into the cylinders while the high densities \\.ere obtained by compacting the snow in 2-cm. layers. The ice prepared from the loose snolv samples was very porous and a n adequate determination of the density xvas not considered possible. T h e samples ~ v i t h compacted s n o ~ v were wetted to the top (86 mm.) while the ~vater reached 38 to 54 mm. above the water surface in the samples with low density.
Snokv-ice is sometimes classified by eye according to its colour, i.e, dark and bright, and different strength properties are attributed accordingly. I t was not possible, however, to find any simple relationship between colour and density in these tests or the tests carried out by the author earlier (Ager, 1960). For example, ice made artificially by compacting and flooding might be bright white, while a dark and transparent snow-ice can be obtained by natural flooding, both types of ice having the same density. I n the first mentioned type of ice the air may be contained in many small bubbles and in the second in a few large bubbles.
T h e author tried a classification system where the frequencies of air-bubbles of different sizewere described as "abundant", "frequent", "local", "occasional" and "rare", a system which is often used in the description of plant communities. T h e size of the bubbles was estimated by eye. I t was found that the fi-ecluency of bubbles of I mm. size and larger had a significant
214 J O U R N A L O F G L A C I O L O G Y
influence on the density of the snow-ice. A classification based on bubble frequency and size may be a better basis for estimating the strength of snow-ice than one based on the colour. The Snow, Ice and Permafrost Research Establishment uses a system based on an estimation of the size and frequency of air bubbles. According to their system all the ice observed in these tests, except the few with a density lower than 0.86 g.lcm.3 fell within the range of "dense" to "very dense" ice (personal communication from G. 13. Frankenstein).
Field studies reported here and in earlier Swedish investigations indicate that the density of snow-ice formed either naturally or artificially is usually between 0.87 and 0.91 gm.lcm.3 and often between o .88 and o .go g./cm.3.* These values tend to be larger than those that have been reported in the literature. There is some indication that the density of snow-ice depends on the climate of the region in which it is formed (Butkovich, I 954, 1955 ; personal communica-
tion from G. B. Frankenstein).
Observations made under controlled conditions indicate that only for grain sizes less than
I mm. did grain size have a significant influence on the density of snow-ice. They showed also
that the density decreased with decreasing rate of water spread in the speed range normally encountered under natural floodiilg conditions, but is quite insensitive to rate of spread in the range normally encountered in artificial flooding operations. The density of the snow and the rate of freezing of the slush had a minor influence. Low density values may be obtained for snow-ice formed by capillary wetting of undisturbed snow with low density.
The observations on blue ice, formed naturally and in the cold room, suggest that density values between 0.90 and 0.92 g.lcm.3 will probably be the most frequent ones when the ice can freeze without restriction. For the case where water is cast on bare ice in layers a few centimeters thick, both laboratory tests and field observations indicate that values between 0.87 and o .91 g.Icm.3 may be found.
T h e author wishes to express his gratitude to the National Research Council of Canada, for the award of a post-doctorate fellowship, which made it possible to carry out this investi- A.
gation. Access to a well equipped cold room has been especially appreciated.
T h e author is also indebted to Mr. L. W. Gold and Mr. G. P. Williams, for helpful criti- cism and guidance in preparing this report and to Mr. R . Ducharme for his assistance in measuring densities.
This paper is a contribution from the Division of Building Research, National Research Council of Canada, and is published with the approval of the Director of the Division.
&IS. received 27 Jantlary 1gG2
R E F E R E N C E S
Ager, B. H. 1960. Studier over tatheten hos nBgra typer av is. Statens Skogsforskt~ingsinsti/~~t, dudelingen for Arbelslira, Serien Rap/)orter, Nr. 9.
Butkovich, T. R. 1954 Ultimatc strength of ice. U.S. Snow, Ice and Perrnafross Research Es~ablish~nen~. Research Pajer I I .
Rutkovich, T. R. I 9 5 5 Crushing strcngth of lakc icc. U.S. Snow, Ice and I'ertnafrosl Research Eslablishrnenl. Researclr . - .
Pal1er 1 5.
Tabata, T. 1958-60. Stuclies on mcchanical properties of sea icc. 11-V. Low Temjeratlo-e Science, Scr. A, Vol. 17,
p. 147-66; Vol. 18, p. 116-48; Vol. 19, p. 187-201.