HAL Id: inria-00563249
https://hal.inria.fr/inria-00563249
Submitted on 4 Feb 2011HAL is a multi-disciplinary open access archive for the deposit and dissemination of sci-entific research documents, whether they are pub-lished or not. The documents may come from teaching and research institutions in France or abroad, or from public or private research centers.
L’archive ouverte pluridisciplinaire HAL, est destinée au dépôt et à la diffusion de documents scientifiques de niveau recherche, publiés ou non, émanant des établissements d’enseignement et de recherche français ou étrangers, des laboratoires publics ou privés.
Graphs
Oana Andrei, Maribel Fernandez, Hélène Kirchner, Guy Melançon, Olivier
Namet, Bruno Pinaud
To cite this version:
Oana Andrei, Maribel Fernandez, Hélène Kirchner, Guy Melançon, Olivier Namet, et al.. PORGY: Strategy-Driven Interactive Transformation of Graphs. 6th International Workshop on Comput-ing with Terms and Graphs (TERMGRAPH 2011), Apr 2011, Saarbrücken, Germany. pp.54-68, �10.4204/EPTCS.48.7�. �inria-00563249�
To appear in EPTCS.
c
Andrei et al.
This work is licensed under the Creative Commons Attribution License.
of Graphs
∗ Oana Andrei† [email protected] Maribel Fernández‡ [email protected] Hélène Kirchner§ [email protected] Guy Melançon§ [email protected] Olivier Namet‡ [email protected] Bruno Pinaud§ [email protected]This paper investigates the use of graph rewriting systems as a modelling tool, and advocates the embedding of such systems in an interactive environment. One important application domain is the modelling of biochemical systems, where states are represented by port graphs and the dynamics is driven by rules and strategies. A graph rewriting tool’s capability to interactively explore the features of the rewriting system provides useful insights into possible behaviours of the model and its properties. We describe PORGY, a visual and interactive tool we have developed to model complex systems using port graphs and port graph rewrite rules guided by strategies, and to navigate in the derivation history. We demonstrate via examples some functionalities provided by PORGY.
1
Introduction
Graphical formalisms are widely used for describing complex structures in a visual and intuitive way,
e.g., UML diagrams, representation of proofs, microprocessor design, XML documents, communica-tion networks, data and control flow, neural networks, biological systems, etc. Graph transformacommunica-tion (or graph rewriting) is a fundamental concept in concurrency and computational models, as well in mod-elling the dynamics of complex system in general. From a theoretical point of view, graph rewriting has solid logic, algebraic and categorical foundations [10, 25], and from a practical point of view, graph transformations have many applications in specification, programming, and simulation [12, 13]. Sev-eral graph-transformation languages and tools have been developed, such as PROGRES [26], AGG [14], Fujaba [22], GROOVE [24], GrGen [19] and GP [23], only to mention a few.
When the graphs are large or growing via transformations, or when the number of transformation rules is important, being able to directly interact with the rewriting system becomes crucial to understand the changes in the graph structure. From a naïve point of view, the output of a graph rewriting system is a dynamic graph: a sequence of graphs obtained through a series of topological modifications (addi-tion/deletion of nodes/edges). However, the study of a rewriting system is actually much more complex. Reasoning about the system’s properties actually involves testing various rewriting scenarios, backtrack-ing to a previously computed graph, possibly updatbacktrack-ing rules, etc. In this paper, we address these issues. Our main contribution is a solution to these problems via a strategy-driven interactive environment for the specification of graph rewriting systems: PORGY.
∗Partially supported by INRIA’s Associate team program (seehttp://gravite.labri.fr/?Projects_%2F_Grants:
Porgy) and the French National Research Agency project EVIDEN (ANR 2010 JCJC 0201 01).
†School of Computing Science, University of Glasgow, Glasgow G12 8RZ, UK ‡King’s College London, Department of Informatics, Strand, London WC2R 2LS, UK
Our work emerged from the necessity to assemble different views on the rewriting system and rele-vant interactions. First of all, an appropriate formalism and associated structures are needed to represent and manipulate graph rewriting systems and rewriting sequences. Our approach is based on the use of port graphs and port graph rewriting rules [1, 4]. We support our claim on the generality of this concept by using port graph transformations for modelling biochemical interactions that take part in the regula-tion of cell proliferaregula-tion and transformaregula-tion. This case study illustrates the highly dynamic context and some interesting challenges for graph visualisation provided by biochemical systems. PORGY provides support for the initial task of defining a set of graph rewriting rules, and the graph representing the initial state of the system (the “initial model” in PORGY’s terminology), using a visual editor.
Other crucial issues concern when and where rules are applied. To address this problem, PORGY provides a strategy language to constrain the rewriting derivations, generalising the control structures used in PROGRES, GP and rewrite-based programming languages such as Stratego and ELAN. In partic-ular, the strategy language includes control structures that facilitate the implementation of graph traversal algorithms, thanks to the explicit definition of “positions” in a graph, where rules can be applied (we re-fer the reader to [17] for examples of graph programs in PORGY, and to [16] for the formal semantics of the strategy language).
Rewriting derivations can also be visualised, and used in an interactive way, using PORGY’s inter-face. Designing a graph transformation system is often a complex task, and the analysis and debugging of the system involves exploring how rules operate on graphs, analysing sequences of transformations, backtracking and changing earlier decisions. For this purpose, PORGY’s visual environment offers a view on the rewriting history and ways to select time points in the history where to backtrack.
The organisation of this paper is as follows. In Section 2, we recall the concept of port graph and port graph transformations, and use this formalism to model the scaffold protein AKAP in the process of mediating a crosstalk between the cAMP and the Raf-1/MEK/ERK signalling pathway. In Section 3 we describe PORGY’s strategy language. In Section 4, we focus on the visualisation and interaction features designed to better understand the model and its behaviour. Section 5 discusses related work and compares PORGY to the similar approaches we are aware of. Finally, Section 6 concludes and describes future work.
2
Port Graph Rewriting
The basic constructs of the PORGY environment are the concept of port graph and the port graph rewrit-ing relation that we recall in this section.
Informally, a port graph is a graph where nodes have explicit connection points called ports for the edges and a p-signature is a mapping which associates a set of port names to a node name.
Definition 1 (P-Signature[1, 5]) Let ∇N be a set of constant node names, ∇P a set of constant port
names, and XP and XN two sets of port name variables and node name variables, respectively. A p-signature is a pair of sets of names ∇X = h∇N ∪ XN, ∇P∪ XPi such that each node name N ∈ ∇N ∪ XN comes with a finite set of port names Interface(N) ⊆ ∇P∪ XP.
Definition 2 (Port Graph [1, 5]) Given a fixed p-signature ∇X, a labelled port graph over ∇X is a tuple G= hVG, EG, lvG, leGi where:
• VGis a finite set of nodes;
• EGis a finite multiset of edges,
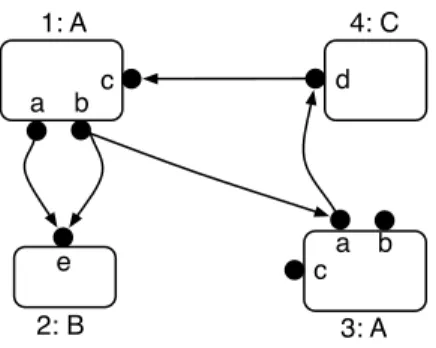
1: A a b c 4: C d 3: A a b c e 2: B
Figure 1: A port graph over the p-signature ∇ = h{A, B,C}, {a, b, c, d, e} with Interface(A) = {a, b, c},
Interface(B) = {e}, Interface(C) = {d}, and 1, 2, 3, 4 the node identifiers.
• lvG: VG→ ∇N ∪ XN is a node-labelling function associating to a node a name and a set of ports
according to the p-signature;
• leG: EG→ (∇P∪ XP) × (∇P∪ XP) is an edge-labelling function associating to an edge the
pair of port names where it connects to the nodes, i.e. leG(h(v1, p1), (v2, p2)i) = (p1, p2).
A simple example of a port graph is depicted in Fig. 1. Port graphs were first identified as an abstract view of proteins and molecular complexes resulting from the protein interactions in a biochemical setting. From a biochemical perspective, a protein is characterised by a collection of functional domains also called sites. Two proteins may interact by binding on complementary sites. Then a protein with binding sites is graphically modelled by a node with ports, and a bond between two proteins by an edge in a port graph. A port can also just carry some information from a set of attributes instead of being a connection or binding point. For instance, two proteins may interact just by changing the attribute information of a site, from phosphorylated (P or “+”) to unphosphorylated (U or “−”) and vice versa. This view is at the origin of several formalisms for biology, such as the κ-calculus [11] and BioNetGen [15]; see also [8, 3], where graph models have been designed to simulate a chemical reactor using rule-based systems and strategies.
Example 3 (AKAP model: species as port graphs) We illustrate port graphs and port graph rewriting
for modelling a biochemical network in a simplified model of the scaffold-mediated crosstalk between the cyclic adenosine monophosphate (cAMP) and the Raf/MEK/ERK pathway [2]. This interaction has an important role in the regulation of cell proliferation, transformation and survival. Let us call this simplified biochemical model the AKAP model. The chemical species occurring in the AKAP model
are: scaffold protein AKAP with three binding sites; nucleotide cAMP with one binding site; protein
PKA with one site for binding to the scaffold and one site for binding to cAMP; enzyme PDE8 with one
site for binding to the scaffold and one phosphorylation site; Raf-1 protein with two sites: one for binding to the scaffold and the other for phosphorylation; signal protein SA. The AKAP scaffold protein binds the three molecules PKA, PDE8 and Raf-1. Although these molecules are not all proteins, we model them as nodes with ports in port graphs by abstracting the signal transfer as binding actions between their ports. In Fig. 2 we show a port graph representation of a state of the AKAP model.
Definition 4 (Port graph rewrite rule [1, 5]) A port graph rewrite rule L⇒ R is a port graph
consist-ing of two port graphs L and R over the same p-signature and one special node⇒, called arrow node
AKAP PKA PDE8 Raf-1 cAMP SA cAMP -AKAP PKA PDE8 Raf-1 cAMP SA + + SA PDE8 -PDE8
-Figure 2: Port graph representation for the chemical species in the AKAP model where a port with a plus sign stands for a phosphorylated site and a minus sign for unphosphorylated. In this graphical representation we omitted the port names as there is no risk of confusion.
the following characteristics: for each port p in L, to which corresponds a non-empty set of ports
{p1, . . . , pn} in R, the arrow node has a unique port r and the incident directed edges (p, r) and (r, pi),
for all i= 1, . . . , n; all ports from L that are deleted in R are connected to the black hole port of the arrow
node.
Aport graph rewrite system R is a finite set of port graph rewrite rules.
Intuitively, the arrow node together with its adjacent edges embed the correspondence between ele-ments of L and eleele-ments of R. When the correspondence between ports in the left- and right-hand side of the rule is obvious we omit the ports and edges involving the arrow node.
Let G and H be two port graphs defined over the same p-signature. A port graph morphism f : G→ H relates the elements of G to elements of H by preserving sources and targets of edges, constant node names and associated port name sets up to a variable renaming. We say that G and H are homomorphic when any two ports are connected in G if and only if their f -images are connected in H.
We now informally recall the port graph rewriting relation from [1]. Let L⇒ R be a port graph rewrite rule and G a port graph such that there is an injective port graph morphism g from L to G. By replacing the subgraph g(L) of G by g(R) and connecting it with the rest of the graph as indicated by the interface of the rule, we obtain a port graph G′representing a result of one-step rewriting of G using the rule L⇒ R, written G →L⇒RG′. Several injective morphisms g from L to G may exist leading to possibly different rewriting results. These are built as solutions of a matching problem from L to a subgraph of
G. If there is no such injective morphism, we say that G is irreducible with respect to L⇒ R. Given a set R of rules, a port graph G rewrites to G′, denoted by G→R G′, if there is a port graph rewrite rule
rin R such that G→rG′. This induces a transitive relation on port graphs. Each rule application is a
rewriting step and a derivation is a sequence of rewriting steps, also called a computation. A port graph is in normal form if no rule can be applied on it. Rewriting is intrinsically non-deterministic since several subgraphs of a port graph may be rewritten under a set of rules.
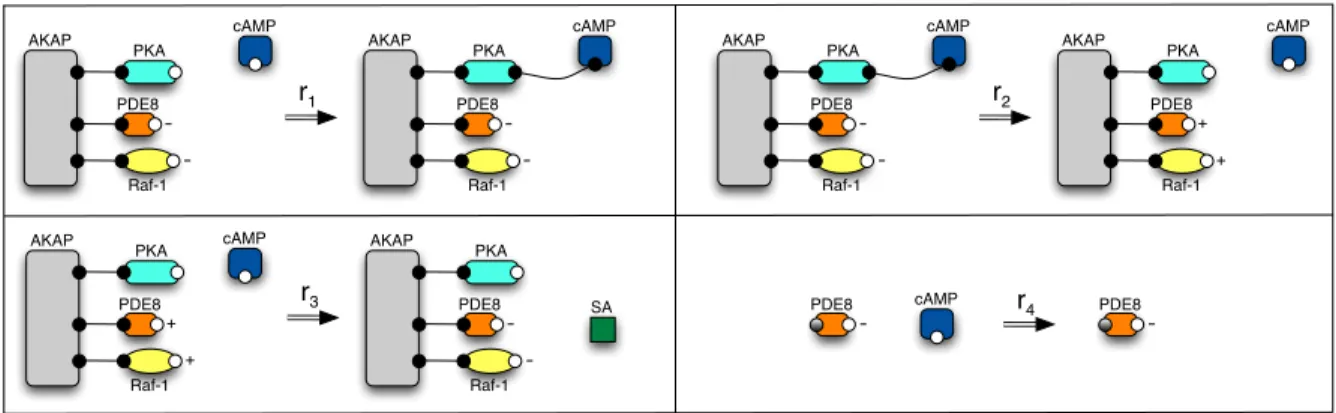
Example 5 (AKAP model: reactions as port graph rewrite rules) We consider the following four
chemical reactions:
(r1) cAMP activates PKA through binding;
(r2) active PKA phosphorylates PDE8 and Raf-1 on the same scaffold and becomes inactive;
(r3) phosphorylated PDE8 degrades free cAMP and becomes unphosphorylated as well as Raf-1 at
AKAP PKA PDE8 Raf-1 cAMP -AKAP PKA PDE8 Raf-1 cAMP r1 -AKAP PKA PDE8 Raf-1 cAMP -AKAP PKA PDE8 Raf-1 cAMP r2 -+ + AKAP PKA PDE8 Raf-1 cAMP AKAP PKA PDE8 Raf-1 r3 -+ + SA PDE8 cAMP r4 -PDE8
-Figure 3: Port graph representation for the biochemical reactions in the AKAP model.
(r4) unphosphorylated PDE8 degrades free cAMP (we represent the binding site for PDE8 in a shade
of grey meaning that unphosphorylated PDE8 has the same behaviour in the presence of a cAMP molecule if it is bound or not to the AKAP protein).
These reactions are graphically represented as port graph rewrite rules in Fig. 3. A phosphorylation action activates a site (or port) and we represent this graphically by changing the attribute “−” of a site
(or port) into “+”; an unphosphorylation event does the opposite. In Fig. 3 we only give a schematic
representation of the rule, whereas in Fig. 4 we detail the port graph rewrite rule correspoding to reaction
r4: the arrow node is included together with two ports for showing correspondence between the two sites
of PDE8 on both sides of the rule, as well as the black hole (bh) port which is responsable for deleting the only one site of cAMP and, in consequence, the entire molecule cAMP.
PDE8 cAMP
r
4 -PDE8 -bhFigure 4: Reaction r4 as a port graph rule with explicit arrow node and black hole (bh) port.
An overview of AKAP’s behaviour is as follows. Free cAMP activates PKA by binding to its free port. When PKA becomes active, it phosphorylates PDE8 and Raf-1 if all bound to the same AKAP protein. The amount of PDE8 may be greater than the amount of AKAP which means that the PDE8 proteins not on the scaffold protein will never be phosphorylated. PDE8 in either state degrades cAMP, but phosphorylated PDE8 degrades approximately three times more cAMP than unphosphorylated PDE8 does. This information is expressed as the following statement: rule r3 is three times faster than r4
in a stochastic context, orrule r3 has 75% chances of occurrence whereas r4 only 25% chances. As Raf-1 becomes unphosphorylated, the pathway Raf-1/MEK/ERK is activated and the signalling cascade
Time courses from the laboratory experiments suggest the presence of a pulsating behaviour in the system. The pulsations ensure that the state of the Raf-1/MEK/ERK pathway alternates between active and inactive (note: very long periods of activity or inactivity may increase the risk of disease). This expected property of the model translates into alternating short periods of time where the number of the signal SA increases (active pathway) and times where it remains constant (inactive pathway).
At this point, a comparison of the structure of port graphs with other graphical formalism needs to be included. A port graph can be seen as a multigraph, thus inheriting the theoretical results available for graph transformations, such as confluence, or parallel independency of rewriting steps; for more details see [1, 5]. A graph structure similar to port graphs but with a more restrictive definition of rewrite rules and rewriting relation can be found in the context of reserved graph grammars (RGG) [28] – a class of context-sensitive graph grammars well suited for describing and efficiently implementing diagrammatic visual programming languages. The graphs used in RGGs are based on two-level nodes: a node is made up of vertices and vertices can be interconnected; one vertex is distinct for representing the node itself, called super vertex. The application domain of RGGs imposes the graph rewrite rules to be locally confluent and vertices in a RGG rule can be marked which means at matching the incidence degree has to match as well, ensuring that no dangling edges will occur after a graph transformation.
In [1] a suitable (strategic) rewriting relation and an abstract calculus have been defined on port graphs. This formalism is powerful enough to model biochemical applications and generation of bio-chemical networks, as well as self-management properties of autonomic systems [4, 5].
In the study of biochemical networks, the PORGY environment allows controlled network generation and in silico experiments with different priorities or probabilities of rule applications. We expect to be able to answer typical questions asked by biologists, such as, in the previous example, find the derivations leading to a constant alternation between active and inactive pathway.
Another main application domain for port graph rewriting and the PORGY environment, besides the biochemical networks, is the Interaction Nets [21, 17]. These applications, amongst others, motivate our choice of port graphs as a basis for modelling complex systems and for prototyping their evolution (port graph rewriting provides executable specifications). In order to support the various tasks involved in the study of a port graph rewriting system, we suggest to combine different points of view on the system:
• to explore a derivation tree with all possible derivations,
• to perform on-demand reduction using a strategy language which permits to restrict or guide the reductions,
• to track the reduction throughout the whole tree,
• to navigate in the tree, for instance, backtracking and exploring different branches. These capabilities are developed in the remaining of this paper.
3
Strategies
In this section, we present a strategy language that controls the application of rules from a graph rewriting system [17]. This language was designed to cover a wide range of graphs, but with the main application domains of port graphs in mind, such as biochemical networks and Interaction Nets.
In the PORGY environment, the user creates a graph-program from a strategy over a graph rewriting system, a graph and a position. In the following, we first review the strategy language and then give examples of graph-programs.
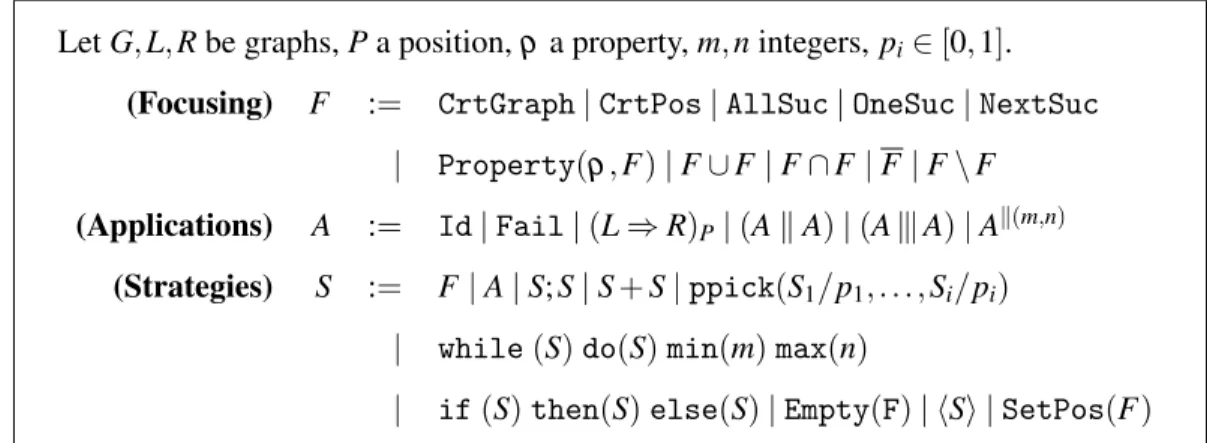
Let G, L, R be graphs, P a position, ρ a property, m, n integers, pi∈ [0, 1].
(Focusing) F := CrtGraph| CrtPos | AllSuc | OneSuc | NextSuc | Property(ρ, F) | F ∪ F | F ∩ F | F | F \ F
(Applications) A := Id| Fail | (L ⇒ R)P| (A k A) | (A 9 A) | Ak(m,n)
(Strategies) S := F| A | S; S | S + S | ppick(S1/p1, . . . , Si/pi)
| while(S) do(S) min(m) max(n)
| if(S) then(S) else(S) | Empty(F) | hSi | SetPos(F)
Figure 5: Syntax of the strategy language.
In term rewriting, by default the rewriting is performed at the root position of a term. Then one may use term traversal strategies such as top-down, bottom-up, etc., in order to apply rules or strategies at particular positions in a term. Graphs generalise the tree-like structure of terms and lose the notion of root as absolute position. In order to overcome this, we consider a generalisation of the notion of position, and define located graphs.
Definition 6 (Located graph) Let G be a graph and P a subgraph of G representing the position where
a strategy is to be applied. Then the structure G[P] is called a located graph.
Thus, any subgraph of a graph G can be used as a position P to apply a rewrite rule. The notion of position allows us to focus on specific parts of a graph under study, in order to apply rewrite rules. Considering a located graph G[P] to be rewritten, we require that the homomorphic image of the left-hand side of the rule has a non-empty intersection with the subgraph P. A simple and intuitive example is to define P as consisting of a specific node in G, and in this case, only the rules having this node in the homomorphic image of their left-hand sides are allowed to be applied. The application of a strategy on a graph G may change the subgraph P in G: our strategy language includes operators not only to select rules and the position where the rules are to be applied, but also to change the focus of the rewriting engine along a derivation.
Figure 5 shows the grammars F, A and S for generating expressions to define positions, to apply rules and to define general strategies. A focusing expression defines a position subgraph, whereas an
applicationmay change both the graph and the positions. A strategy embeds the previous constructs and combines them using sequential composition, iteration and conditionals. In the following we describe informally the semantics of each operator in the language and give examples.
Focusing. The expressions generated by F allow us to focus on different parts of the graph during the rewriting process. These constructs are functions from located graphs to port graphs: an expression
F applies to a located graph G[P] to produce a new graph P′. They are used in strategy expressions to change the position P where rules apply and to specify different types of graph traversals. CrtPos returns the position in the current located graph. AllSuc returns immediate successors of all nodes in the current position, where an immediate successor of a node v is a node u with a port connected to a port of v. OneSuc looks for all the immediate successors of all nodes in the current position and picks one of those non-deterministically. NextSuc computes successors of nodes in the current position using a function that designates a specific port for each node. Property(ρ,Y ) is a filtering construct, that returns a subgraph of G containing only the nodes from Y that satisfy the decidable property ρ (Y would
generally be P or G, but can be any graph returned by an expression F). ρ typically tests a property on nodes allowing us, for example, to select the subgraph of red nodes. The set theory operators union,
intersection, complement and substraction apply to positions, considering that those graphs are sets of nodes and edges.
Applications. The application of Id on a located graph never fails and leaves the graph unchanged whereas Fail always fails (it leaves the graph unchanged and returns failure). (L ⇒ R)Qwhere Q is a
subgraph of R, represents the application of the rule L⇒ R at the current position P in a located graph
G[P] where the morphism g is chosen such that g(L) ∩ P is not empty; the current position becomes (P \ g(L)) ∪ g(Q). If more than one application is possible, one is non-deterministically selected from the set of possible results. The other results are then used if there is a backtrack, that is, if a failure arises.
Ak A′ represents simultaneous application of A and A′ on disjoint (i.e. not connected) subgraphs of G and returns Id only if both applications are possible and Fail otherwise. A9 A′ is a weaker version of
Ak A′as it returns Id if at least one application of A or A′ is possible. Ak(m,n) applies A simultaneously a minimum of m and a maximum of n times. If the minimum is not satisfied then Fail is returned and Id otherwise. If n is a negative integer then no maximum is considered. In the current implementation, these concurrent applications are done for rules only, i.e. for an elementary kind of strategies. Extending these constructions to full strategies needs further exploration.
Strategies. The expression S; S′represents sequential application of S followed by S′, and S+ S′applies whatever S or S′ that returns Id: if both fail then Fail is returned and if both are successful then one of them is picked non-deterministically. When probabilities p1, . . . , pn∈ [0, 1] are associated to strategies
S1, . . . , Snsuch that p1+ . . . + pn= 1, the strategy ppick(S1/p1, . . . , Sn/pn) non-deterministically picks
one of the strategies for application, according to the given probabilities. For iterations, we have expres-sions of the form while(S) do(S′) min(m) max(n) which keep on sequentially applying S′ for as long as the expression S rewrites to Id; if the minimum of m successful applications of S′is not satisfied then it returns Fail or else Id is returned. Similar to A||(m,n), setting n to a negative integer eliminates the maximum. The strategy if(S) then(S′) else(S′′) checks if the application of S to a located graph G[P] returns Id in which case S′ is applied to G[P] otherwise S′′is applied. S is only tested on G[P] and does not actually change the located graph. Empty returns Id if the current position is empty and Fail oth-erwise. This can be used for instance inside the condition of an if or while, to check if the application of the strategy makes the current position empty or not, instead of checking if the strategy itself can be applied. The strategyhSi applies S and considers S as one atomic rewriting step in the derivation tree. This is useful to abstract several reduction steps as one for visualisation purposes. SetPos(P) changes the current position to a new position P.
Definition 7 (Graph-program) A graph-program is a pair[SR, G[P]] where SR is a strategy expression
built over a graph rewriting system R and G[P] a located graph. The result of the execution of a
ter-minating graph-program is another graph-program of the form[Id, G′[P′]] or [Fail, G′[P′]] such that
G′[P′] has been obtained by the application of S
R on G[P].
The semantics of the strategy constructors defined by the grammars in Fig. 5 has been formally defined in [16] using rewrite rules that reduce a graph-program[S, G[P]].
The notion of graph-program defined above is very general, and the language allows programmers to define high-level algorithms in a variety of application domains. For examples of programs developed using this language, we refer the reader to [17]. Below we describe an example that exploits the features of the language to simulate the behaviour of a biochemical system.
Example 8 (Strategy for the AKAP model) In the AKAP model introduced in Sect. 2 the initial port
graph G0to be rewritten consists of: 200 unbound cAMP molecules; 10 structures built upon an AKAP
protein binding an inactive PKA, an unphosphorylated PDE8 and an unphosphorylated Raf-1; and 3 unphosphorylated PDE8 proteins not bound to an AKAP scaffold protein.
From the lab experiments, the biologists concluded that phosphorylated PDE8 degrades three times more cAMP than the unphosphorylated PDE8, in other words reaction rule r3is three times faster than
reaction rule r4in a stochastic setting. We model this behaviour in a probabilistic setting via the strategy
construct ppick which applies the rule r3 with probability 0.75 and the rule r4 with probability 0.25.
We remark that r1 and r4have a critical pair, therefore we use the strategy ppick with probability 0.5
for each of the rules; the same reasoning goes for r2and r4 in the presence of a free cAMP molecule.
In order to generate the biochemical network, we repeat the applications of all rules according to their application probabilities until we reach a normal form. Therefore the strategy for the AKAP model has the following form:
SAKAP = repeat∗(ppick(r1/0.5, r4/0.5), ppick(r2/0.5, r4/0.5), ppick(r3/0.75, r4/0.25))
where repeat∗(S) is syntactic sugar for while(S) do(S) min(1) max(−1). We show the result of the
application of SAKAP on G0 in Sect. 4 as well as a procedure to analyse the results by counting the
number of signal proteins SA during the execution.
4
Working with the PORGY platform
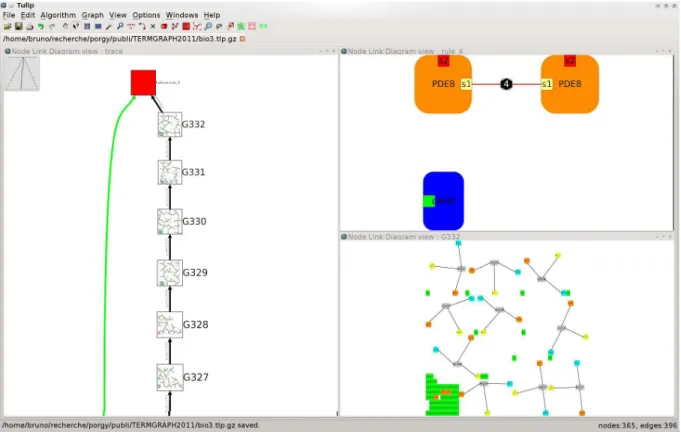
One of the goals of PORGY is to allow the user to interact and experiment with a port graph rewriting system in a visual and interactive way. Ideally, a visual environment should offer different views on each component of the rewriting system: the current graph being rewritten, the derivation tree and the rules as shows the overview (for the AKAP model) in Figure 6. The application of rules is performed based on an ad hoc matching algorithm finding instances of left-hand sides of rules in a port graph. Our matching algorithm is based on the work of Ullman [27] and Cordella et al. [9]. A detailed discussion of our matching algorithm is out of scope here.
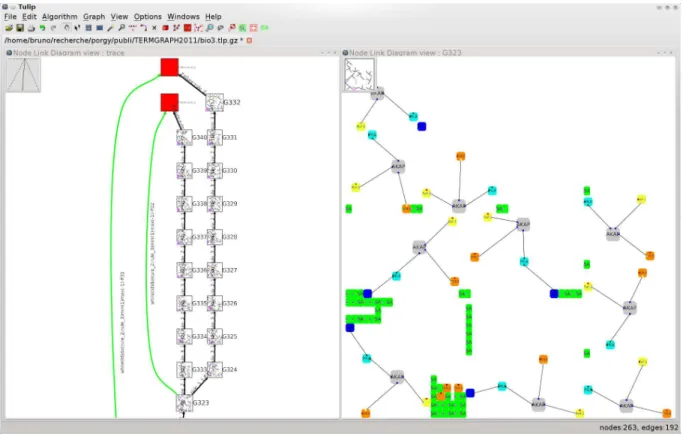
As the figure shows, the normal form of G0is found, after the strategy SAKAPhas been successfully applied with SAKAPand G0 defined in Example 8. Due to its design, the strategy terminates on a failure because no more rules apply. The failure is made explicit by showing a red node as part of the trace tree (the graph shown on the left pane). We make use of a quotient graph to embed the states of G into nodes of the trace tree (nodes G327 to G332). Thus, when scanning graphs along a branch, one can read the evolution of the graph being rewritten and explore the effect and properties of a strategy. A local and more detailed view allows a closer examination of a particular state of G (graph G332 in the lower right pane).
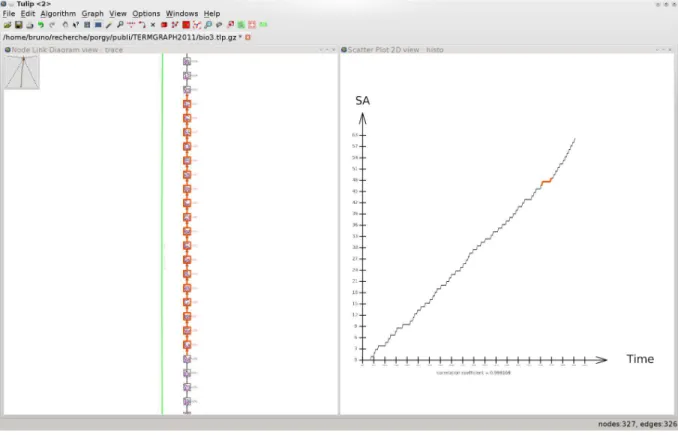
Typically, the user may be interested in plotting the evolution of a parameter computed out of each intermediary state. For example, going back to the AKAP model (Example 5) the behaviour of the SA protein, as predicted by the biologists, can be examined by plotting the curve of the evolution of the number of SA protein throughout the rewriting process (Figure 7).
The interactive features of PORGY simplify the study of the rewriting system partly due to a syn-chronisation between the different views. For example, selecting points on the plot view (Fig. 7) triggers the selection of the corresponding nodes in the trace tree. Such a mechanism obviously helps to track properties of the output graph along the rewriting process. Alternate strategies can be applied from any current or past state (see Fig. 8).
Figure 6: Overview of the PORGY environment. The graph at the bottom right (G332) corresponds to the normal form of G0 after application of the strategy SAKAP (see Example 8). The left panel shows part of a derivation tree, with nodes of the tree containing the last intermediate states of G. The top right panel corresponds to the rule r4.
The system we are currently developing is built on top of the Graph Visualisation framework Tulip [6]1. Specific plugins have been designed and developed to implement the various interaction required to simulate and study port graph rewriting systems. Because Tulip does not handle port graph directly, each port node is built from several standard nodes, while implementation details exploiting Tulip’s built-in graphical features have been kept hidden to the user.
5
Related Work
There are several tools available for editing graphs, of which some allow users to model graph transfor-mations. In this section we review the ones that are similar in scope with PORGY.
GROOVE [24] is centered around the use of simple graphs for modelling the design-time, compile-time, and run-time structure of object-oriented systems. The GROOVE tool set includes an editor for creating graph production rules, a simulator for visually computing the graph transformations induced by a set of graph production rules, a generator for automatically exploring state spaces, a model checker for analysing the resulting graph transformation systems and an imaging tool for converting graphs to images. Visualisation is not its main objective, and after each rewrite step the user must update the
Figure 7: Evolution of the number of signal protein SA when applying the strategy presented in Exam-ple 8 – until a graph in normal form is found.
layout of the graph by hand. The model transformations and the operational semantics are based on graph transformations. GROOVE permits to control the application of rules, via a control language with sequence, loop, random choice, conditional and simple (non recursive) function calls. These are similar to PORGY’s constructs, but the main difference is that GROOVE’s language does not include the notion of position, it is not possible to specify a position for the application of rules within the language. Tracing is possible through state space exploration.
Fujaba [22] Tool Suite is an Open Source CASE tool providing developers with support for model-based software engineering and re-engineering. It combines UML class diagrams, UML activity dia-grams, and a graph transformation language and offers a formal, visual specification language that can be used to completely specify the structure and behaviour of a software system under development. Graphs and rules are used to generate Java code. Fujaba has a basic strategy language, including condi-tionals, sequence and method calls. There is no parallelism, and again one of the main differences with PORGY is that Fujaba does not include a notion of position to guide the rule application.
AGG [14] is a rule-based visual language supporting an algebraic approach to graph transformation, and is aimed at specifying and implementing applications with complex graph-structured data. AGG may be used as a general purpose graph transformation engine in high-level JAVA applications employing graph transformation methods. Rule application can be controlled by defining layers and then iterating through and across these layers. Again, the position can not be specified and there is no control on the search for redexes.
Figure 8: The green edges in the derivation tree (the graph on the left and the green edges are the edges on the left of this graph) represent the start and end of previously applied strategies. The other edges of the derivation tree represent the application of a single rewriting rule between two states of G.
PROGRES [26] project works on the theoretical foundations as well as the practical implementation of an executable specification language based on graph rewriting systems (graph grammars). It combines EER-like and UML-like class diagrams for the definition of complex object structures with graph rewrite rules for the definition of operations on these structures. PROGRES allows users to define the way rules are applied (it includes non-deterministic constructs, sequence, conditional and looping) but it does not allow users to specify the position where the rule is applied. It is a very expressive language and also includes a tracing functionality through backtracking.
GrGen.NET [19] is a programming tool for graph transformation designed to ease the transfor-mation of complex graph structured data as required in model transfortransfor-mation, computer linguistics, or modern compiler construction, for example. It is comparable to other programming tools like parser gen-erators which ease the task of formal language recognition. GrGen.Net has a rule application language with constructs for sequential, logical and iterative application.
GP [23] is a rule-based, non-deterministic programming language. Programs are defined by sets of graph rewriting rules and a textual expression that describes the way in which rules should be applied to a given graph. The simplest expression is a set of rules, and this means that any of the rules can be applied to rewrite the graph. The language has three main control constructs: sequence, repetition and conditional (if-then-else), and it has been shown to be complete. It uses a built-in Prolog-like backtracking technique: if at some point no rule can be applied, it backtracks to the nearest point where there was a choice of redex (users cannot easily handle the derivation tree or change the backtracking algorithm).
GReAT [7] is a tool for building model transformation tools. First, one has to specify the meta-models of the input and target meta-models (using UML style class diagrams) and give rules to specify the transformation. Rules are pairs of typed, attributed graphs. Then, the pattern-matching algorithm always starts from specific nodes called “pivot nodes”. Rule execution is sequenced and there are conditional and looping structures.
PORGY and its strategy language allow a higher expressive power with its focus on position. Strate-gies are not limited to picking random applications but can travel through the graph in a dynamic and strategic manner to apply rules and sub-strategies. PORGY has also a strong focus on visualisation and scale, thanks to the TULIP back-end which can handle large graphs with millions of elements and comes with powerful visualisation and interaction features. Some of Tulip’s built-in functionalities, such as selecting some nodes in a visualisation for highlighting the equivalent nodes in the trace tree, give the user an immediate visual feedback (Fig 7).
6
Conclusion and Future Work
The PORGY environment provides an interactive visual environment for graph transformations. In this paper we presented the main concepts underlying PORGY: port graph rewriting and strategies for graph rewriting.
The PORGY environment is yet under development. A first implementation of the strategy language is available but needs further improvement. From the visualisation point of view, we are working on enhancing the algorithms for drawing rules and models.
Verification and debugging tools for avoiding conflicting rules or non termination for instance are also planned in the future. Moreover we will address other application domains: for instance linguis-tics analysis [18] shares some of the features of biological networks and we expect to be able to handle linguistic models in PORGY without much difficulty. PORGY already provides information about the number of matching solutions for the application of a rule. Based on this information we plan to ex-tend a port graph rewriting system with a stochastic semantics [20] which is very useful for developing biochemical models.
References
[1] Oana Andrei (2008): A Rewriting Calculus for Graphs: Applications to Biology and Autonomous Systems. Ph.D. thesis, Institut National Polytechnique de Lorraine. Available athttp://tel.archives-ouvertes. fr/tel-00337558/fr/.
[2] Oana Andrei & Muffy Calder (2010): A Model and Analysis of theAKAP Scaffold. In: Proc. of CS2Bio’10. To appear in Electronic Notes in Theoretical Computer Science.
[3] Oana Andrei, Liliana Ibanescu & Hélène Kirchner (2006): Non-intrusive Formal Methods and Strategic
Rewriting for a Chemical Application.In Kokichi Futatsugi, Jean-Pierre Jouannaud & José Meseguer, editors:
Algebra, Meaning, and Computation. Lecture Notes in Computer Science 4060, Springer, pp. 194–215.
[4] Oana Andrei & Hélène Kirchner (2009): A Higher-Order Graph Calculus for Autonomic Computing. In M. Lipshteyn, V.E. Levit & R.M. McConnell, editors: Graph Theory, Computational Intelligence and
Thought. Lecture Notes in Computer Science 5420, Springer, pp. 15–26.
[5] Oana Andrei & Hélène Kirchner (2009): A Port Graph Calculus for Autonomic Computing and Invariant
Verification. In: Proceedings of the Fifth International Workshop on Computing with Terms and Graphs
[6] David Auber (2003): Tulip – A huge graph visualization framework. In P. Mutzel & M. Jünger, editors:
Graph Drawing Software. Mathematics and Visualization Series, Springer Verlag, pp. 105–126.
[7] Daniel Balasubramanian, Anantha Narayanan, Christopher P. van Buskirk & Gabor Karsai (2006): The
Graph Rewriting and Transformation Language: GReAT. ECEASST 1.
[8] Olivier Bournez, Guy-Marie Côme, Valérie Conraud, Hélène Kirchner & Liliana Ibanescu (2003): A
Rule-Based Approach for Automated Generation of Kinetic Chemical Mechanisms.In Robert Nieuwenhuis, editor:
RTA. Lecture Notes in Computer Science 2706, Springer, pp. 30–45.
[9] L. P. Cordella, P. Foggia, C. Sansone & M. Vento (2004): A (Sub)Graph Isomorphism Algorithm for Matching
Large Graphs. IEEE Trans. on Pattern Analysis and Machine Intelligence 26(10), pp. 1367–1372.
[10] Bruno Courcelle (1990): Graph Rewriting: An Algebraic and Logic Approach. In J. van Leeuwen, editor:
Handbook of Theoretical Computer Science, Volume B: Formal Models and Semantics. Elsevier Science
Publishers and MIT Press, pp. 193–242.
[11] Vincent Danos & Cosimo Laneve (2004): Formal Molecular Biology. Theoretical Computer Science 325(1), pp. 69–110.
[12] Hartmut Ehrig, Gregor Engels, Hans-Jörg Kreowski & Grzegorz Rozenberg, editors (1997): Handbook of
Graph Grammars and Computing by Graph Transformations, Volume 2: Applications, Languages, and Tools. World Scientific.
[13] Hartmut Ehrig, Hans-Jörg Kreowski, Ugo Montanari & Grzegorz Rozenberg, editors (1997): Handbook
of Graph Grammars and Computing by Graph Transformations, Volume 3: Concurrency, Parallelism, and Distribution. World Scientific.
[14] Claudia Ermel, Michael Rudolf & Gabriele Taentzer (1997): The AGG Approach: Language and
Environ-ment. In: [12]. World Scientific, pp. 551–603.
[15] James R. Faeder, Michael L. Blinov & William S. Hlavacek (2009): Rule-Based Modeling of Biochemical
Systems with BioNetGen. In Ivan V. Maly, editor: Systems Biology. Methods in Molecular Biology, Humana Press, pp. 133–168.
[16] Maribel Fernández, Hélène Kirchner & Olivier Namet (2010): A strategy language for graph rewriting. Submitted, seehttp://www.oliviernamet.co.uk/Publications.html.
[17] Maribel Fernández & Olivier Namet (2010): Strategic Programming on Graph Rewriting Systems. In: Proc.
of the 1stInternational Workshop on Strategies in Rewriting, Proving, and Programming.
[18] Chris Fox, Maribel Fernández & Shalom Lappin (2008): Lambda Calculus, Type Theory, and Natural
Lan-guage II. J. Log. Comput. 18(2), p. 203.
[19] Rubino Geiß, Gernot Veit Batz, Daniel Grund, Sebastian Hack & Adam Szalkowski (2006): GrGen: A Fast
SPO-Based Graph Rewriting Tool. In Andrea Corradini, Hartmut Ehrig, Ugo Montanari, Leila Ribeiro & Grzegorz Rozenberg, editors: ICGT. Lecture Notes in Computer Science 4178, Springer, pp. 383–397. [20] Jean Krivine, Robin Milner & Angelo Troina (2008): Stochastic Bigraphs. Electr. Notes Theor. Comput. Sci.
218, pp. 73–96.
[21] Yves Lafont (1990): Interaction Nets. In: Proc. of the 17thACM Symposium on Principles of Programming Languages (POPL’90). ACM Press, pp. 95–108.
[22] Ulrich Nickel, Jörg Niere & Albert Zündorf (2000): The FUJABA environment. In: ICSE. pp. 742–745. [23] Detlef Plump (2009): The Graph Programming Language GP. In Symeon Bozapalidis & George Rahonis,
editors: CAI. Lecture Notes in Computer Science 5725, Springer, pp. 99–122.
[24] Arend Rensink (2003): The GROOVE Simulator: A Tool for State Space Generation. In John L. Pfaltz, Manfred Nagl & Boris Böhlen, editors: AGTIVE. Lecture Notes in Computer Science 3062, Springer, pp. 479–485.
[25] Grzegorz Rozenberg, editor (1997): Handbook of Graph Grammars and Computing by Graph
[26] Andy Schürr, Andreas J. Winter & Albert Zündorf (1997): The PROGRES Approach: Language and
Envi-ronment.In: [12]. World Scientific, pp. 479–546.
[27] J. R. Ullmann (1976): An Algorithm for Subgraph Isomorphism. JACM 23(1), pp. 31–42.
[28] Daqian Zhang & Kang Zhang (1997): Reserved Graph Grammar: A Specification Tool for Diagrammatic